Abstract
Ferroelectrics sometimes show large electro-optical and non-linear optical effects, available for polarization rotation and frequency conversion of light, respectively. If the amplitude of ferroelectric polarization is modulated in the picosecond time domain, terahertz repetition of optical switching via electro-optical and non-linear optical effects would be achieved. Here we show that polarization amplitude can be rapidly modulated by a terahertz electric field in an organic ferroelectric, tetrathiafulvalene-p-chloranil (TTF-CA). In this compound, alternately stacked donor (TTF) and acceptor (CA) molecules are dimerized via the spin-Peierls mechanism, and charge transfer within each dimer results in a new type of ferroelectricity called electronic-type ferroelectricity. Using a terahertz field, the intradimer charge transfer is strongly modulated, producing a subpicosecond change in the macroscopic polarization, which is demonstrated by transient reflectivity and second-harmonic generation measurements. Subsequently, coherent oscillation of the dimeric molecular displacements occur, which is explained by the modulation of the spin moment of each molecule.
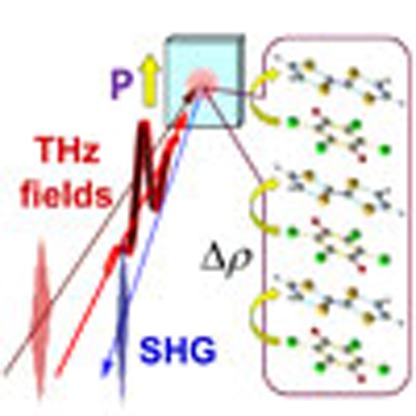 Controlling ferroelectric polarization on a terahertz timescale is a challenge, because typically the domain-wall motion occurs on much longer time scales. Here, the authors achieve control over the electronic ferroelectricity in an organic material using a terahertz pump–probe technique.
Ferroelectrics are commonly used in electrical devices such as random access memory, capacitors and piezoelectric actuators1,2. Other important applications of ferroelectrics are based upon their electro-optical and non-linear optical effects. Electro-optical effects represented by the Pockels effect are used to rotate light polarization by an electric field, whereas non-linear optical effects are indispensable for second-harmonic generation (SHG) and other wavelength conversions of light. If the amplitude of ferroelectric polarization is rapidly modulated by electric fields, advanced control of light would be achieved. The modulation frequency of electric fields applied to ferroelectrics is usually limited to the order of megahertz. Therefore, it is difficult to control the amplitude of ferroelectric polarization in the picosecond time domain, which corresponds to the typical switching time necessary for modern optical switching devices.
One possible means of rapid control of the ferroelectric polarization amplitude is to use a terahertz (THz) electric field. Recent developments in femtosecond laser technology have enabled the generation of intense THz pulses with ~1 ps duration and a nearly monocyclic electric field of up to ~1 MV cm−1 (ref. 3). The generation of such an intense THz pulse has opened up new avenues for controlling electron and lattice systems in solids in the picosecond or subpicosecond time domain. In inorganic semiconductors in particular, the response of excitons and carriers to strong THz fields has yielded attractive physical phenomena such as carrier multiplication4 and coherent ballistic motion of electrons in GaAs5. More recently, an insulator-metal transition induced by an extremely strong THz field has been reported in VO2 (ref. 6). However, picosecond control of ferroelectric polarization amplitude by a THz field has not been achieved yet. This is probably because in conventional ferroelectrics, the typical time constants for domain-wall motion (ms to μs) are much longer than 1 ps and the local responses of ions responsible for ferroelectric polarization are small owing to the small charge−mass ratio of the related ions. To overcome those difficulties, here we focused on a new type of ferroelectric, tetrathiafulvalene (TTF)-p-chloranil (CA), which shows electronic-type ferroelectricity7,8,9.
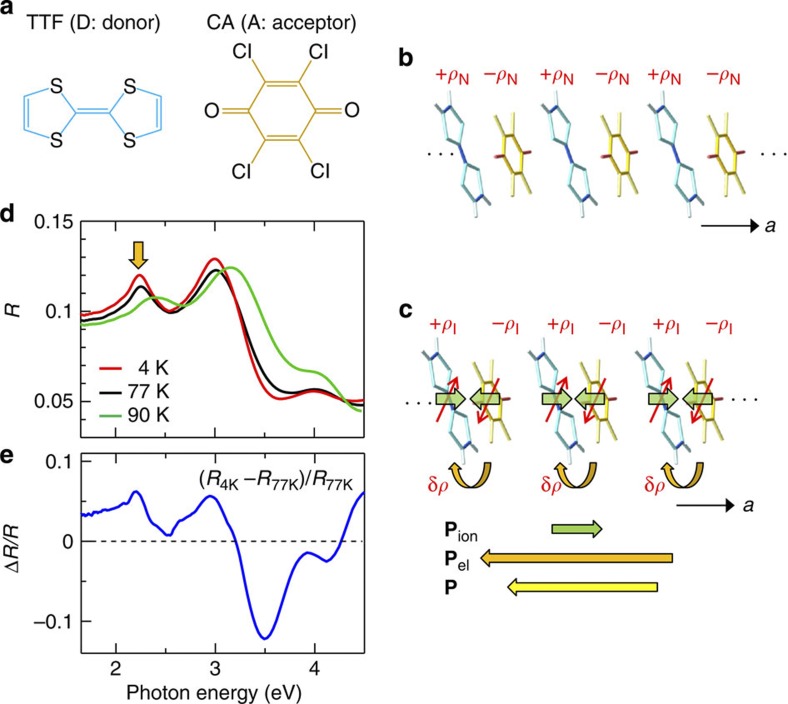
TTF-CA is an organic charge-transfer compound composed of alternately stacked donor (D) TTF and acceptor (A) CA molecules (Fig. 1a)10. Under decreasing temperature, TTF-CA exhibits a neutral to ionic phase transition at Tc~81 K (ref. 11). The ionic phase is stabilized, because the long-range Coulomb attractive interaction overcomes the ionization energy of DA pairs10. Because of the overlap of π-orbitals for D and A molecules along the stacking axis a, the degree of charge transfer (ρ) from D to A is not equal to 0 or 1, but rather is ρN~0.3 in the neutral phase (Fig. 1b) and ρI~0.6 in the ionic phase (Fig. 1c)12. In the ionic phase, DA molecules are dimerized by the spin-Peierls mechanism13. In addition, the dimeric molecular displacements are three-dimensionally ordered in phase13, yielding in ferroelectricity14,15.
Figure 1. Molecular structures and neutral to ionic phase transition in TTF-CA.
(a) Molecular structures of TTF and CA. (b) Schematic of the neutral phase. (c) Schematic of the ionic phase. ρN and ρI are the degrees of charge transfer in the neutral and ionic phases, respectively. Pion and Pel are the polarizations in the ionic phase due to the molecular displacements and the fractional charge transfer (δρ), respectively. P (=Pion+Pel) is the net polarization. (d) Polarized reflectivity (R) spectra for the electric field of light Er⊥a at 90 K in the neutral phase, and at 4 and 77 K in the ionic phase. The arrow indicates the probe energy (2.2 eV) in the transient R measurements of Fig. 2. (e) Differential R spectrum, (R4K−R77K)/R77K, between 77 K and 4 K.
TTF-CA in the ionic phase had been considered to be a displacive-type ferroelectric, in which dimeric displacements of ionic molecules (D+ρI and A−ρI) produce the ferroelectric polarization Pion along the a axis as indicated by the green arrows in Fig. 1c (ref. 15). However, recent X-ray and theoretical studies revealed that the direction of the net polarization P is opposite to that of Pion7,8,9. This indicates that the polarization P originates not from the displacements of ionic molecules (Pion) but from the additional charge-transfer processes with a magnitude of δρ within each dimer, as shown by the curved arrows in Fig. 1c. The polarization due to these charge-transfer processes is denoted by Pel. This type of ferroelectricity is called electronic-type ferroelectricity, as the polarization is dominated by electron or charge distributions. In fact, the polarization reaches 6.3 μC m−2, which is 20 times as large as that of the point charge model9. In such an electronic-type ferroelectric, we will be able to modulate the amplitude of the polarization P on a sub-picosecond timescale by a THz electric field via the change of ρ. Aiming at such rapid modulation of polarization amplitude, here we perform THz-pump optical-probe and SHG-probe measurements on TTF-CA, which can detect field-induced changes of the degree of charge transfer (ρ) and the polarization P, respectively. The results clearly show that the amplitude of the ferroelectric polarization can be rapidly modulated by a THz field. This is the first example of the THz-field modulation of polarization amplitude in electronic-type ferroelectrics.
Results
THz-pump optical-probe measurements
Figure 1d shows the polarized reflectivity (R) spectra of TTF-CA with an electric field of light Er perpendicular to (⊥) the a axis at 4 and 77 K in the ionic phase and at 90 K in the neutral phase. The peaks at around 2.2 and 3 eV are due to the intramolecular transitions of TTF molecules. The energy positions of these bands are known to depend sensitively on the degree of charge-transfer (ρ)10. As the temperature decreases, both peaks shift to a lower energy, reflecting the increase of ρ (ρ~0.32 at 90 K, ρ~0.53 at 77 K and ρ~0.58 at 4 K; values of ρ were evaluated from the frequencies of the infrared-active C=O stretching mode of CA molecules reported in ref. 12). Figure 1e shows the differential reflectivity spectrum (R4K−R77K)/R77K between 4 K (ρ~0.58) and 77 K (ρ~0.53), which reflects an increase in the degree of charge transfer (ρ) of ~0.05. Here we focus on the lower-energy band to detect transient changes of ρ.
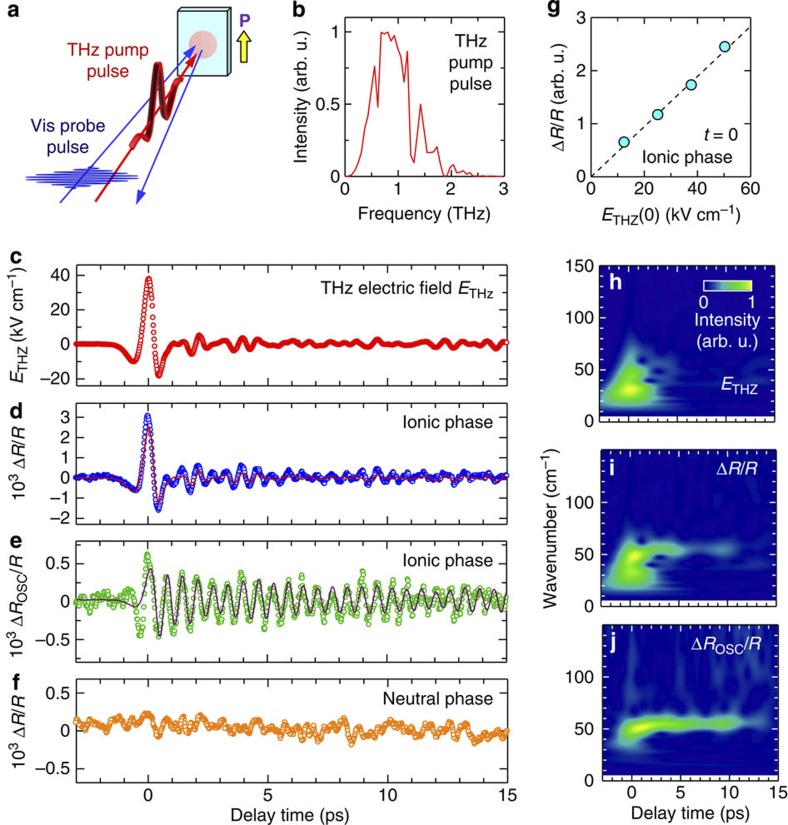
Figure 2a shows a schematic of the THz-pump optical-probe measurement. The electric field waveform [ETHz(t)] of a THz pulse is presented in Fig. 2c. The maximum of ETHz(t)[ETHz(0)] is 38 kV cm−1. Figure 2b shows the intensity spectrum of the THz pulse obtained from the Fourier transformation of ETHz(t) in Fig. 2c, which is a broad spectrum from 5–60 cm−1 with a peak at around 25 cm−1 (0.75 THz).
Figure 2. THz-pump optical-probe measurements of TTF-CA.
(a) Schematic of setup. (b) Spectrum of the THz-pump pulse. (c) Waveform of THz field [ETHz(t)] set parallel to the a axis. (d) Time evolution of ΔR/R for Er⊥a at 78 K in the ionic phase and the normalized ETHz(t) (solid line). (e) Oscillatory component ΔROSC(t)/R and fitting curve (solid line). (f) Time evolution of ΔR/R at 82 K in the neutral phase. (g) ETHz(0) dependence of maximum ΔR/R values at t=0 ps and at 78 K in the ionic phase. (h–j) Time-dependent Fourier power spectra of (h), ETHz(t) (i), ΔR/R and (j) ΔROSC/R, respectively.
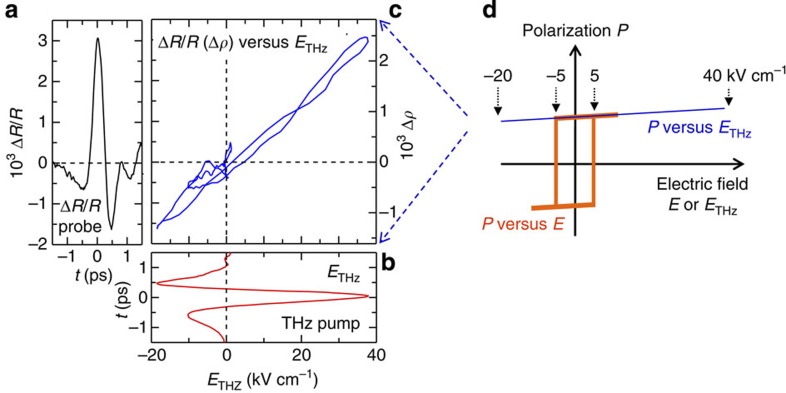
First, the probe energy is set at 2.2 eV, which corresponds to the peak of (R4K−R77K)/R77K (the arrow in Fig. 1d). The reflectivity (R) change, ΔR/R, at this energy is considered to reflect sensitively the change in ρ. The time evolution of ΔR/R (2.2 eV) by the THz field at 78 K (just below Tc) is shown in Fig. 2d. The solid line in the same figure is the normalized THz waveform [ETHz(t)]. The initial time characteristic of ΔR/R is in good agreement with ETHz(t). To see the interrelation between ΔR/R and ETHz(t) within the duration of a THz pulse more precisely, we compared the time evolutions of ΔR/R (Fig. 3a) and ETHz(t) (Fig. 3b), and plotted in Fig. 3c ΔR/R as a function of ETHz(t) for the delay time t of −1.5 ps≤t≤1.5 ps. We obtain a clear linear relation between ΔR/R and ETHz(t). The maximum of ΔR/R (t=0 ps) is also proportional to ETHz(0) as shown in Fig. 2g. These results suggest that the observed response is an electro-optical effect and also a kind of second-order optical non-linearity in a broad sense.
Figure 3. Changes of the polarization P by the THz field in TTF-CA.
(a) Time evolution of the reflectivity change ΔR/R at 2.2 eV (Er⊥a) induced by the THz electric field ETHz in the ionic phase (78 K) for the delay time t of −1.5 ps≤t≤1.5 ps. ΔR/R reflects the change (Δρ) of the degree of charge transfer ρ for the delay time. (b) Time evolution of ETHz for −1.5 ps≤t≤1.5 ps. (c) ΔR/R as a function of ETHz derived from a and b. The right vertical axis denotes Δρ, which corresponds to the change (ΔP) of the polarization P (see the text). (d) Schematics of the P−E curves for the THz electric field ETHz (blue line) and for the quasi-static electric field E (orange line). The former was deduced from a–c; see the text). Coercive field for an electric field with 10 Hz is ±5 kV cm−1 at ~50 K (ref. 9).
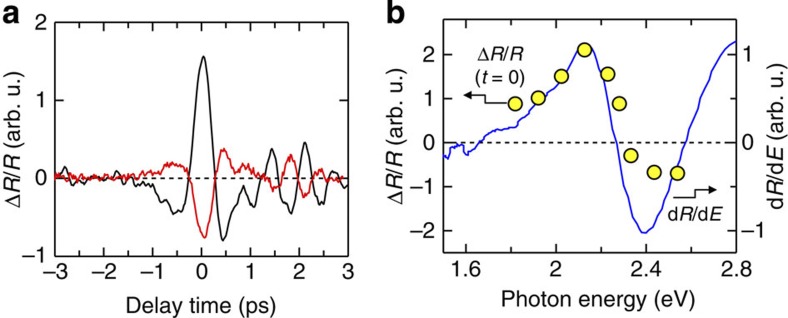
To ascertain that the ΔR/R signals are due to the THz-field-induced changes (Δρ) of ρ, we measured the probe energy dependence of the reflectivity changes at 78 K. In Fig. 4a, we showed the initial time characteristic at 2.2 eV (the black line) and 2.4 eV (the red line) as typical examples. The sign of the ΔR/R (t=0 ps) signal at 2.2 eV is positive similarly to the result in Fig. 2d and that at 2.4 eV is negative, whereas time characteristics of |ΔR/R| at 2.4 and 2.2 eV are similar to each other. In Fig. 4b, we plotted by open circles the ΔR/R (t=0 ps) values as a function of the probe energy. This spectrum is almost equal to the first derivative (dR/dE) of the reflectivity spectrum R at 77 K with respect to the photon energy E shown by the solid line in Fig. 4b, which corresponds to the reflectivity change by the increase of ρ. This demonstrates that the initial ΔR/R signals are attributable to the THz-field-induced increases of ρ. A slight discrepancy between ΔR/R (t=0 ps) and dR/dE might be attributed to the increase of the intensity of the intramolecular transition in this region due to the increase of ρ.
Figure 4. Probe-energy dependence of THz-field-induced reflectivity changes in TTF-CA.
(a) Reflectivity changes ΔR/R (Er⊥a) at 2.2 eV (black line) and 2.4 eV (red line) by THz fields at 78 K in the ionic phase. (b) Probe energy dependence of ΔR/R at t=0 ps and at 78 K (circles). Solid line shows the first derivative (dR/dE) of the R spectrum at 77 K with respect to the photon energy E, which shows the R changes due to the slight increase of ρ. The similarity between ΔR/R and dR/dE is a strong evidence for the modulation of the degree of charge transfer ρ by THz electric fields.
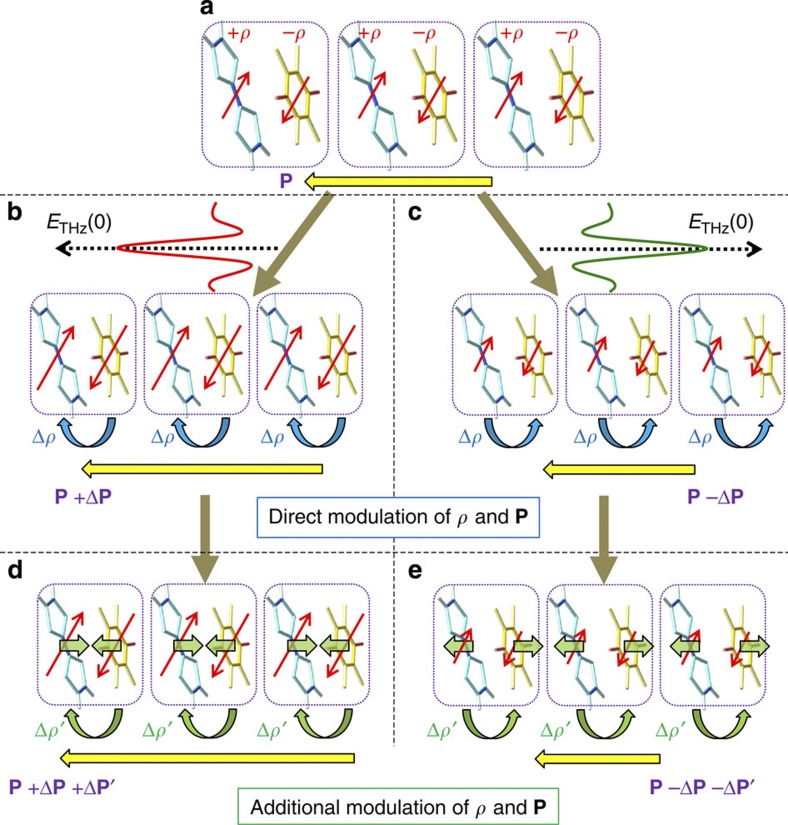
As seen in Fig. 2d, the initial change in the degree of charge transfer (ρ) occurs with no delay from the THz field; thus, this should be due to purely electronic processes and is attributable to the field-induced transfer of fractional charges in dimers, which is illustrated in Fig. 5 (a→b, a→c). The frequency (the timescale) characterizing the charge dynamics in TTF-CA is estimated to be ~50 THz (~20 fs) from the transfer energy between TTF and CA (~0.2 eV) (ref. 16), so that the charge-transfer process in each dimer can completely follow the THz field as observed. Thus, we can consider that the subpicosecond modulation of the polarization amplitude is achieved via purely electronic (charge transfer) processes.
Figure 5. Schematics of the modulation of the degree of charge transfer by THz fields in TTF-CA.
(a) Ionic phase with ferroelectric polarization P. (b,c) Direct modulation of charge transfer and polarization by THz fields with ETHz(0) directed to the left (b) and right (c), respectively. (d,e) Additional modulation of charge transfer and polarization via dimeric molecular oscillations; the increase (d) and decrease (e) of dimeric molecular displacements, charge transfer and polarization.
In the cases of Figs 2d and 4a (the black line), ΔR/R (Δρ) at t=0 ps is positive, indicating that ΔP is positive and the direction of ETHz(0) is parallel to the original polarization P as shown in Fig. 5a,b. We performed the similar THz-pump optical-probe measurements on several samples, some of which showed negative ΔR/R (Δρ and ΔP) signals at t=0 ps. In those samples, the original ferroelectric polarization P is considered to be antiparallel to ETHz(0) (Fig. 5c).
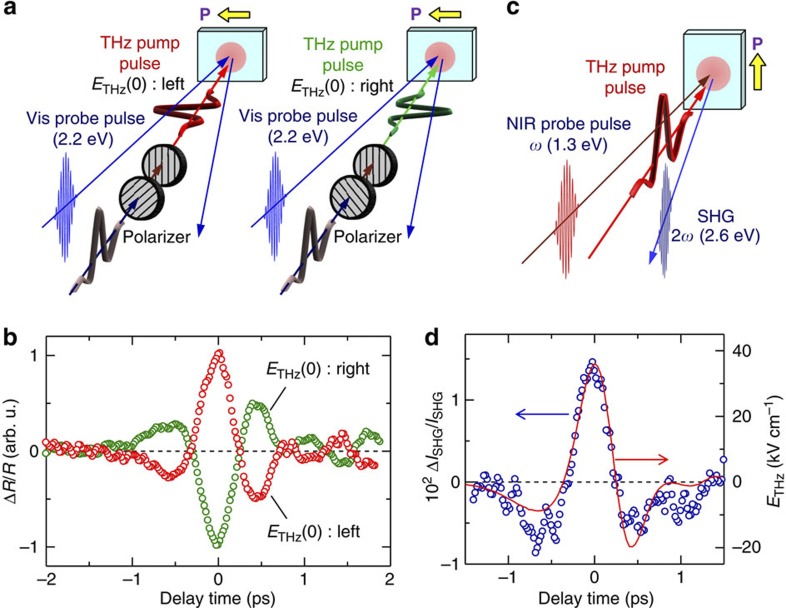
To confirm such a field-direction-dependent change in ρ more directly, we prepared THz pulses with opposite directions of ETHz(0) using two polarizers as illustrated in Fig. 6a (see Methods). When the direction of ETHz(0) was reversed from left to right (Fig. 6a), the sign of ΔR/R, that is, the sign of Δρ, was indeed reversed as shown in Fig. 6b. Thus, we can increase or decrease the degree of charge transfer (ρ) by the appropriate choice of the THz field direction relative to the direction of the ferroelectric polarization P.
Figure 6. Verification of THz-field-induced polarization modulations in TTF-CA.
(a) Schematics of the THz-pump optical-probe experiments with polarization reversal of ETHz(0). The probe energy is 2.2 eV in the visible (Vis) region. (b) Time evolution of ΔR(t)/R by THz fields with ETHz(0) directed to the left and right at 78 K. (c) Schematic of THz-pump SHG-probe experiments. Energies of the incident probe light and the SH light are 1.3 eV in the near-infrared (NIR) region and 2.6 eV in the visible region, respectively. (d) Time evolution of SHG intensity ΔISHG(t)/ISHG at 65 K and the waveform of ETHz(t) (red line).
The subsequent R change for t>0.5 ps cannot be reproduced by ETHz(t) alone as shown in Fig. 2d. An additional oscillatory component seems to exist in ΔR/R. By subtracting the normalized THz waveform [ETHz(t)] from ΔR/R, we extracted the oscillatory component ΔROSC/R and showed it in Fig. 2e. The period of the oscillation is about 0.6 ps. We also performed wavelet analyses18 and obtained the time dependence of the Fourier power spectra of the THz waveform ETHz(t), the reflectivity change ΔR/R and the oscillatory component ΔROSC/R, which are shown as contour maps in Fig. 2h–j, respectively. ETHz(t) ranges from 5 to 60 cm−1 and is localized at around the time origin. Conversely, ΔROSC/R shows a monochromatic component at 54 cm−1, which is observed even for t>10 ps. This component is also clearly observed in ΔR/R. This oscillation mode with 54 cm−1 modulates the degree of charge transfer (ρ) so that it is reasonable to assign it to the lattice mode modulating the intermolecular interaction. The most plausible origin of this mode is the optical mode of the lattice phonon with the displacements of D and A molecules along the a axis as shown by the short green arrows in Fig. 5d,e. This mode becomes Raman active by the molecular dimerization due to the spin-Peierls mechanism and should be detected by Raman spectroscopy in the ionic phase. The results of the Raman spectroscopy are reported in the next subsection.
Polarized Raman spectroscopy measurements
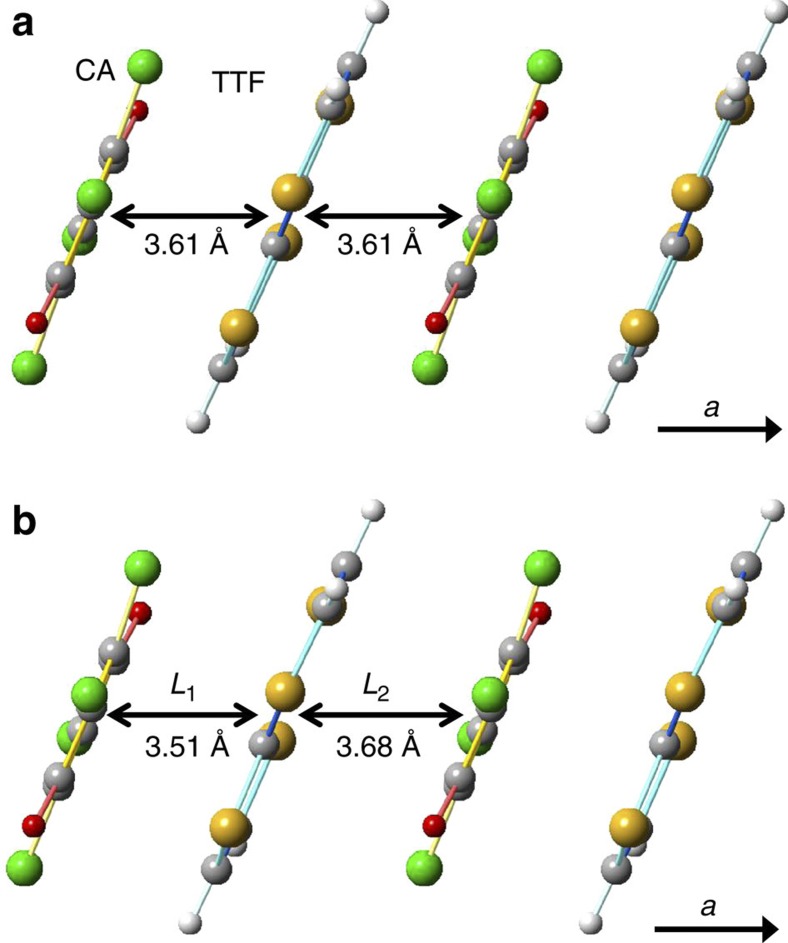
Before detailing the results of the Raman spectroscopy, we briefly comment on the molecular dimerization in TTF-CA. Figure 7a,b show the molecular arrangements at 90 K in the neutral phase and at 40 K in the ionic phase, respectively, which were viewed along the direction perpendicular to the stacking axis a. The values of the intermolecular distances were obtained from the structural data reported in ref. 13. In the ionic phase at 40 K, the difference (L2−L1) of the interdimer DA distance (L2) and intradimer DA distance (L1) is 0.17 Å, and the dimeric molecular displacement, l=(L2−L1)/2, along the a axis is ~0.085 Å. Thus, l is large, reaching ~2.4% of the averaged distance ~3.60 Å between the neighbouring D and A molecules.
Figure 7. Molecular arrangements in TTF-CA.
(a) 90 K in the neutral phase. (b) 40 K in the ionic phase. Molecules are viewed along the direction perpendicular to the stacking axis a. L1 and L2 denote the intradimer and interdimer distances, respectively.
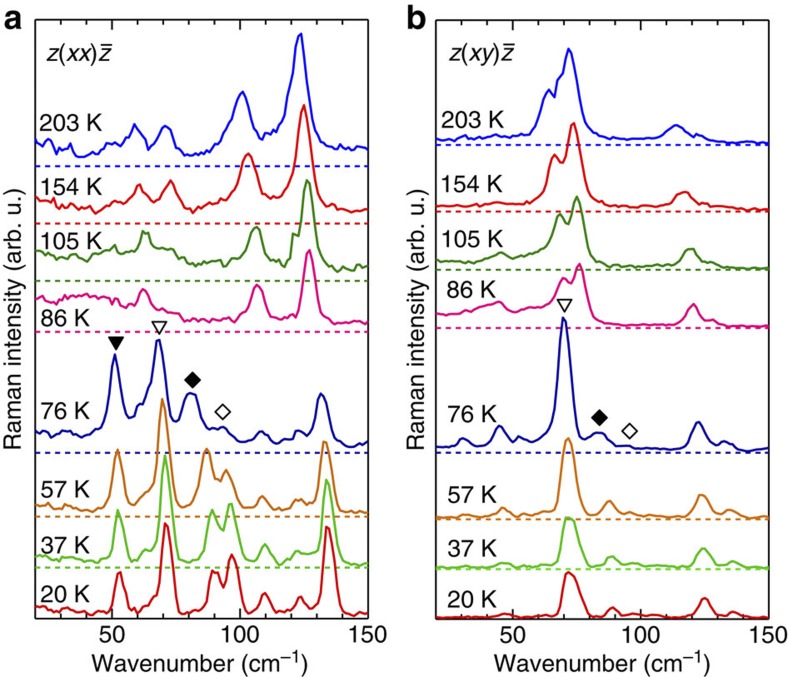
The polarized Raman spectra of TTF-CA were previously reported by Masino et al.19 To characterize the coherent oscillation with 54 cm−1 induced by the THz electric field, in the present study we measured the temperature dependence of Raman spectra with the polarization configurations of z(xx) and z(xy)
 , which were not measured in the previous studies19. The results are shown in Fig. 8. Here, x corresponds to the stacking axis a and z denotes the direction of the incident light normal to the crystal surface (the ab plane).
Figure 8. Temperature dependence of polarized Raman spectra in TTF-CA.
(a) z(xx) , (b) z(xy)
 . x corresponds to the stacking axis a, and z denotes the direction of the incident light normal to the crystal surface (the ab plane). The excitation photon energy is 1.96 eV.
In the spectra for z(xx) above Tc (81 K), no strong Raman bands were observed in the low-frequency region below 90 cm−1. When the temperature is decreased down to 76 K below Tc, four bands at 52, 68, 81 and 94 cm−1 were activated in the low-frequency region as indicated by solid triangle, open triangle, solid diamond and open diamond, respectively. Among them, the 52-cm−1 band (solid triangle) is not activated for z(xy)
 but is completely polarized along the a axis, indicating that the molecular displacements responsible for this band occur along the a axis. Thus, we can conclude that this Raman band is due to the optical mode with the molecular displacements along the a axis, which are associated with the spin-Peierls dimerization shown in Fig. 7b. The other three bands indicated by open triangle, solid diamond and open diamond are strengthened or activated for z(xy)
 below Tc. Taking into account such polarization dependence, it is natural to consider that those bands are attributable to shear-type modes or librational modes, which are also related to the spin-Peierls dimerization.
The frequency of the coherent oscillation (54 cm−1) induced by the THz electric field is very close to the frequency (52 cm−1) of the Raman band shown by solid triangle in Fig. 8a, so that the coherent oscillation is attributable to the optical mode with the molecular displacements along the a axis. The generation mechanism of the oscillation will be discussed in the Discussion section.
THz-pump SHG-probe measurements
So far, we have been considering that the field-induced change in the ferroelectric polarization P (ΔP/P) is synchronized with Δρ. By using SHG as the probe, we can directly detect ΔP/P. Figure 6c shows the experimental setup of the THz-pump SHG-probe measurements and Fig. 6d shows the time evolution of the THz-field-induced change (ΔISHG/ISHG) in the SHG intensity (ISHG) with an incident probe pulse of 1.3 eV at 65 K. The time characteristic of ΔISHG/ISHG is in good agreement with the THz waveform (ETHz) shown by the red line in Fig. 6d. This indicates that the ferroelectric polarization P was modulated as the polarization change ΔP was proportional to the THz electric field ETHz.
Discussion
In this section, we first discuss the magnitude of the modulation of ρ by THz fields. The quantitative evaluation of the initial change (Δρ) in ρ is possible by comparing the maximum of ΔR/R (t=0 ps) at 2.2 eV (~3.1 × 10⁻³) obtained from Fig. 2d with the normalized difference in the reflectivity between 4 K and 77 K, (R4 K−R77 K)/R77 K at 2.2 eV (~6.2 × 10⁻²) shown in Fig. 1e. Taking into account the difference (~0.05) in ρ between 4 K (ρ~0.58) and 77 K (ρ~0.53), the initial change Δρ was evaluated to be ~2.5 × 10⁻³ at 38 kV cm−1.
We can also evaluate the magnitude of the polarization changes from the THz-field-induced changes of the SHG intensity. Assuming that the second-order non-linear susceptibility χ(2) is proportional to the polarization magnitude P, ISHG P2 and, thus, ΔISHG/ISHG~2ΔP/P. From this relation and the maximum of ΔISHG/ISHG~1.5 × 10−2, we obtain ΔP/P~0.75% at 36 kV cm−1.
As discussed in the previous section, the ferroelectric polarization P is dominated by the additional charge transfer δρ within a dimer at the neutral to ionic transition. Therefore, we can also estimate the value of ΔP/P from Δρ obtained by the THz-pump optical-probe measurements. From the frequency change of the C=O stretching mode of CA molecules across the neutral to ionic transition12, δρ is evaluated as ~0.2. Assuming that δρ (~0.2) is responsible for all of the ferroelectric polarization P in the ionic phase and using the value of Δρ(~2.5 × 10⁻³) experimentally obtained, the THz-field-induced change ΔP/P of the polarization is estimated to be ~1.25% at 38 kV cm−1. This value is consistent with ΔP/P (0.75%) evaluated from the THz-field-induced change in SHG, |ΔISHG/ISHG|. This supports our interpretation that P is modulated via the change in ρ. The difference of ΔP/P between each evaluation would be attributable to the other factors contributing to the ferroelectric polarization, such as modification of molecular orbitals and molecular deformations.
It is valuable to compare the responses to THz fields with those to quasi-static electric fields with frequencies of ~10 Hz−1 kHz reported in P−E (ref. 9) and electro-reflectance15 measurements previously reported. According to them, the coercive field Ec is ~5 kV cm−1 at ~50 K (ref. 9) and ~1 kV cm−1 at 77 K (ref. 15). At around Ec, ferroelectric domain walls started to move. In the THz measurements, the situation is considerably changed. Considering that ΔR/R~3.1 × 10−3 at 2.2 eV corresponds to Δρ~2.5 × 10⁻³, the ΔR/R−ETHz curve in Fig. 3c can be converted to the Δρ−ETHz curve (see the right vertical axis in the same figure). Using the magnitude of the charge transfer δρ~0.2 responsible for the ferroelectric polarization, we obtain the (δρ+Δρ)−ETHz curve, which can be regarded as the P−ETHz curve, as P is proportional to (δρ+Δρ) as discussed above. In Fig. 3d, we show schematically the comparison of the P−ETHz curve thus obtained and the P−E curve measured by the quasi-static fields (10 Hz) at ~50 K (ref. 9). This figure shows that by using a THz pulse, we can apply very high electric fields at least up to ~40 kV cm−1 on a sample without any domain-wall motions and polarization reversals. It is because domain-wall motions are much slower compared with the electric-field changes within the duration of a THz pulse. Such a situation enables the rapid modulation of ferroelectric polarization amplitude in the picosecond timescale.
Next, we discuss the generation mechanism of the coherent molecular oscillation. A possible mechanism is the direct generation of the oscillation by the THz field. This possibility is excluded, however, because the directions of the field-induced displacements of D and A molecules are opposite to those expected for displacive-type ferroelectricity, as mentioned above (see Fig. 1c). Note that the first cycle of the oscillatory change of ρ in Fig. 2e is in good agreement with the initial rapid change of ρ in Fig. 2d directly driven by the THz electric field. This suggests that D (A) molecules move antiparallel (parallel) to the original polarization P (Fig. 5d), when ETHz(0) is parallel to P (Fig. 5b) as in the case of Fig. 2. In addition, if the direct generation of the molecular oscillation by the THz field is possible, it should also occur above Tc, as each molecule has a fractional charge of ±0.3 even in the neutral phase. However, no oscillations were observed in ΔR/R at 82 K in the N phase as shown in Fig. 2f. Previous infrared vibrational spectroscopy on TTF-CA revealed that no strong absorptions appeared at around 54 cm−1 in the neutral phase19,20 nor the ionic phase19, suggesting that the dipole moment of the 54 cm−1 mode is small. These results are consistent with our interpretations.
The most plausible mechanism for the generation of the coherent molecular oscillation is the modulation of the spin-Peierls dimerization via rapid modulation of ρ. When the direction of ETHz(0) is parallel to the ferroelectric polarization P (Fig. 5b), ρ should be increased first to ρ+Δρ(t) via an electronic process, so P is increased as mentioned above. The increase in ρ induces an increase in the spin moment of each molecule as illustrated by the red arrows in Fig. 5b. Then the spin-Peierls mechanism works more effectively and molecular dimerization is strengthened. The resultant increase in the molecular displacements further increases the degree of charge transfer from ρ+Δρ to ρ+Δρ+Δρ′ by increasing the Coulomb attractive interaction within each dimer. Thus, the THz field gives rise to a forced molecular oscillation of the spin-Peierls mode via the change in ρ. Then an additional oscillation in the degree of charge transfer with amplitude Δρ′ and in the polarization with amplitude ΔP′ occurs, synchronized with the molecular oscillation as illustrated in Fig. 5d,e. When the direction of ETHz(0) is antiparallel to the original polarization P as shown in Fig. 5c, ρ should first decrease and then oscillate coherently, triggered by the decrease in the dimeric molecular displacements (Fig. 5e).
In this mechanism, the time evolution of ΔROSC/R is expressed by the following formula, which is the convolution of ETHz(t) and a sine-type damped oscillator.
 |
Here, τ0 and Ω are the decay time and frequency of the oscillation, respectively. (The derivation of equation (1) is detailed in the Methods section.) By using this formula, the time evolution of ΔROSC/R was reproduced well with a value of τ0~8.7 ps and Ω~54 cm−1 as shown by the solid line in Fig. 2e. From such a success of the reproduction of the result, we conclude that the coherent oscillation of the degree of charge transfer ρ originates from the modulation of the spin-Peierls dimerizations due to the rapid change of ρ, which is induced by the THz electric field. To clarify the microscopic mechanism for the generation of the dimeric molecular oscillation and, in particular, the role of the polarization changes on it, the modern theoretical approach based on Berry-phase7 would be necessary.
It is valuable to evaluate quantitatively the THz-field-induced change of the dimeric molecular displacement. This is possible by assuming that the change of the displacement along the a axis is proportional to the additional increase in the degree of charge transfer, which is reflected by the amplitude of ΔROSC/R. At 40 K, the dimeric molecular displacements l is 0.085 Å as mentioned above (see Fig. 7b). Comparing the initial amplitude of the oscillation ΔROSC/R~5 × 10−4 with the normalized reflectivity change between 77 (ionic phase) and 90 K (neutral phase), (R77K−R90K)/R90K~0.1, the change of the displacement Δl/l induced by the THz electric field was evaluated to be 5 × 10⁻³ at 38 kV cm−1.
The previous femtosecond optical-pump reflection-probe spectroscopy on TTF-CA reported that a coherent oscillation with the same frequency was observed in the transient reflectivity changes and assigned to the lattice mode corresponding to the spin-Peierls dimerization17,21. In this case, the ionic domains are photogenerated in the neutral lattice and the oscillation is generated in those ionic domains. In the present study, however, the oscillation is generated through the rapid modulation of the degree of charge transfer directly induced by the THz electric field, so that the generation mechanism of the oscillation is essentially different from that previously reported.
In summary, subpicosecond modulation of the ferroelectric polarization amplitude by a THz electric field was successfully achieved in TTF-CA. The THz-field-induced polarization changes were not due to domain-wall motions but due to the modulation of the degree of charge transfer within each dimer, which is a purely electronic process and can occur without any energy loss. Such responses originating from THz-field-induced charge-transfer processes are characteristic of electronic-type ferroelectricity. The initial modulation of the degree of charge transfer causes coherent molecular oscillation of the spin-Peierls mode via the change in the spin moment of each molecule, which induces additional modulation in the degree of charge transfer. The THz field control of ferroelectric polarization as presented here opens up the new possibility of realizing effective controls of structures as well as non-linear optical responses in ferroelectrics.
Methods
Sample preparation
Single crystals of TTF-CA were grown by the cosublimation method20. Black crystals with a typical size of 1.5 × 1.0 × 0.5 mm were obtained. The crystal orientation was checked by back Laue photographs and/or polarized reflectivity measurements.
THz-pump optical-probe and SHG-probe measurements
In the THz-pump optical-reflectivity-probe (Figs 2a and 6a) and SHG-probe (Fig. 6c) measurements, a Ti:sapphire regenerative amplifier (repetition rate of 1 kHz, central wavelength of 785 nm, pulse width of 130 fs and pulse energy of 2 mJ) was used as the light source. The output from the amplifier was divided into two beams. One was used to generate a THz pulse through optical rectification in a non-linear optical crystal, LiNbO3. To obtain a strong THz pulse, we adopted the method proposed by Hebling et al.22, wherein we can satisfy the phase-matching condition of the THz pulse and a 785 nm pulse by tilting the wave front of the 785 nm pulse incident on an edge-cut LiNbO3 crystal3. The electric field waveform (ETHz) of a THz-pump pulse was measured by an electro-optical sampling technique with a 1-mm-thick ZnTe crystal cut in the <110> direction22. In the measurement, to avoid saturation of the electro-optical signal due to the intense electric field, the amplitude of the electric field was systematically reduced to 1/12 by using a set of two wire-grid polarizers24 and a silicon plate. The recorded electro-optical signal ΔI/I was converted into the amplitude of the electric field using the equation,  , which was employed in a previous report3. Here, n0=2.87 (ref. 24) is the refractive index of ZnTe, r41 =4.04 pm V−1 (ref. 25) is the electro-optical coefficient of ZnTe, tZnTe=2/(nTHz+1)=0.47 is the Fresnel transmission coefficients of ZnTe, where nTHz=3.17 (ref. 26) is the refractive index of ZnTe at 1 THz. L=1 mm is the thickness of the ZnTe crystal, and λ0=785 mm is the central wavelength of the input pulse. The actual amplitude was evaluated taking into account the reduction ratio. To control the ferroelectric polarization P, the polarization of a THz pulse was set parallel to the DA stacking axis a.
The other output from the amplifier was used as the excitation source of an optical parametric amplifier from which probe pulses with a photon energy of 1.3 or 1.8–2.6 eV and pulse width of 130 fs were obtained. For the optical reflectivity-probe measurements, the intensity of the probe pulse (1.8–2.6 eV) reflected from a single crystal was detected by a photodiode. For the SHG-probe measurements, the probe pulse incident on a single crystal was set to 1.3 eV, and the intensity of the SHG (ISHG) at 2.6 eV from a crystal was detected in the reflection configuration. During this experiment, we carefully checked that ISHG was proportional to the square of the intensity of the incident probe pulse. THz-field-induced changes in the reflectivity of these probe pulses and the SHG intensity were measured using a boxcar integrator. The diameter of the probe pulse was ~200 μm, which is comparable to or smaller than the typical size of ferroelectric domains in TTF-CA15. Therefore, by selecting an appropriate measured area on a single crystal, the dynamics of a single ferroelectric domain could be detected.
To obtain THz pulses with two opposite directions of ETHz(0), we used a pair of wire-grid polarizers, as shown schematically in Fig. 6a; the first polarizer rotates the polarization direction from 90° (vertical) to 90±45°. The second polarizer further rotates the polarization direction by ±45°, yielding two horizontal polarizations with opposite directions (right (0°) and left (180°)).
The delay time t of the probe pulse relative to the pump pulse was controlled by changing the path length of the former. The time origin (t=0 ps) is set at the time giving the maximum |ETHz(t)|.
Derivation of equation (1)
As discussed in the text, the THz field induces instantaneous modulation of the degree of charge transfer (Δρ(t)) and also the spin moment of each molecule. The latter causes molecular oscillation of the dimeric mode via modulation of the spin-Peierls mechanism. This molecular oscillation gives rise to the additional modulation of the degree of charge transfer (Δρ′(t)) via the modulation of the Coulomb attractive interaction within each dimer; the increase (decrease) in the dimeric molecular displacement increases (decreases) the degree of charge transfer. Here we detail the derivation of equation 1 that was used to analyse the oscillatory component of the reflectivity change, ΔROSC/R, which reflects the additional modulation of the degree of charge transfer (Δρ′(t)).
The total change in the degree of charge transfer (Δρt (t)) is expressed by the sum of the instantaneous change of charge transfer (Δρ(t)) and the additional modulation of charge transfer (Δρ′(t)) as
 |
Δρ(t) is proportional to ETHz(t), so that by using a proportional constant A, it can be expressed as
 |
Δρ′(t) can be expressed as the forced oscillation of a harmonic oscillator as follows.
 |
Here, f(t) is the displacement of the harmonic oscillator, which is given by the following formula with resonance frequency ω0 and damping constant γ. B is a proportional constant.
 |
Δρt(τ) in equation 4 is the external force, because it causes changes in the dimeric molecular displacements and, therefore, causes the additional change in the degree of charge transfer, Δρ′(t). The Fourier transformation of equation 2 gives the following equation.
 |
Here, ETHZ(ω) and Δρt(ω) are the Fourier transforms of ETHZ(t) and Δρt(τ), respectively. As a result, we obtain the following expression for Δρt(ω).
 |
The Fourier transform of equation 7 yields the following expression for Δρt(t).
 |
The second term of equation 8 corresponds to Δρ′(t). By introducing the decay time τ0=(1/γ) of the oscillation and the real frequency Ω , we obtain the following equation for Δρ′(t).
 |
Taking the relation ΔROSC/R Δρ′(t) into account, we finally obtain equation 1.
Author contributions
T.M., H. Yada and H. Yamakawa built the experimental apparatus and carried out the optical measurements. H.O. and T.M. prepared and characterized the samples. H.O. coordinated the study. All of the authors discussed the results and contributed to writing the paper.
Additional information
How to cite this article: Miyamoto, T. et al. Ultrafast modulation of polarization amplitude by terahertz fields in electronic-type organic ferroelectrics. Nat. Commun. 4:2586 doi: 10.1038/ncomms3586 (2013).
Acknowledgments
We thank Dr S. Ishibashi (AIST) for enlightening discussions. This work was supported in part by Grants-in-Aid from MEXT (No. 20110005) and JSPS (No. 25247049). T.M. was supported by a fellowship of the Japan Society for the Promotion of Science.
References
- Lines M. E. & Glass A. M. Principles and Applications of Ferroelectrics and Related Materials Oxford University Press: New York, (2001). [Google Scholar]
- Scott J. F. Applications of modern ferroelectrics. Science 315, 954–959 (2007). [DOI] [PubMed] [Google Scholar]
- Hirori H., Doi A., Blanchard F. & Tanaka K. Single-cycle terahertz pulses with amplitudes exceeding 1 MV cm−1 generated by optical rectification in LiNbO3. Appl. Phys. Lett. 98, 091106 (2011). [Google Scholar]
- Hirori H. et al. Extraordinary carrier multiplication gated by a picosecond electric field pulse. Nat. Commun. 2, 594 (2011). [DOI] [PMC free article] [PubMed] [Google Scholar]
- Kuehn W. et al. Coherent ballistic motion of electrons in a periodic potential. Phys. Rev. Lett. 104, 146602 (2010). [DOI] [PubMed] [Google Scholar]
- Liu M. et al. Terahertz-field-induced insulator-to-metal transition in vanadium dioxide metamaterial. Nature 487, 345–348 (2012). [DOI] [PubMed] [Google Scholar]
- Giovannetti G., Kumar S., Stroppa A., Van der Brink J. & Picozzi S. Multiferroicity in TTF-CA organic molecular crystals predicted through ab initio calculations. Phys. Rev. Lett. 103, 266401 (2009). [DOI] [PubMed] [Google Scholar]
- Ishibashi S. & Terakura K. First-principles study of spontaneous polarization in tetrathiafulvalene-p-chloranil (TTF-CA). Phys. B 405, S338–S340 (2010). [Google Scholar]
- Kobayashi K. et al. Electronic ferroelectricity in a molecular crystal with large polarization directing antiparallel to ionic displacement. Phys. Rev. Lett. 108, 237601 (2012). [DOI] [PubMed] [Google Scholar]
- Torrance J. B., Vazquez J. E., Mayerle J. J. & Lee V. Y. Discovery of a neutral-to-ionic phase transition in organic materials. Phys. Rev. Lett. 46, 253–257 (1981). [Google Scholar]
- Torrance J. B. et al. Anomalous nature of neutral-to-ionic phase transition in tetrathiafulvalene-chloranil. Phys. Rev. Lett. 47, 1747–1750 (1981). [Google Scholar]
- Horiuchi S., Okimoto Y., Kumai R. & Tokura Y. Anomalous valence fluctuation near a ferroelectric transition in an organic charge-transfer complex. J. Phys. Soc. Jpn 69, 1302–1305 (2000). [Google Scholar]
- Le Cointe M. et al. Symmetry breaking and structural changes at the neutral-to-ionic transition in tetrathiafulvalene-p-chloranil. Phys. Rev. B 51, 3374–3386 (1995). [DOI] [PubMed] [Google Scholar]
- Luty T. et al. Static and dynamic order cooperative multi-electron transfer. Europhys. Lett. 59, 619–625 (2002). [Google Scholar]
- Kishida H., Takamatsu H., Fujinuma K. & Okamoto H. Ferroelectric nature and real-space observations of domain motions in the organic charge-transfer compound tetrathiafulvalene-p-chloranil. Phys. Rev. B 80, 205201 (2009). [Google Scholar]
- Uemura H. & Okamoto H. Direct detection of the ultrafast response of charges and molecules in the photoinduced neutral-to-ionic transition of the organic tetrathiafulvalene-p-chloranil solid. Phys. Rev. Lett. 105, 258302 (2010). [DOI] [PubMed] [Google Scholar]
- Suzuki H., Kinjo T., Hayashi Y., Takemoto M. & Ono K. Wavelet transform of acoustic emission signals. J. Acoust. Emiss. 14, 69–84 (1996). [Google Scholar]
- Masino M. et al. Lattice dynamics of TTF-CA across the neutral-ionic transition. Chem. Phys. 325, 71–77 (2006). [Google Scholar]
- Girlando A. et al. Direct evidence of overdamped Peierls-coupled modes in the temperature-induced phase transition in tetrathiafulvalene-chloranil. Phys. Rev. B 78, 045103 (2008). [Google Scholar]
- Okamoto H. et al. Photoinduced phase transition in tetrathiafulvalene-p-chloranil observed in femtosecond reflection spectroscopy. Phys. Rev. B 70, 165202 (2004). [Google Scholar]
- Hebling J., Almási G., Kozma I. Z. & Kuhl J. Velocity matching by pulse front tilting for large-area THz-pulse generation. Opt. Express 10, 1161–1166 (2002). [DOI] [PubMed] [Google Scholar]
- Planken P. C. M., Nienhuys H. -K., Bakker H. J. & Wenckebach W. T. Measurement and calculation of the orientation dependence of terahertz pulse detection in ZnTe. J. Opt. Soc. Am. B 18, 313–317 (2001). [Google Scholar]
- Jewariya M., Nagai M. & Tanaka K. Ladder climbing on the anharmonic intermolecular potential in an amino acid microcrystal via an intense monocycle terahertz pulse. Phys. Rev. Lett. 105, 203003 (2010). [DOI] [PubMed] [Google Scholar]
- Sato K. & Adachi S. Optical properties of ZnTe. J. Appl. Phys. 73, 926–931 (1993). [Google Scholar]
- Wu Q. & Zhang X. –C. Ultrafast electro-optic field sensors. Appl. Phys. Lett. 68, 1604–1606 (1996). [Google Scholar]
- Schall M., Walther M. & Jepsen P.U. Fundamental and second-order phonon processes in CdTe and ZnTe. Phys. Rev. B 64, 094301 (2001). [Google Scholar]


