Abstract
Besides mutations in BRCA1/BRCA2, heterozygous defects in PALB2 are important in breast cancer predisposition. PALB2 heterozygosity increases the risk of malignancy about sixfold. PALB2 interacts with BRCA1 and BRCA2 to regulate homologous recombination and mediate DNA damage response. Here we show, by analysing lymphoblastoid cell lines from heterozygous female PALB2 mutation carriers, that PALB2 haploinsufficiency causes aberrant DNA replication/damage response. Mutation carrier cells show increased origin firing and shorter distance between consecutive replication forks. Carrier cell lines also show elevated ATR protein, but not phosphorylation levels, and a majority of them display aberrant Chk1-/Chk2-mediated DNA damage response. Elevated chromosome instability is observed in primary blood lymphocytes of PALB2 mutation carriers, indicating that the described mechanisms of genome destabilization operate also at the organism level. These findings provide a new mechanism for early stages of breast cancer development that may also apply to other heterozygous homologous recombination signalling pathway gene mutations in hereditary cancer predisposition.
 PALB2 is a BRCA1-/BRCA2-interacting protein and heterozygous mutations in PALB2 are associated with hereditary breast cancer predisposition. Here the authors show that human lymphoblastoid cells from heterozygous PALB2 mutation carriers display abnormal DNA replication dynamics and DNA damage response.
PALB2 was identified as a protein that binds to the N-terminus of BRCA2 and stabilizes its chromatin binding, thereby supporting homologous recombination (HR) and checkpoint response1. PALB2 also directly binds BRCA1 and mediates the interaction between BRCA1 and BRCA2 during HR, where BRCA1 acts as an upstream regulator of PALB2 and BRCA2 (ref. 2). The latter delivers RAD51 to the DNA lesions to initiate HR2,3.
Constitutional defects in the PALB2 gene have been associated with both cancer susceptibility and Fanconi anaemia (FA)4,5. Heterozygous mutations in PALB2 predispose predominantly to breast cancer (BC)6,7,8, increasing the malignancy risk between 3- and 19-fold, depending on the population studied6,7,8,9. Monoallelic defects in PALB2 have also to a lesser extent been connected to pancreatic cancer4. Biallelic mutations cause FA, and the resulting FA-N phenotype resembles that of FA-D1 caused by homozygous mutations in BRCA2 (refs 4, 5, 10).
Here we have used peripheral blood samples and lymphoblastoid cell lines (LCLs) established from healthy and diseased Finnish female heterozygous PALB2 c.1592delT mutation carriers as well as matched healthy control individuals in order to gain a better understanding of the molecular and biological mechanisms leading to hereditary predisposition to BC. We observed that the studied mutation carriers in average had about half the normal dosage of PALB2 protein. Our results provide firm evidence in support of abnormal DNA replication dynamics, increased protein levels of the ATR kinase as well as impaired DNA damage response. These novel observations ultimately provide a mechanistic framework for how the described germline defect connects to cancer development and hereditary predisposition to the disease. As the elevated chromosome instability is observed in primary peripheral blood lymphocytes of heterozygous PALB2 mutation carriers, the described mechanisms of genome destabilization appear to be operational also at the organism level. The described mutator phenotype may also serve as a paradigm for other heterozygous cancer predisposing mutations in PALB2 and other BC tumour suppressors.
Results
Reduced PALB2 levels in heterozygous PALB2 mutation carriers
In a previous study, we identified the c.1592delT mutation in PALB2, occurring in about 1% of Finnish BCs, and leading to a 40% risk for developing BC by the age of 70 years6,9. As is the case for c.1592delT, the vast majority of pathological mutations in PALB2 cause frame shifts and/or truncation of the protein product4,11,12,13.
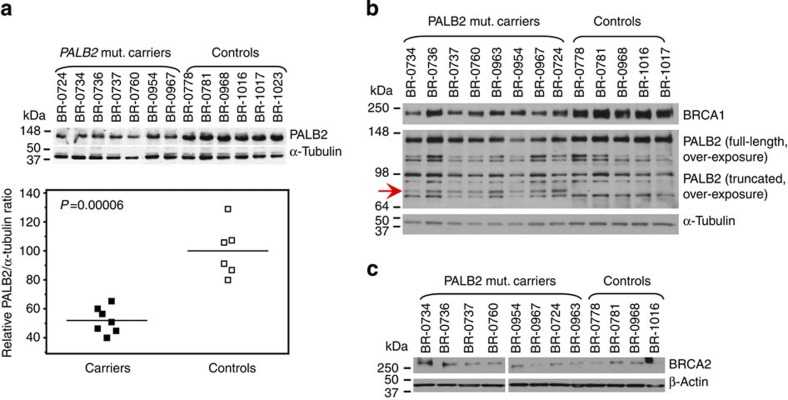
To determine the functional impact of c.1592delT in the heterozygous state, we established LCLs from eight female PALB2 mutation carriers as well as from six mutation-negative female siblings and ancestry-matched controls (Supplementary Table S1). The average PALB2 protein levels from seven PALB2 mutation carriers were 52% of that of normal cells (Fig. 1a) (two-tailed Student’s t-test; P=0.00006, with a mean of 52.1% (s.d.=8.9) for the carriers and 100% (s.d.=17.8) for the controls). After long exposure, we were able to detect a weak signal for the truncated PALB2 protein product of expected size1 in all mutation-carrying LCLs but in none of the control LCLs (Fig. 1b). On average, the truncated protein corresponds to only 10% (mean 10.3%, s.d.=4.3) of full-length PALB2 in the respective mutation carrier LCLs. Consistently, mRNA analysis demonstrated that the c.1592delT allele was able to escape nonsense mediated decay. Based on the strongly reduced levels of the truncated product, however, the protein appears to be highly unstable. We also analysed the levels of BRCA1 and BRCA2, the prominent interaction partners of PALB2. Although average BRCA1 protein levels seem to be reduced by 15% in the PALB2 mutation carrier LCLs (Fig. 1b, not statistically significant), BRCA2 protein levels were generally very low and variable (Fig. 1c), therefore prohibiting reliable quantification.
Figure 1. Heterozygous PALB2 mutation carriers display reduced PALB2 protein levels.
(a) Western blot showing PALB2 protein levels under normal growth conditions and without any toxic treatments (top), mutation carriers show only 52% of the normal full-length PALB2 protein level (bottom). Means are shown by lines. (b) Low levels of truncated PALB2 become visible in PALB2 mutation carriers after long exposure of western blots with an antibody directed towards the amino-terminus of the protein. BRCA1 expression is reduced to 85% in PALB2 mutation carriers. (c) BRCA2 expression is variable but low in all LCLs. Cell extract from the cell lines were collected at the same time during one cultivation period, verifying that all cell lines were cultivated equally. Quantitation of the PALB2 protein levels represent the average of two technical replicates.
PALB2 haploinsufficiency causes excessive origin firing
Initial cell cycle distribution and checkpoint analysis of a subset of six LCLs hinted that carrier cells incorporated larger amounts of the nucleotide analogue ethynyl-deoxyuridine (EdU) during pulse labelling, and at the same time had a smaller fraction of S-phase cells in the absence of DNA damage (Supplementary Fig. S1). Thus, the studied mutation carrier cell lines appeared to replicate their DNA faster than the control cell lines. Therefore, the specific effects of the heterozygous PALB2 mutation on replication origin firing and elongation was studied in all available carrier LCLs by utilizing the DNA fibre assay technique14.
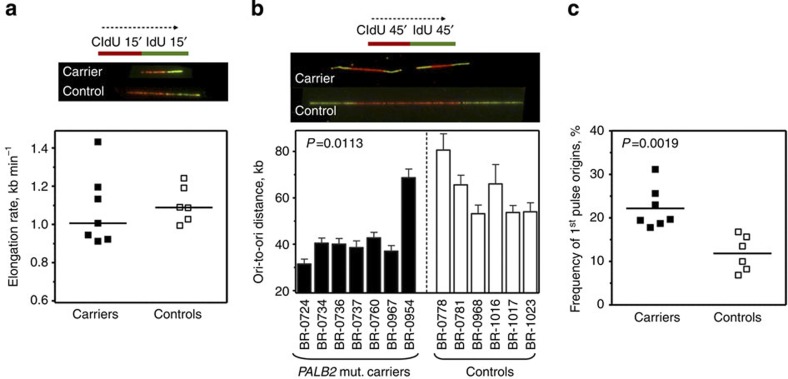
Quantitative analysis indicated a moderate, albeit not statistically significant decrease in replication elongation rates in the mutation carrier cells (Fig. 2a; median 1.02 kb min−1 for carriers and 1.11 kb min−1 for controls). However, we noticed closely spaced origins in the PALB2 mutation carrier cells that were largely absent in the control lines (Fig. 2b. In fact, the mean inter-origin distance is strongly reduced in the mutation carriers [43 kb (s.d.=11.4), compared to 62 kb (s.d.=10.8) in controls; P=0.0113, two-tailed Student’s t-test]. Also the mean frequency of origin firing is nearly doubled, 21.7% (s.d.=4.7), compared with 11.8% (s.d.=4.1) in controls (P=0.0019, two-tailed Student’s t-test) (Fig. 2c). Therefore, heterozygosity for PALB2 c.1592delT causes a haploinsufficiency phenotype in our LCLs, manifested by an excessive origin firing. Although apparently highly unstable, it cannot be excluded that the truncated protein product of the c.1592delT allele confers a dominant-negative effect and thereby contributes to some degree to this phenotype. This is reminiscent of recent observations that homozygous inactivation of FANCM leads to an increase of origin firing without affecting elongation rates15. In contrast, in Chinese hamster ovary cells deficient for BRCA2, XRCC2 or RAD51 activity16, the loss of HR severely reduced replication fork velocity accompanied by an increased origin firing. Activation of neighbouring, dormant origins has also been reported after hydroxyurea (HU)-induced replication fork arrest17, and this checkpoint response is mediated by ATR and its downstream kinase Chk118,19. The prominent role of ATR/Chk1 at low levels of replication stress appears to be the restriction of distant origin firing. At the same time dormant origins within the same replication domain will be activated20. Even in the absence of DNA damage, ATR and Chk1 regulate replication timing and normal S-phase progression, as Chk1 inhibition, downregulation as well as inactivation of the CHK1 gene all cause slow-down of fork progression and extensive origin firing21,22,23,24.
Figure 2. Heterozygous PALB2 mutation carriers display an increased firing of dormant replication origins.
(a) Elongation rates of untreated carriers and controls are comparable. Lines in the dot plot represent medians. (b) Quantification of ori-to-ori distances. Error bars represent s.e.m. for each cell line. (c) The frequency of 1st pulse origins of untreated carriers and controls. Lines in the dot plot represent means. Labelling protocols and representative examples of DNA fibres are shown on top of subpanels a,b. In every case, data of three independent experiments were pooled. All P-values were calculated by two-tailed Student’s t-test.
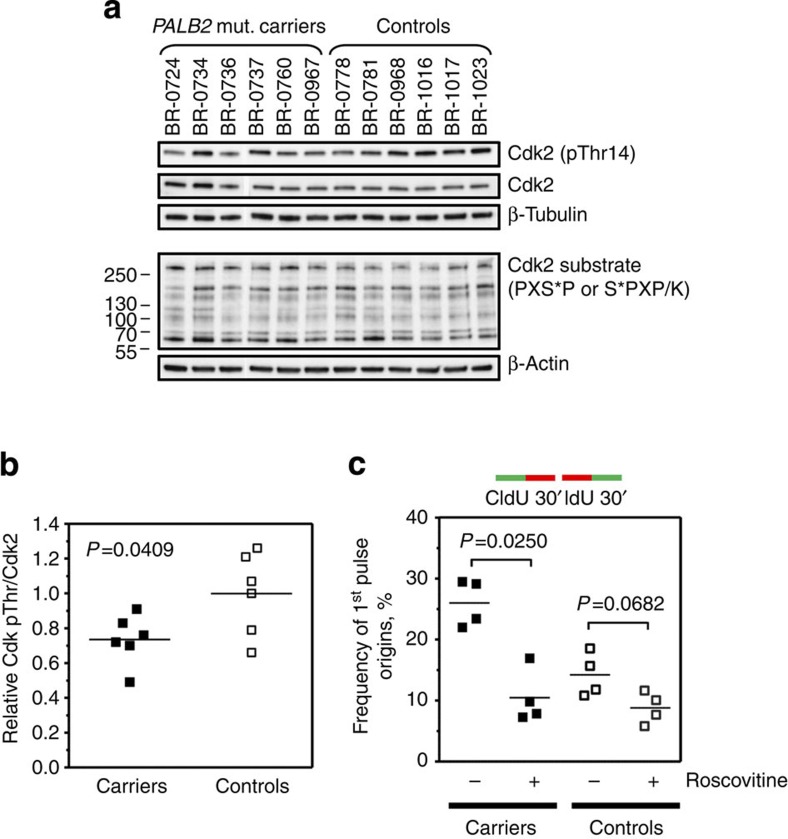
In order to achieve more insight into the mechanisms leading to the increased origin firing in PALB2 mutation carriers, we studied the control of cyclin-dependent kinase (Cdk) activity in our cohorts, as S-phase Cdk activity constitutes a critical regulator of replication firing25,26. Indeed, we found that the inhibitory phosphorylation of Cdk at threonine 14 is significantly reduced (by 27%, s.d.=14) in PALB2 carriers compared with the control cohort (P=0.0409, two-tailed Student’s t-test) (Fig. 3a,b). We also analysed levels of phosphorylation of Cdk substrates using an antibody recognizing the consensus phosphorylation motif (PXS*P or S*PXR/K)26. Although the overall phosphorylation levels were not increased, the phosphorylation patterns appeared altered in PALB2 carriers (Fig. 3a, lower panel). As the changes in Cdk phosphorylation and Cdk substrate phosphorylation may also affect phosphorylation of Cdks outside S-phase, we looked specifically into the Cdk-dependence of origin firing in our cohorts. In the presence of the Cdk inhibitor roscovitine, the frequency of 1st pulse origins dropped dramatically in four representative carrier LCLs, on average from 26.0% (s.d.=3.8) to 10.5% (s.d.=4.4; P=0.0250, two-tailed Student's t-test) (Fig. 3c). As already shown in Fig. 2, frequency of 1st pulse origins in four untreated control LCLs was significantly lower (14.2%, s.d.=3.6) than in carriers (P=0.0041, two-tailed Student’s t-test). After addition of roscovitine, origin firing in the controls was reduced to a level comparable to those of the carriers (8.8%, s.d.=2.6) (Fig. 3c). Taken together, the increased origin activation of unperturbed carriers appears to depend on an increased Cdk activity in S-phase.
Figure 3. Heterozygous PALB2 mutation carriers display altered Cdk activity.
(a) WB analysis of protein levels inhibitory Cdk phosphorylation at threonine 14, total Cdk2 (both 35 kDa) and phosphorylation of Cdk/MAP kinase substrates. Protein levels were normalized against β-tubulin (50 kDa) or β-actin (42 kDa). (b) Inhibitory phosphorylation of Cdks at threonine is significantly reduced in PALB2 mutation carriers. (c) the excessive origin firing in PALB2 mutation carriers in suppressed in the presence of the Cdk inhibitor roscovitine. Data points in panels b,c are averages of two independent experiments each. Lines in the dot plots represent means. All P-values were calculated by two-tailed Student’s t-test.
PALB2 affects ATR levels and DNA replication stress response
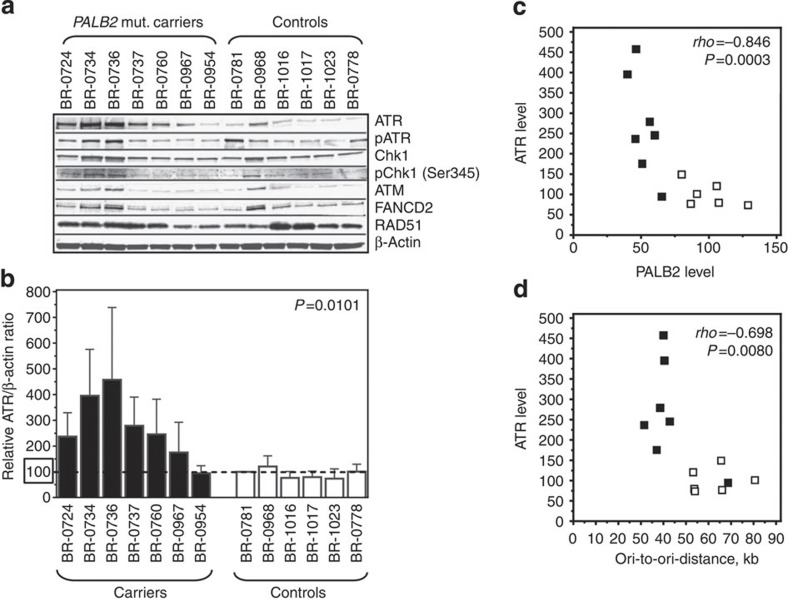
Considering the prominent role of the ATR/Chk1 pathway in the regulation of origin firing, we studied the expression of key factors involved in the DNA damage repair (DDR) and FA pathways. Whereas the levels of ATM, FANCD2 and RAD51 protein were unaffected in undisturbed heterozygous PALB2 c.1592delT cells, the mean ATR levels observed in the mutation carrier cohort were increased by almost threefold (Fig. 4a,b) [median 276%, mean 275% (s.d.=123), compared with the controls median 90%, mean 100% (s.d.=30); P=0.0101, Mann–Whitney test]. It has previously been reported that downregulation of ATR is not tolerated in cells that experience oncogene-induced replication stress27,28. Therefore, the increase in ATR protein levels could represent a mechanism to compensate for the defects caused by PALB2 haploinsufficiency. This is supported by a strong inverse correlation of ATR levels with the PALB2 dosage (Fig. 4c), and in turn, also a strong inverse correlation of ATR with inter-origin distance: the less PALB2 a LCL contains, the higher the ATR level, and the higher the ATR level, the shorter ori-to-ori distance (Fig. 4d). However, even with the increased ATR levels in the carriers, we were not able to detect any differences in the Chk1 protein levels nor in the level of spontaneous Chk1 serine 345 phosphorylation (Fig. 4a), a prominent target of ATR during DDR18,19. This is not surprising, as ATR phosphorylation of serine 428 was comparable in both cohorts (Fig. 4a, Supplementary Fig. S2a). This means, that despite the increased levels of total ATR in carriers, the fraction of ATR activated by phosphorylation at Serine 428 appears rather reduced in the carriers compared with the controls (Supplementary Fig. S2b). However, this difference was not statistically significant.
Figure 4. Heterozygous PALB2 mutation carrier cells show changes in ATR expression.
(a) ATR expression is increased in untreated carrier cells. Western blot analysis of ATM (350 kDa), ATR/pATR (301 kDa), FANCD2 (165 kDa), Chk1/pChk1 (56 kDa) and RAD51 (37 kDa) expression in untreated mutation carrier and control cells. (b) Expression profile of ATR signals normalized against β-actin (42 kDa), which served as loading control. Error bars represent s.d. of the average per cell line. ATR levels correlate inversely with (c), the PALB2 protein levels and (d), inter-origin distance across both cohorts. Individual PALB2 mutation carriers are indicated by filled, controls by open squares. The Spearman’s rank correlation coefficient ρ and the corresponding P-value are indicated. Cell extract from the cell lines were collected at the same time during one cultivation period, verifying that all cell lines were cultivated equally. Quantitations of the protein levels represent the average of two to three technical replicates.
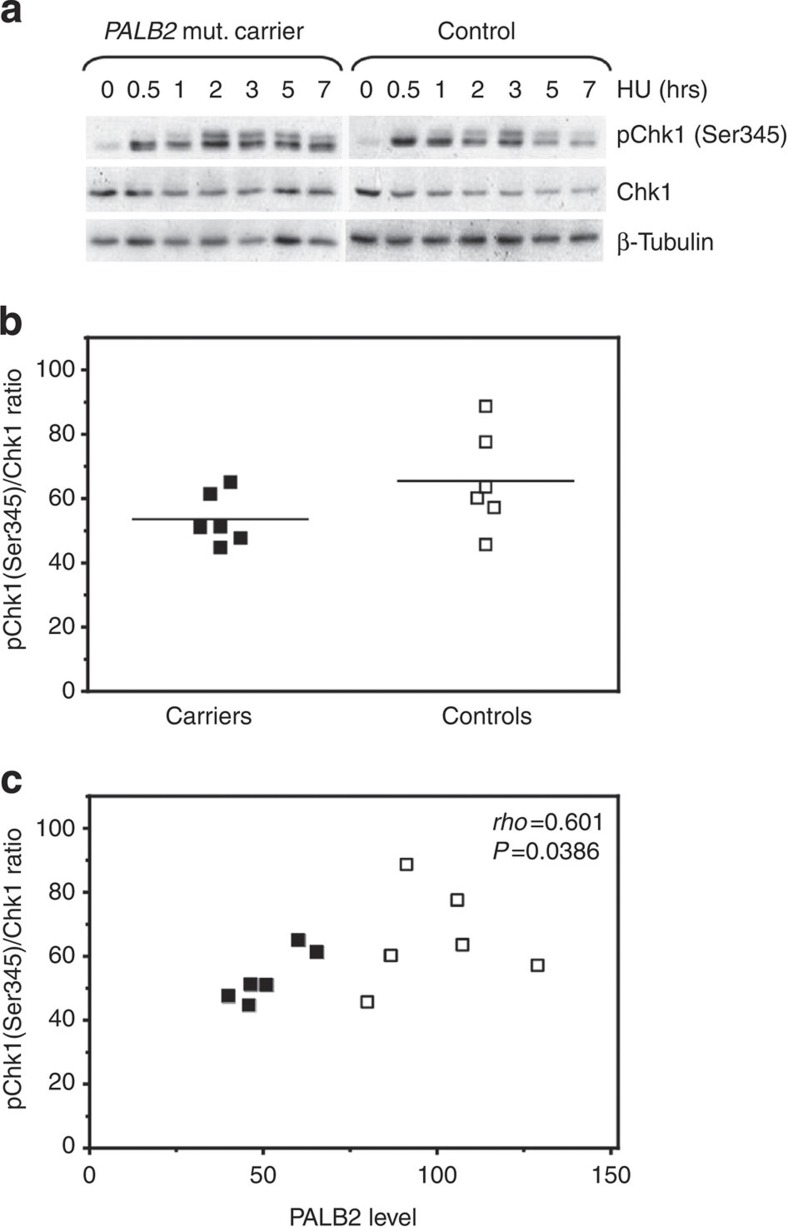
We then further explored the S-phase DDR in our cohorts and triggered DNA replication stress by HU-induced deoxynucleotide depletion. In the presence of 2 mM HU, the cells from both studied cohorts showed a clear intra-S-phase checkpoint response as Chk1 becomes phosphorylated on serine 345 (Fig. 5a, Supplementary Fig. S3)18,19. However, whereas the control cohort showed a rapid phosphorylation of Chk1 30 min after HU treatment, 67% (4/6) of the carrier lines displayed a delay in the response. Thus, at the same time point, carrier LCLs reach on average only 52% (s.d.=10.4) of the maximum Chk1 phosphorylation, compared with 66% (s.d.=15.0) in the controls (P=0.1005, two-tailed Student’s t-test) (Fig. 5b). Although the difference between the two cohorts has weak statistical support, we see a significant direct positive correlation between PALB2 levels and the relative Chk1 phosphorylation (Fig. 5c) [Spearman’s correlation coefficient ρ=0.601, P=0.0386 (two-sided)], indicating that the impaired Chk1 phosphorylation is indeed linked directly or indirectly to the lower PALB2 dosage in the mutation carrier LCLs. When we studied the recovery from HU block exemplary for a slowly responding carrier and a control cell line, the carrier displayed a reduction in 1st order origins, which is indicative of a decrease or delay in replication fork restart and/or dormant origin firing (Supplementary Fig. S4a,b), as well as a decrease in origin firing after release from HU (Supplementary Fig. S4a,c). Thus, the high level of origin firing in unperturbed mutation carrier cells (Fig. 2b) is reflected by a disturbance in the recovery from DNA replication stress of at least some of the carrier cell lines. Apparently, heterozygous PALB2 mutation carriers during normal cell growth exhaust part of their capacity to recover from replication stress. Considering the prominent role of PALB2 protein in the regulation of RAD51 activity, one can conceive that PALB2 mutation carrier cells may have reduced ability to resort to BRCA2- and RAD51-dependent protection and restart of stalled replication forks and therefore to a much greater extent rely on the activation of dormant origins24.
Figure 5. Heterozygous PALB2 mutation carrier cells show changes in the S-phase DNA damage response.
(a) Representative time courses of the Chk1 phosphorylation 0–7 h after HU addition. The predicted size for Chk1/pChk1 is 56 kDa, and levels were normalized against β-tubulin (50 kDa). (b) Chk1 phosphorylation at Ser345 is delayed in 66% of the carrier cell lines after HU treatment. The plot presents pChk1(Ser345)/Chk1 ratios 30 min after HU-induced replication stress. The mean is shown by lines. (c) Chk1 phosphorylation correlates with the PALB2 protein levels, The pChk1(Ser345)/Chk1 ratios 30 min after HU-induced replication stress are plotted against the PALB2 levels. Individual PALB2 mutation carriers are indicated by filled, controls by open squares. The Spearman’s rank correlation coefficient ρ and the corresponding P-value are indicated. Western blot samples from studied cell lines were collected at the same time during two separate cultivation periods, verifying that all cell lines were cultivated the same amount. Samples from each collection were analysed at least twice by western blot. Quantitations of the protein levels represent the average of the two biological replicates.
PALB2 and maintenance of checkpoint response
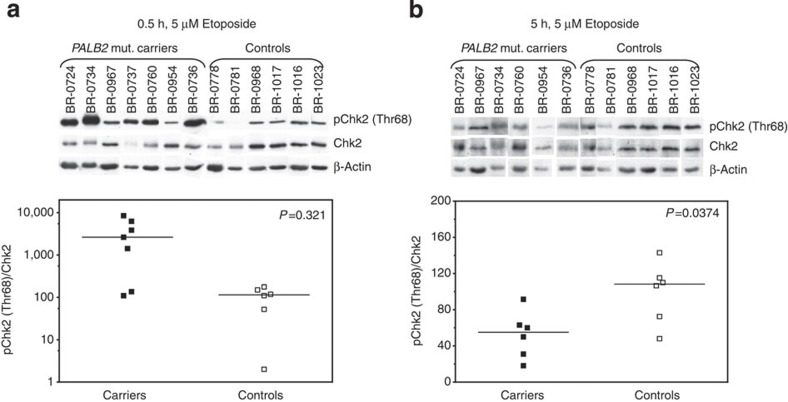
Recent work of other investigators indicates that the BRCA pathway, encompassing also PALB2, is involved in the G2 checkpoint response29. Therefore, the DNA damage checkpoint response of the LCLs was assessed in the presence of 0.5 μM of the topoisomerase II inhibitor etoposide (ET)30 (Supplementary Fig. S5, Supplementary Table S2). G2/M cell cycle checkpoint activation was already apparent 6 hours after addition of ET, and both G1/S and G2/M checkpoints were enforced in cells treated 24 h with ET. This was seen by the decrease of the S/G1 and M/G2 ratios, respectively (Supplementary Fig. S5b, Supplementary Table S2). After 24 h, nearly all control cells were arrested in G2-phase, indicating an efficient G2/M checkpoint. In 57% (4/7) of the mutation carriers, however, a larger M/G2-phase ratio hinted a G2/M checkpoint leakage (Supplementary Fig. S5b, Supplementary Table S2). As the differential cell cycle analysis did not provide statistically support for a checkpoint defect, we studied the G2/M checkpoint function further by analysing Chk2 phosphorylation after ET-treatment both in carrier and control cell lines. Phosphorylation at threonine 68 was monitored as this is the most prominent Chk2 site phosphorylated by ATM in the response to DSBs31. We found aberrant Chk2 phosphorylation in at least 71% (5/7) of our carrier cell lines (Fig. 6, Supplementary Fig. S6a). When challenged with 5 μM ET, 30 min after treatment the cells already displayed excessive Thr68 phosphorylation of Chk2 (median 2637 for carriers and 114.5 for controls, see ranges from Fig. 6a, P=0.0321, Mann–Whitney test). On the other hand, control cells sustained high Thr68 phosphorylation after 5 h in the presence of ET (median 55.0 for carriers and 108.3 for controls, see ranges from Fig. 6b, P=0.0374, Mann–Whitney test), whereas the phosphorylation had been lost already in the carrier cells. During fibre assay analysis, the mutation carrier cells showed a strong reduction in origin firing within the first 30 min of ET-treatment but an increase in firing immediately after removal of ET (Supplementary Fig. S6b,c). This implies that the G2/M checkpoint defect observed in heterozygous PALB2 mutation carriers is likely a maintenance problem—the cells (over-)respond to DNA damage but cannot sustain the G2/M checkpoint, and consequently will enter into mitosis prematurely.
Figure 6. Effect of duration of ET-treatment on Chk2 phosphorylation.
Western blot analysis of Chk2 Thr68 phosphorylation (top) and pChk2(Thr68)/Chk2 ratios (bottom) (a), 30 min and (b), 5 h after ET addition. Medians of the cohorts are shown by lines. PALB2 mutation carrier and control cell lines were applied in random order on all gels. For reasons of clarity, the data are presented according to PALB2 mutation status. The predicted size for Chk2/pChk2 is 62 kDa, and levels were normalized against β-actin (42 kDa). Western blot samples from studied cell lines were collected at the same time during two separate cultivation period, verifying that all cell lines were cultivated the same amount. Samples from each collection were analysed at least twice by western blot. Quantitations of the protein levels represent the average of the two biological replicates. All P-values were calculated by Mann–Whitney test.
Genomic instability in primary lymphocytes of PALB2 carriers
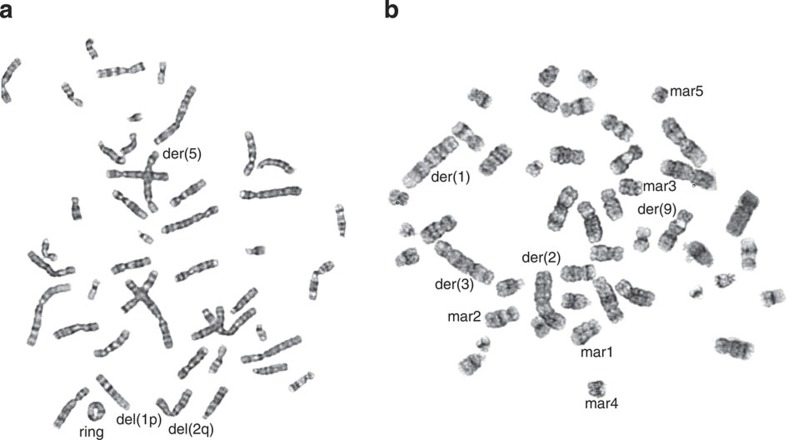
As the LCLs utilized in the functional analysis are transformed by Epstein–Barr virus, the abnormalities observed in regulation of DNA replication and cell cycle checkpoint response in our mutation carriers could be dependent on transformation with virus-derived oncogenes32. Therefore, it was important to investigate whether the heterozygous PALB2 mutation leads to genomic instability also in primary, untransformed cells. To this end, regular cytogenetic analysis of peripheral blood T-lymphocytes from six PALB2 mutation carriers was performed. The carriers showed a significant increase in the total number of spontaneous chromosomal rearrangements (Table 1, P=0.018; Mann–Whitney U-test); both simple and complex rearrangements were found more frequently in carriers than in healthy controls (P=0.036 and P=0.036, respectively; Mann–Whitney U-test). In contrast, there was no difference in the occurrence of chromosome/chromatid breaks and deletions between mutation carriers (mean 1.65/100, s.e.=1.07 metaphases) and controls (mean 1.67/100, s.e.=0.49 metaphases). Telomeric associations were rare and seen only in PALB2 mutation carriers. All observed chromosomal aberrations were considered random, as no preference for specific break sites or evidence for clonality was observed. The prevalence of simple and complex chromosomal rearrangements is likely explained by one-sided DSBs and consistent with the increased genome instability caused by defective DNA replication and/or DNA damage response33. Therefore, the significantly increased chromosomal instability observed in primary lymphocytes provide strong evidence that the mechanisms causing increased genome instability are similar to those unravelled in the heterozygous LCLs, and thus, in fact, are operational also in primary tissues of the PALB2 mutation carriers. Examples of typical chromosomal defects seen in metaphases of two different carrier individuals are shown in Fig. 7.
Table 1. Summary of chromosomal aberrations observed in blood lymphocyte metaphases of PALB2 c.1592delT mutation carriers and healthy controls.
| Type of aberration |
Mean of chromosomal aberrations observed per 100 metaphases |
P-value* | |
|---|---|---|---|
| Carriers (n=6) | Controls (n=9) | ||
| Telomeric associations | 0.65 (SE=0.41) | — | 0.328 |
| Chromatid/chromosome breaks, deletions | 1.65 (SE=1.07) | 1.67 (SE=0.49) | 0.689 |
| Simple chromosomal rearrangements† | 5.92 (SE=2.19) | 0.67 (SE=0.33) | 0.036‡ |
| Complex chromosomal rearrangements§ | 2.92 (SE=1.76) | — | 0.036‡ |
| Total rearrangements (simple+complex) | 8.83 (SE=3.75) | 0.67 (SE=0.33) | 0.018‡ |
*Mann–Whitney U-test.
†Inversions, ring chromosomes, translocations (≤3 break rearrangements).
‡Statistically significant P-value (<0.05).
§Translocations (≥4 break rearrangements) and marker chromosomes.
Figure 7. Examples of typical chromosomal aberrations seen in peripherial blood lymphocytes of heterozygous PALB2 c.1592delT mutation carriers.
The metaphases shown in images (a) and (b) are derived from two different carrier individuals and demonstrate chromosomal deletions [del (1p), del(2q)] and chromosomal rearrangements [ring, der(1), der(2), der(3), der(5), der(9), mar1, mar2, mar3, mar4, mar5]. Ring, ring chromosome; Der, derivative chromosome; Mar, marker chromosome.
Discussion
The phenotype characterized here for heterozygous PALB2 mutation carrier individuals is due to a naturally occurring genetic variant presenting a defect in an essential component of the DNA damage response apparatus. Not only does this germline alteration disrupt the government of cellular responses after DNA replication stress, but it also appears to have an immediate role in the generation of DNA replication stress that is considered a driving force for the early stages of tumour development34,35. Furthermore, as the presented haploinsufficiency at the PALB2 locus, possibly complemented by a dominant-negative influence of the highly unstable c.1592delT truncation allele protein product, apparently already on its own is sufficient for gradually driving affected cells towards malignant transformation. Therefore, loss of tumour suppressor/caretaker gene heterozygosity might not always need to be a prerequisite for such development. Thus, the described mutator phenotype may also serve as a paradigm for other heterozygous cancer predisposing mutations.
Notably, Konishi et al.36 showed after somatic cell gene targeting in another BC susceptibility gene, BRCA1, that an heterozygous mutation (185delAG) confers impaired homology-mediated DNA repair and hypersensitivity to genotoxic stress, as well as genomic instability in nontumourigenic epithelial cells. To our best knowledge, this is still the first study using unmanipulated patient material to directly demonstrate major biological defects connected with cancer development as already being due to a constitutional heterozygous defect in a gene involved in hereditary predisposition to cancer.
Methods
Study subjects
Altogether, eight female individuals carrying the PALB2 c.1592delT founder mutation were analysed in this study. Of these, six individuals had been diagnosed with BC and two were still disease-free persons of two different BC families6. The samples of the BC patients were collected at least 3 years after the initial cancer diagnosis. Six healthy non-carrier female individuals were used as controls and of these three were healthy family members from two of our patients’ families and three were independent controls. In addition, six control samples derived from a previous study of ours37 were here used exclusively for the analysis of potential chromosomal defects. All controls originated from the same geographical region as the carriers, were age-matched and cancer-free at the time of donation. There was no follow-up on the health status of the controls. Studied cell lines are presented in Supplementary Table S1. Informed consent to participate in the study has been obtained from each individual, and the studies have been approved by the Finnish Ministry of Social Affairs and Health and the Ethical Board of the Northern Ostrobothnia Health Care District.
Cell culture
Eight carrier and six control individuals’ lymphocytes were derived from their peripheral blood samples. LCLs were immortalized with Epstein–Barr virus (EBV) and cultured in RPMI 1640 medium (Gibco, Invitrogen) supplemented with 20% fetal bovine serum (Gibco, Invitrogen), 1% L-glutamine (Gibco, Invitrogen) and 10 μg ml−1 gentamycin (Gensumycin, Sanovi aventis) at 37 °C in a 5% CO2 atmosphere.
mRNA analysis
To determine the functional impact of PALB2 c.1592delT in the heterozygous state, LCLs from eight female mutation carriers and six controls (Supplementary Table S1) were cultivated. RNA was then isolated using the QIAamp RNA Blood Mini Kit (Qiagen) and was reverse transcribed with iScript cDNA Synthesis Kit (Bio-Rad) according to the manufacturer’s instructions. The expression of both the PALB2 WT and mutation allele was then studied at the mRNA level by cDNA sequencing.
Western blot analysis
Untreated cell lines or cell lines treated with 5 μM ET (Etopofos, Bristol–Myer Squibb) and 2 mM HU (Sigma-Aldrich) and incubated for 7 h, samples were collected at different time points (0–7 h). Cells were centrifuged and washed twice with PBS and the pellet was suspended with 2.5 × Laemmli buffer, cell membranes were broken by sonication. The protein concentration was measured by the RC DC protein assay kit (Bio-Rad) and 25 μg of proteins were separated with SDS–PAGE, after which the gels were stained with SYPRO Orange (Molecular Probes, Invitrogen) to verify equal loading and electro blotted onto PVDF membranes. Alternative to SPYRO Orange staining, the membranes were stained with Ponceau S (Chroma-Gesellschaft, Schmid & Co). The antibodies used are listed in Supplementary Table S3. Horseradish peroxidase- and alkaline phosphatase-conjugated antibodies (Jackson Immunoresearch) and IRDYE 680, IRDYE 800 CW (LI-COR Bioscience) were used as secondary antibodies. For quantification, the protein levels of interest were analysed after densitometrical scan of the exposures, which was done by Image Quant 5.2 software (Amersham Lifesciences) or by using Odyssey Infrared Imaging System. All analyses were performed in duplicate or triplicate. For protein level measurements cells were lysed in NETN-300 buffer (20 mM Tris base (pH 7.5), 300 mM NaCl, 1 mM EDTA, 0.5% NP-40, 1 × complete mini EDTA protease inhibitor (Roche Diagnostics)) and protein concentrations were measured by Bradford-assay. Ten microgram of proteins were separated with SDS–PAGE and blotted onto NC membranes. The primary PALB2 antibody was a rabbit polyclonal antibody raised against amino acids 1–200 mapping in the N-terminus of PALB2 of human origin and horseradish peroxidase-conjugated antibody (Jackson Immunoresearch) were used as secondary antibody. The protein levels were scanned and analysed as mentioned above. Please see Supplementary Fig. S7 for the original full scans of the western blots displayed in Figs 1, 3, 4, 5, 6.
Cytogenetic analysis
The assessment of six PALB2 c.1592delT carriers and nine controls was carried out on metaphases obtained from regular short-term 3-day cultures of peripherial blood T-lymphocytes38. Of the studied mutation carriers, two were phenotypically healthy individuals. The blood samples of the studied BC patients were collected at least 3 years after the initial cancer diagnosis. A minimum of 50 Giemsa-banded metaphases per sample were evaluated for chromosomal abnormalities by light microscopy, and were photographed with an automatic chromosome analyser (CytoVision version 7.2, Applied Imaging). Samples were monitored for telomeric associations, chromatid/chromosome breaks and deletions, simple chromosomal rearrangements (inversions, ring chromosomes and translocations of ≤3 break rearrangements) and complex chromosomal rearrangements (translocations of ≥4 break rearrangements and marker chromosomes)37.
Flow cytometric analysis
Following either 0.5 μM ET-treatment or 2 Gy IR, LCLs were cultured for a further 24 h and samples were collected at different time points (0, 6 and 24 h). Cells were stained for DNA synthesis and cell cycle distribution using the Click-iT EdU-Alexa Fluor 647 or 488 Flow Cytometer Assay kit (Molecular Probes, Life Technologies), according to manufacturer’s protocol. In addition, the cells were stained with anti-phospho-histone H3 (Ser10) antibody that specifically recognizes M-phase cells. Fluorescence labelling was done with an Alexa Fluor 546 conjugated antibody. The nucleotide analogue 5-ethynyl-2′-deoxyuridine (EdU) was conjugated with Alexa Fluor 647 or 488 azide and DNA content was measured by addition of Cell Cycle 405-blue/cell cycle 488-red or 4′,6-diamidino-2-phenylindole, dihydrochloride (DAPI, Molecular Probes, Invitrogen) DNA dye. Antibodies used are listed in Supplementary Table S3. Measurements took place on a flow cytometer (FACS Canto, BD Biosciences; FACS Aria II, BD Biosciences and CyFlow, Partec GmbH) equipped with a 488-nm blue laser, a 633-nm red laser and a 405-nm violet laser or a 375-nm ultraviolet laser. The LCL population was gated in a FSC/SSC dot plot and doublets were gated out based on a DNA dye area/width dot plot. This cell population was further analysed regarding its cell cycle distribution. G1-, S- and G2/M-phase cell populations were defined in a DNA dye/EdU-Alexa Fluor 647 dot plot and G2/M-phase cells were further separated in a DNA dye/Alexa Fluor 546 dot plot. For quantification Partec FloMAX and BD FACSDiva softwares were used.
DNA fibre spreads
Exponential growing cells were pulse labelled with 25 μM CldU (Sigma) followed by 250 μM IdU (Sigma) for the indicated times. For fibre analysis, after damage induction CldU and IdU media was given for indicated time periods and 2 mM HU or 10 μM ET were performed during the last 30 min of the CldU pulse. For analysis of Cdk-dependence of origin firing, roscovitine (Sigma) was added to give a final concentration of 50 or 100 μM 1 h before the addition of CldU. Labelled cells were harvested and DNA fibre spreads prepared on microscope glass slides by addition of 200 mM Tris-HCl pH 7.4, 50 mM EDTA, 0.5% SDS39. Acid-treated fibre spreads were stained with monoclonal rat anti-BrdU (AbD Serotec, 1:1,000) followed by monoclonal mouse anti-BrdU (Becton Dickinson, 1:1,500). Secondary antibodies were goat anti-rat Alexa Fluor 555 and goat anti-mouse Alexa Fluor 488 (both Molecular Probes, 1:500). Fibres were examined using fluorescence microscope Axioplan 2 (Zeiss, Germany). CldU and IdU tracks were measured using ImageJ and micrometre values were converted into kilobases40. At least 200 replication forks were analysed. Different classes of tracks were classified; red-green (ongoing replication), red (stalled or terminated forks), green (2nd pulse origin) and red-green-green-red (1st pulse origin). Frequencies were calculated using ImageJ software.
Statistical analysis
Independent samples Student’s t-test for normally distributed variables and Mann–Whitney U-test for non-normally distributed variables was used to determine the statistical difference in ATR and PALB2 expression, origin firing, Chk1 and Chk2 phosphorylation and in the number of different chromosomal aberrations between the two groups categorized according to their PALB2 c.1592delT mutation status. Correlation between data sets was evaluated using Spearman’s rank coefficient. Comparisons were done with IBM SPSS Statistics software (version 20.0, IBM Corp) and all P-values were two-sided. Dot plots were used to illustrate the distribution of the responses.
Author contributions
R.W. and H.P. conceived, designed and oversaw the study with helpful input from B.X., K.P., K.B. and P.N. J.N. was responsible for the collection of PALB2 mutation carrier and control blood samples as well as for the establishment and subsequent culturing of the resultant lymphoblastoid cell lines used in this study. J.N. also carried out flow cytometry analyses. J.N., A.P., Y.H. and M.B. performed the western blot analyses. A.P. carried out DNA fibre assay studies. Statistical analyses were done by J.N. together with A.P. and K.P., under the guidance and supervision of P.N. K.P. together with K.R. were responsible for the cytogenetic analysis of peripheral blood samples. J.N. drafted the manuscript. H.P. and R.W. prepared the final manuscript, and all authors contributed to critical review of the paper.
Additional information
How to cite this article: Nikkilä, J. et al. Heterozygous mutations in PALB2 cause DNA replication and damage response defects. Nat. Commun. 4:2578 doi: 10.1038/ncomms3578 (2013).
Supplementary Material
Supplementary Figures S1-S7 and Supplementary Tables S1-S3
Acknowledgments
We thank K. Mononen, H. Konola. M. Otsukka, K. Dreffke, E. Fritz, V. Glumoff, A. Zielinski and Laboratory of Clinical Genetics at the Oulu University Hospital for help in sample and data collection, flow cytometry setup as well as for technical assistance. We also thank all patients and their family members for volunteering to participate in this study. This study was supported by the Academy of Finland (Grant number 122715 and Center of Excellence Grant number 251314), the Finnish Cancer Foundation, the Cancer Fund of Northern Finland, the University of Oulu, the University of Oulu Support Foundation, the Oulu University Hospital, the Orion-Farmos Research Foundation, the Ida Montini Foundation and UFA Grant 3610S30016 by the German Federal Office for Radiation Protection. We thank L. Wiesmüller for critical reading of the manuscript.
References
- Xia B. et al. Control of BRCA2 cellular and clinical functions by a nuclear partner, PALB2. Mol. Cell 22, 719–729 (2006). [DOI] [PubMed] [Google Scholar]
- Zhang F. et al. PALB2 links BRCA1 and BRCA2 in the DNA-damage response. Curr. Biol. 19, 524–529 (2009). [DOI] [PMC free article] [PubMed] [Google Scholar]
- Dray E. et al. Enhancement of RAD51 recombinase activity by the tumor suppressor PALB2. Nat. Struct. Mol. Biol. 17, 1255–1259 (2010). [DOI] [PMC free article] [PubMed] [Google Scholar]
- Tischkowitz M. & Xia B. PALB2/FANCN—recombining cancer and Fanconi anemia. Cancer Res. 70, 7353–7359 (2010). [DOI] [PMC free article] [PubMed] [Google Scholar]
- Xia B. et al. Fanconi anemia is associated with a defect in the BRCA2 partner PALB2. Nat. Genet. 39, 159–161 (2007). [DOI] [PubMed] [Google Scholar]
- Erkko H. et al. A recurrent mutation in PALB2 in Finnish cancer families. Nature 446, 316–319 (2007). [DOI] [PubMed] [Google Scholar]
- Rahman N. et al. PALB2, which encodes a BRCA2-interacting protein, is a breast cancer susceptibility gene. Nat. Genet. 39, 165–167 (2007). [DOI] [PMC free article] [PubMed] [Google Scholar]
- Southey M. C. et al. A PALB2 mutation associated with high risk of breast cancer. Breast Cancer Res. 12, R109 (2010). [DOI] [PMC free article] [PubMed] [Google Scholar]
- Erkko H. et al. Penetrance analysis of the PALB2 c.1592delT founder mutation. Clin. Cancer Res. 14, 4667–4671 (2008). [DOI] [PubMed] [Google Scholar]
- Reid S. et al. Biallelic mutations in PALB2 cause Fanconi anemia subtype FA-N and predispose to childhood cancer. Nat. Genet. 39, 162–164 (2007). [DOI] [PubMed] [Google Scholar]
- Hellebrand H. et al. Germline mutations in the PALB2 gene are population specific and occur with low frequencies in familial breast cancer. Hum. Mutat. 32, E2176–E2188 (2011). [DOI] [PubMed] [Google Scholar]
- Casadei S. et al. Contribution of inherited mutations in the BRCA2-interacting protein PALB2 to familial breast cancer. Cancer Res. 71, 2222–2229 (2011). [DOI] [PMC free article] [PubMed] [Google Scholar]
- Tischkowitz M. et al. Rare germline mutations in PALB2 and breast cancer risk: a population-based study. Hum. Mutat. 33, 674–680 (2012). [DOI] [PMC free article] [PubMed] [Google Scholar]
- Bryant H. E. et al. PARP is activated at stalled forks to mediate Mre11-dependent replication restart and recombination. EMBO J. 28, 2601–2615 (2009). [DOI] [PMC free article] [PubMed] [Google Scholar]
- Schwab R. A. et al. ATR activation and replication fork restart are defective in FANCM-deficient cells. EMBO J. 29, 806–818 (2010). [DOI] [PMC free article] [PubMed] [Google Scholar]
- Daboussi F. et al. A homologous recombination defect affects replication-fork progression in mammalian cells. J. Cell Sci. 121, 162–166 (2008). [DOI] [PubMed] [Google Scholar]
- Karnani N. & Dutta A. The effect of the intra-S-phase checkpoint on origins of replication in human cells. Genes Dev. 25, 621–633 (2011). [DOI] [PMC free article] [PubMed] [Google Scholar]
- Liu Q. et al. Chk1 is an essential kinase that is regulated by Atr and required for the G(2)/M DNA damage checkpoint. Genes Dev. 14, 1448–1459 (2000). [PMC free article] [PubMed] [Google Scholar]
- Zhao H. & Piwnica-Worms H. ATR-mediated checkpoint pathways regulate phosphorylation and activation of human Chk1. Mol. Cell Biol. 21, 4129–4139 (2001). [DOI] [PMC free article] [PubMed] [Google Scholar]
- Ge X. Q. & Blow J. J. Chk1 inhibits replication factory activation but allows dormant origin firing in existing factories. J. Cell Biol. 191, 1285–1297 (2010). [DOI] [PMC free article] [PubMed] [Google Scholar]
- Syljuasen R. G. et al. Inhibition of human Chk1 causes increased initiation of DNA replication, phosphorylation of ATR targets, and DNA breakage. Mol. Cell. Biol 25, 3553–3562 (2005). [DOI] [PMC free article] [PubMed] [Google Scholar]
- Petermann E. & Caldecott K. W. Evidence that the ATR/Chk1 pathway maintains normal replication fork progression during unperturbed S phase. Cell Cycle 5, 2203–2209 (2006). [DOI] [PubMed] [Google Scholar]
- Maya-Mendoza A., Petermann E., Gillespie D. A., Caldecott K. W. & Jackson D. A. Chk1 regulates the density of active replication origins during the vertebrate S phase. EMBO J. 26, 2719–2731 (2007). [DOI] [PMC free article] [PubMed] [Google Scholar]
- Petermann E., Woodcock M. & Helleday T. Chk1 promotes replication fork progression by controlling replication initiation. Proc. Natl Acad. Sci. USA 107, 16090–16095 (2010). [DOI] [PMC free article] [PubMed] [Google Scholar]
- Araki H. Cyclin-dependent kinase-dependent initiation of chromosomal DNA replication. Curr. Opin. Cell Biol. 22, 766–771 (2010). [DOI] [PubMed] [Google Scholar]
- Beck H. et al. Cyclin-dependent kinase suppression by WEE1 kinase protects the genome through control of replication initiation and nucleotide consumption. Mol. Cell Biol. 32, 4226–4236 (2012). [DOI] [PMC free article] [PubMed] [Google Scholar]
- Gilad O. et al. Combining ATR suppression with oncogenic Ras synergistically increases genomic instability, causing synthetic lethality or tumorigenesis in a dosage-dependent manner. Cancer Res. 70, 9693–9702 (2010). [DOI] [PMC free article] [PubMed] [Google Scholar]
- Brown E. J. & Baltimore D. Essential and dispensable roles of ATR in cell cycle arrest and genome maintenance. Genes Dev. 17, 615–628 (2003). [DOI] [PMC free article] [PubMed] [Google Scholar]
- Menzel T. et al. A genetic screen identifies BRCA2 and PALB2 as key regulators of G2 checkpoint maintenance. EMBO Rep. 12, 705–712 (2011). [DOI] [PMC free article] [PubMed] [Google Scholar]
- Theunissen J. W. & Petrini J. H. Methods for studying the cellular response to DNA damage: influence of the Mre11 complex on chromosome metabolism. Methods Enzymol. 409, 251–284 (2006). [DOI] [PubMed] [Google Scholar]
- Reinhardt H. C. & Yaffe M. B. Kinases that control the cell cycle in response to DNA damage: Chk1, Chk2, and MK2. Curr. Opin. Cell Biol. 21, 245–255 (2009). [DOI] [PMC free article] [PubMed] [Google Scholar]
- Soni V., Cahir-McFarland E. & Kieff E. LMP1 TRAFficking activates growth and survival pathways. Adv. Exp. Med. Biol. 597, 173–187 (2007). [DOI] [PubMed] [Google Scholar]
- Hanahan D. & Weinberg R. A. Hallmarks of cancer: the next generation. Cell 144, 646–674 (2011). [DOI] [PubMed] [Google Scholar]
- Halazonetis T. D., Gorgoulis V. G. & Bartek J. An oncogene-induced DNA damage model for cancer development. Science 319, 1352–1355 (2008). [DOI] [PubMed] [Google Scholar]
- Gorgoulis V. G. et al. Activation of the DNA damage checkpoint and genomic instability in human precancerous lesions. Nature 434, 907–913 (2005). [DOI] [PubMed] [Google Scholar]
- Konishi H. et al. Mutation of a single allele of the cancer susceptibility gene BRCA1 leads to genomic instability in human breast epithelial cells. Proc. Natl Acad. Sci. USA 108, 17773–17778 (2011). [DOI] [PMC free article] [PubMed] [Google Scholar]
- Heikkinen K. et al. RAD50 and NBS1 are breast cancer susceptibility genes associated with genomic instability. Carcinogenesis 27, 1593–1599 (2006). [DOI] [PMC free article] [PubMed] [Google Scholar]
- Verma R. S., Babu A. (ed.)Human chromosomes, manual of basic techniques Pergamon Press, Inc (1989). [Google Scholar]
- Parplys A. C., Petermann E., Petersen C., Dikomey E. & Borgmann K. DNA damage by X-rays and their impact on replication processes. Radiother. Oncol. 102, 466–471 (2012). [DOI] [PubMed] [Google Scholar]
- Jackson D. A. & Pombo A. Replicon clusters are stable units of chromosome structure: evidence that nuclear organization contributes to the efficient activation and propagation of S phase in human cells. J. Cell Biol. 140, 1285–1295 (1998). [DOI] [PMC free article] [PubMed] [Google Scholar]
Associated Data
This section collects any data citations, data availability statements, or supplementary materials included in this article.
Supplementary Materials
Supplementary Figures S1-S7 and Supplementary Tables S1-S3


