Abstract
Increased levels of bile acids (BAs) due to the various hepatic diseases could interfere with the metabolism of xenobiotics, such as drugs, and endobiotics including steroid hormones. UDP-glucuronosyltransferases (UGTs) are involved in the conjugation and elimination of many xenobiotics and endogenous compounds. The present study sought to investigate the potential for inhibition of UGT enzymes by BAs. The results showed that taurolithocholic acid (TLCA) exhibited the strongest inhibition toward UGTs, followed by lithocholic acid. Structure-UGT inhibition relationships of BAs were examined and in vitro-in vivo extrapolation performed by using in vitro inhibition kinetic parameters (Ki) in combination with calculated in vivo levels of TLCA. Substitution of a hydrogen with a hydroxyl group in the R1, R3, R4, R5 sites of BAs significantly weakens their inhibition ability toward most UGTs. The in vivo inhibition by TLCA toward UGT forms was determined with following orders of potency: UGT1A4 > UGT2B7 > UGT1A3 > UGT1A1 ∼ UGT1A7 ∼ UGT1A10 ∼ UGT2B15. In conclusion, these studies suggest that disrupted homeostasis of BAs, notably taurolithocholic acid, found in various diseases such as cholestasis, could lead to altered metabolism of xenobiotics and endobiotics through inhibition of UGT enzymes.
Keywords: cholestasis, endobiotics, structure-UDP-glucuronosyltransferase inhibition relationship, xenobiotics
Bile acids (BAs), the major end-products of cholesterol metabolism, play a key role in the solubilization, absorption, and transportation of dietary lipids in the intestine (1). In humans, the most abundant BAs contain cholic acid (CA), chenodeoxycholic acid, deoxycholic acid, lithocholic acid (LCA), and ursodeoxycholic acid (UDCA) (2). In the livers of mice and rats, chenodeoxycholic acid can be further converted into α- and β-muricholic acid (3). Under normal conditions, BAs exist at low concentrations in the peripheral circulation. Various hepatic and intestinal diseases can significantly affect the total BA levels and disrupt the BA homeostasis. For example, cholestasis can disturb the bile secretory process, leading to the accumulation of toxic BAs in the liver (4).
Human UDP-glucuronosyltransferases (UGTs), endogenous membrane proteins located in endoplasmic reticulum, can conjugate various endogenous and exogenous compounds (5). BAs are substrates of UGTs, and UGT-catalyzed glucuronidation of BAs facilitate their hydrophilicity, increase their elimination from the liver, and decrease their potential for hepatic toxicity (6–8). For example, UGT1A3 can catalyze C24-glucuronidation of chenodeoxycholic acid, LCA, and hyodeoxycholic acid (HDCA) through forming acyl glucuronides (9). UGT2B4 is involved in the 6α-glucuronidation of BAs such as HDCA (10). UGT2B7 is the UGT isoform involved in the 3α- and 6α-glucuronidation of primary, secondary, and hydroxylated BA (9).
As substrates for UGT enzymes, BAs might also exhibit inhibitory effects toward various UGT forms. Previous studies revealed that some BA components exhibit inhibitory effects toward 4-methylumbelliferone (4-MU) glucuronidation, including LCA, dehydrocholic acid (DHCA), and sodium chenodeoxycholate (CDCA) (11). However, the complete inhibition profile of BAs toward different UGT forms remains unclear. Additionally, the BA structure-UGT inhibition relationships are important to determine what structural basis of BAs affects their inhibition potentials toward different UGTs. Therefore, the present study evaluated the inhibition capability of various BAs toward UGT forms in liver and intestine. As previously described (12), recombinant UGT isoform-catalyzed 4-MU glucuronidation reactions were used to evaluate the inhibition potential of BAs toward UGTs except for UGT1A4, and where trifluoperazine (TFP) glucuronidation was performed as the standard reaction to evaluate the inhibition potential of BAs toward UGT1A4 activity.
MATERIALS AND METHODS
Materials
4-MU, 4-methylumbelliferone-β-d-glucuronide (4-MUG), Tris-HCl, 7-hydroxycoumarin, azidothymidine (AZT) (purity ≥98%), TFP (purity ≥99%), estradiol (purity ≥98%), and uridine-5′-diphosphoglucuronic acid trisodium salt (UDPGA) were purchased from Sigma-Aldrich (St. Louis, MO). Recombinant human UGT isoforms (UGT1A1, UGT1A3, UGT1A4, UGT1A6, UGT1A7, UGT1A8, UGT1A9, UGT1A10, UGT2B7, and UGT2B15) expressed in baculovirus-infected insect cells were obtained from BD Gentest Corp. (Woburn, MA). HDCA, LCA, sodium taurochenodeoxycholate (TCDCA), taurocholic acid sodium salt hydrate, CDCA, taurolithocholic acid (TLCA), UDCA, CA, DHCA, sodium deoxycholate (DCA), sodium tauroursodeoxycholate (TUDCA), sodium taurodeoxycholate hydrate (TDCA), and glycocholic acid hydrate (GCA) were obtained from Sigma-Aldrich. The purity of these compounds was above 95%. All other reagents were of HPLC grade or of the highest grade commercially available.
Initial screening of BAs’ inhibition toward the activity of recombinant UGTs
The inhibition capability of BAs toward all the UGT forms, except UGT1A4, was evaluated using recombinant UGT-catalyzed 4-MU glucuronidation as the probe reaction, as previously described (12, 13). The incubation system (total volume 200 μl) contained recombinant UGTs, 5 mM UDPGA, 5 mM MgCl2, 50 mM Tris-HCl (pH 7.4), and 4-MU in the absence or presence of different concentrations of various BAs. The incubation time used and protein concentration were previously determined to ensure the reaction rate within the linear range. The 4-MU concentration was equal to known Km or S50 values for each UGT form. The concentrations of 4-MU and recombinant UGTs, and incubation time are given in supplementary Table I. The incubation reaction was initiated through addition of UDPGA to the mixture after a 5 min preincubation at 37°C. The reactions were quenched by adding 100 μl acetonitrile with 7-hydroxycoumarin (100 μM) as internal standard. The mixture was centrifuged at 20,000 g for 10 min, and an aliquot of supernatant was transferred to an auto-injector vial for HPLC analysis. The HPLC system (Shimadzu, Kyoto, Japan) contained a SCL-10A system controller, two LC-10AT pumps, a SIL-10A auto-injector, and a SPD-10AVP UV detector. Chromatographic separation was carried out using a C18 column (4.6 × 200 mm, 5 μm, Kromasil) at a flow rate of 1 ml/min and UV detector at 316 nm. The mobile phase consisted of acetonitrile (A) and water containing 0.5% (v/v) formic acid (B). The following gradient condition was used: 0–15 min, 95–40% B; 15–20 min, 10% B; 20–30 min, 95% B. The calculation curve was generated by peak area ratio (4-MUG/internal standard) over the concentration range of 4-MUG 0.1–100 mM. The curve was linear over this concentration range, with an r2 value >0.99. The limits of detection and quantification were determined at signal-to-noise ratios of 3 and 10, respectively. The accuracy and precision for each concentration was more than 95%.
Due to the low catalytic activity of UGT1A4 toward 4-MU glucuronidation, the UGT1A4-catalyzed TFP glucuronidation was performed to evaluate the inhibition potential of BAs toward UGT1A4 activity. TFP (40 μM, near its Km value), was incubated with recombinant UGT1A4 (0.1 mg/ml) at 37°C for 20 min in the absence or presence of BAs (14).
TLCA's inhibition toward hepatocyte UGT-catalyzed 4-MU glucuronidation
Primary hepatocytes were isolated from C57BL/6NCr mice and cultured as previously described (15). 4-MU (50 μM) and TLCA (50 nM) were added to the medium. After a 1 h incubation at 37°C, the medium and cells were isolated. Methanol (v/v) 1:1 and 5 μM chlorpropamide as an internal standard were added to the medium, and 1 ml methanol with 5 μM chlorpropamide as an internal standard were added to extract the compounds in the cells. After centrifugation at 20,000 g for 10 min, the aliquot of supernatant was determined to detect the formation of 4-MUG.
BAs’ inhibition toward human liver microsome-catalyzed azidothymidine and estradiol glucuronidation
Twenty-five donor pooled human liver microsomes (HLMs) were purchased from Research Institute for Liver Diseases (RILD, Shang Hai, China). For azidothymidine (AZT) glucuronidation, the typical incubation system (total volume 200 μl) contained 0.5 mg/ml HLMs, 5 mM UDPGA, 5 mM MgCl2, 50 mM Tris-HCl (pH 7.4), 50 μg/mg protein alamethicin, and AZT (concentration is corresponding to the Km value). The incubation time was 30 min. After centrifugation at 20,000 g for 10 min, aliquots of the supernatants were analyzed by HPLC (Shimadzu, Kyoto, Japan), equipped with a SCL-10A system controller, two LC-10AT pumps, a SIL-10A auto sampler, and a SPD-10AVP UV detector. A C-18 column (250 mm × 4.6 mm I.D., 5 μm, Kromasil) was used to separate AZT and its glucuronide. The mobile phase was acetonitrile (A) and 0.2% formic acid (B) at a flow rate of 1.0 ml/min, with an isocratic: 0–25 min 90% B. The detector wavelength was set at 260 nm. Because there was no standard for the AZT glucuronide, a standard curve of AZT was used to quantify glucuronide formation.
Estradiol (10 μM) was incubated with HLMs for 20 min, with the final protein concentrations of 0.25 mg/ml. Estradiol glucuronidation samples were analyzed on the Ultra Fast Liquid Chromatography (UFLC) system. A Shim-pack XR-ODS (50.0 mm × 2.0 mm I.D., 2.2 μm, Shimadzu) analytical column with an ODS guard column (5 mm × 2.0 mm I.D., 2.2 μm, Shimadzu) was used and kept at 40°C. The mobile phase consisted of acetonitrile (A) and 0.2% formic acid (B) at a flow rate of 0.3 ml/min, with a gradient: 0–9 min, 90% B–30% B; 9–12.5 min, 5% B; 12.5–16 min, balance to 90% B. The detector wavelength was set at 250 nm. A standard curve of the estradiol-3-O-glucuronide was used to quantify glucuronide formation.
In vitro-in vivo extrapolation
The reaction velocity was determined at different concentrations of substrates and inhibitors. The durations in the inhibition kinetic study were the same as the initial screening study. Dixon and Lineweaver-Burk plots were used for determination of inhibition kinetic type. The second plot of slopes from the Lineweaver-Burk plot versus inhibitor concentrations was used to calculate the Ki value. The in vivo inhibition magnitude is affected by both in vitro inhibition kinetic parameters (Ki) and in vivo concentrations of inhibitors. Therefore, the following equation was employed to predict in vivo situation.
The terms are defined as follows: AUCi/AUC is the predicted ratio of in vivo exposure of xenobiotics or endogenous compounds in control and disease situations, Ki is the reversible inhibition constant, and [I]in vivo is the in vivo concentration of BAs.
RESULTS
Structure-inhibition relationship of BAs toward UGT isoforms
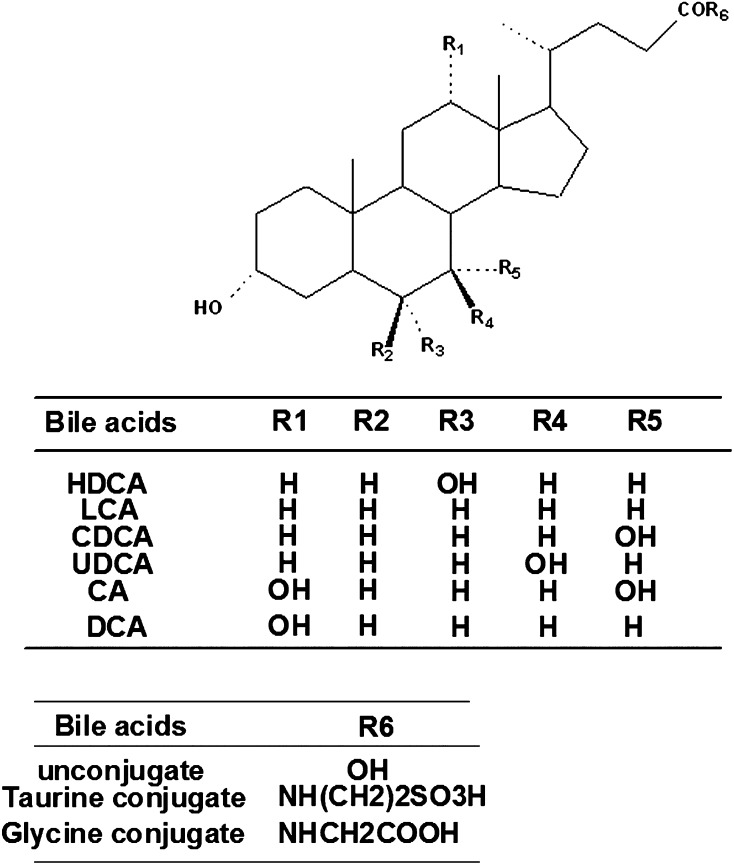
The structures of tested BAs are listed in Fig. 1, and the inhibitory capabilities of these BAs toward different UGT forms is given in Table 1. Among the tested UGT enzymes, the activity of UGT1A6, UGT1A8, and UGT1A9 were not affected by various BAs. Among the tested BAs at 100 μM, TCDCA, taurocholic acid sodium salt hydrate, CDCA, UDCA, CA, DHCA, DCA, TUDCA, TDCA, and GCA exhibited no or weak inhibition toward all the tested UGT forms, with inhibition magnitudes less than 90%. HDCA exerted 90.5% inhibition toward UGT2B7-catalyzed 4-MU glucuronidation, and low inhibition toward other UGTs. LCA exhibited the strongest inhibition (more than 90%) toward UGT1A4 and UGT2B15. TLCA showed strong inhibition toward most of UGT forms, including UGT1A1 (94.6%), UGT1A3 (96.6%), UGT1A4 (100%), UGT1A7 (90.9%), UGT2B7 (98.3%), and UGT2B15 (94.7%).
Fig. 1.
The structure of BAs used in this study.
TABLE 1.
Initial screening of BAs (100 μM) toward various important UGT forms
| Bile Acids | UGT1A1 | UGT1A3 | UGT1A4 | UGT1A6 | UGT1A7 | UGT1A8 | UGT1A9 | UGT1A10 | UGT2B7 | UGT2B15 |
| HDCA | 44.6 ± 0.4*** | 26.1 ± 6.8* | 13.7 ± 0.5** | 95.4 ± 2.1 | 47.8 ± 0.5*** | 84.0 ± 6.1* | 50.4 ± 4.3* | 52.5 ± 0.9*** | 9.5 ± 2.0** | 34.6 ± 0.4*** |
| LCA | 21.1 ± 8.0*** | 16.4 ± 0.5* | 0.0 ± 0.0*** | 19.9 ± 1.3** | 30.0 ± 2.2*** | 64.3 ± 7.1** | 65.2 ± 17.4 | 25.0 ± 0.3*** | 15.7 ± 1.9** | 0.3 ± 0.0*** |
| TCDCA | 17.5 ± 6.7*** | 21.6 ± 1.3* | 27.8 ± 2.1** | 84.6 ± 1.6* | 52.7 ± 3.3*** | 59.1 ± 20.0* | 75.3 ± 1.1* | 41.0 ± 8.2** | 28.1 ± 2.0** | 28.4 ± 1.1*** |
| Taurocholic acid sodium salt hydrate | 62.7 ± 6.1** | 66.7 ± 17.3 | 73.8 ± 1.4 | 105.8 ± 0.4 | 94.1 ± 2.5 | 75.5 ± 8.1* | 94.7 ± 6.2 | 71.9 ± 0.3** | 69.3 ± 7.7* | 70.2 ± 3.9* |
| CDCA | 37.7 ± 8.4** | 47.2 ± 8.0 | 20.2 ± 1.4** | 92.9 ± 2.6 | 47.4 ± 12.7** | 29.2 ± 3.1*** | 74.0 ± 1.2* | 39.9 ± 2.3*** | 15.4 ± 2.1** | 19.8 ± 1.0*** |
| TLCA | 5.4 ± 0.0*** | 3.4 ± 0.4* | 0.0 ± 0.0*** | 52.4 ± 0.2** | 9.1 ± 8.8*** | 24.1 ± 3.5*** | 54.4 ± 7.1* | 14.8 ± 6.8*** | 1.7 ± 0.6** | 5.3 ± 0.0*** |
| UDCA | 27.4 ± 0.4* | 92.8 ± 49.8 | 25.3 ± 0.8** | 85.0 ± 0.9* | 45.7 ± 9.6** | 29.8 ± 3.8*** | 54.5 ± 5.8* | 57.6 ± 1.4*** | 46.2 ± 4.9* | 54.1 ± 1.2** |
| CA | 61.9 ± 0.2** | 135.5 ± 18.8 | 73.0 ± 1.1 | 100.7 ± 1.0 | 103.4 ± 2.8 | 86.1 ± 3.2* | 89.0 ± 3.7 | 74.4 ± 0.5** | 83.2 ± 7.9 | 72.1 ± 0.2** |
| DHCA | 76.4 ± 13.3 | 117.5 ± 30.2 | 80.7 ± 25.3 | 95.0 ± 0.7 | 80.9 ± 1.7** | 87.1 ± 16.0 | 83.0 ± 3.5 | 90.5 ± 2.9* | 81.0 ± 3.1 | 77.7 ± 1.1* |
| DCA | 33.9 ± 2.3*** | 57.8 ± 11.8 | 43.8 ± 21.8* | 90.3 ± 2.5 | 68.0 ± 3.7** | 88.7 ± 32.5 | 67.5 ± 2.6* | 39.1 ± 1.5*** | 45.8 ± 2.2* | 35.4 ± 1.0*** |
| TUDCA | 10.6 ± 0.1*** | 49.1 ± 8.5 | 30.8 ± 4.6** | 76.9 ± 2.4* | 48.8 ± 11.1** | 59.3 ± 0.6*** | 82.9 ± 9.1 | 38.2 ± 13.2** | 26.1 ± 2.3** | 25.3 ± 0.7*** |
| TDCA | 34.1 ± 0.1** | 61.1 ± 8.8 | 41.1 ± 13.3 | 93.4 ± 1.1 | 60.4 ± 2.5*** | 74.7 ± 11.3 | 85.0 ± 0.5 | 50.8 ± 1.0* | 33.4 ± 2.0* | 40.7 ± 1.9*** |
| GCA | 65.4 ± 4.5** | 143.2 ± 44.3 | 54.5 ± 10.3 | 91.6 ± 2.9 | 82.0 ± 15.0 | 80.9 ± 8.7 | 94.0 ± 4.8 | 75.7 ± 3.8** | 48.4 ± 3.5* | 63.4 ± 1.5** |
The values shown are the residual activity, which was calculated using the following equation: % residual activity = (the activity at 100 μM BAs/the control activity at 0 μM BAs) × 100%. *P < 0.05, **P < 0.01, ***P < 0.001, compared with control activity.
The structure-UGT inhibition relationship can be observed using the combination of the BAs’ structures (Fig. 1) and the UGT inhibition results (Table 1). The substitution of hydrogen with hydroxyl group at the R1, R3, R4, R5 sites significantly weakens the inhibition toward most UGT forms. In comparison with the inhibition magnitude of LCA and TLCA toward UGT2B7, a conclusion can be drawn that the taurine conjugation of LCA can strengthen the inhibition potential toward UGT2B7.
To demonstrate the physiological significance of these observations, TLCA (50 nM) was added to the medium to investigate whether it could inhibit hepatocyte UGT-catalyzed 4-MU glucuronidation activity. The results showed significant inhibition of TLCA toward hepatocyte UGT-catalyzed 4-MU glucuronidation (supplementary Fig. I).
Different inhibition type and kinetic parameters of TLCA toward UGT forms
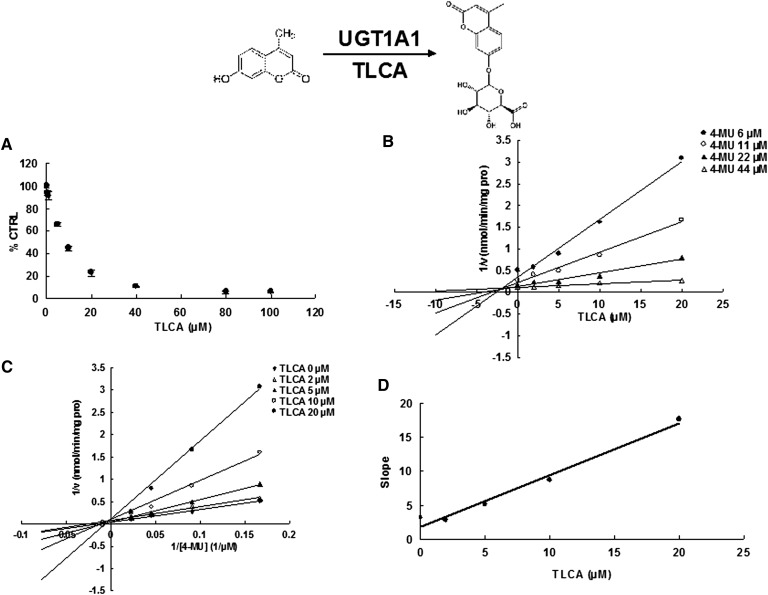
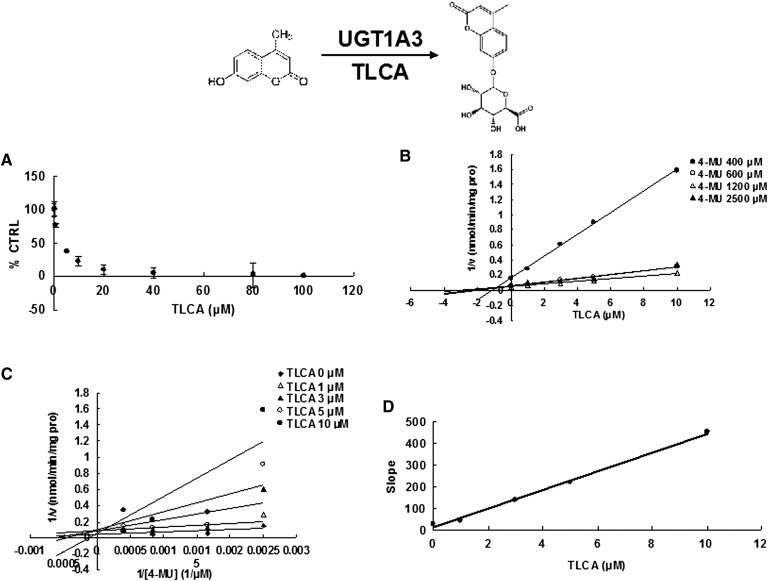
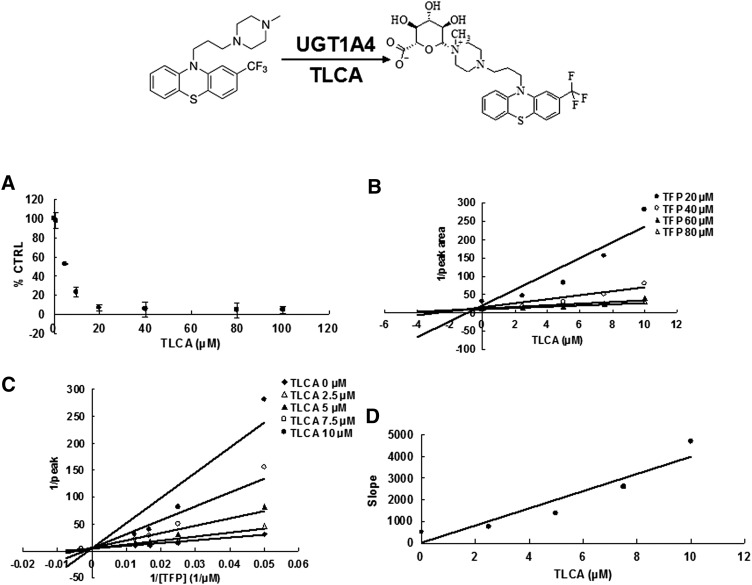
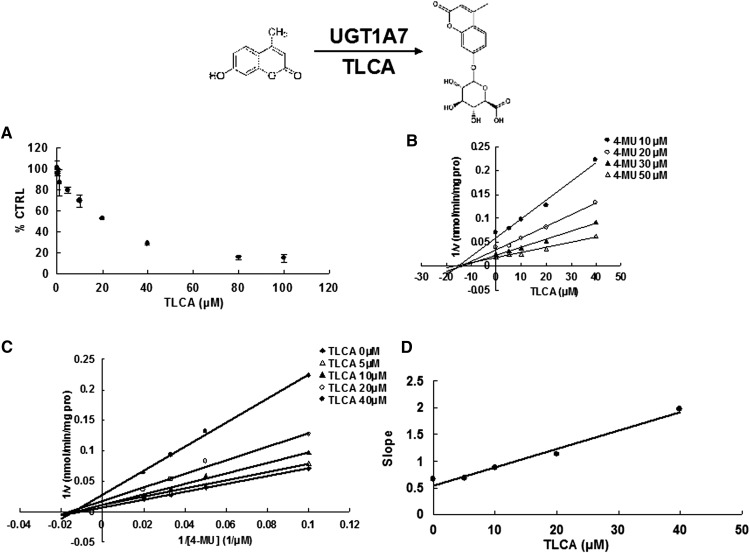
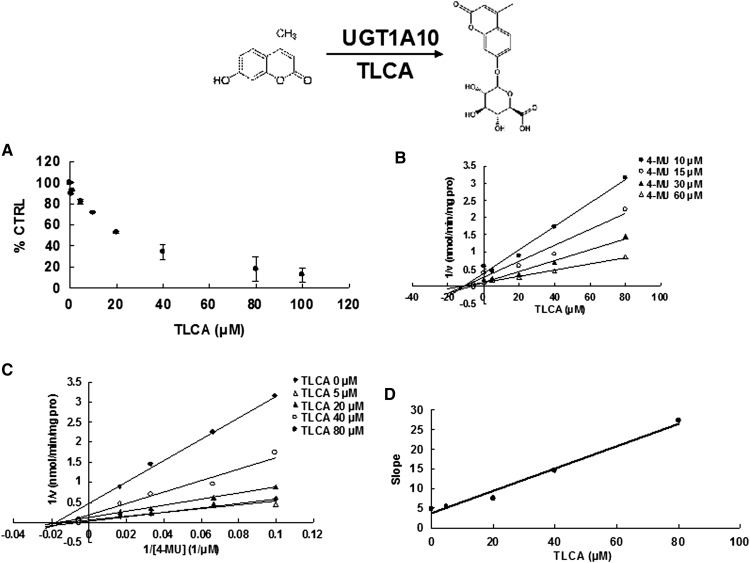
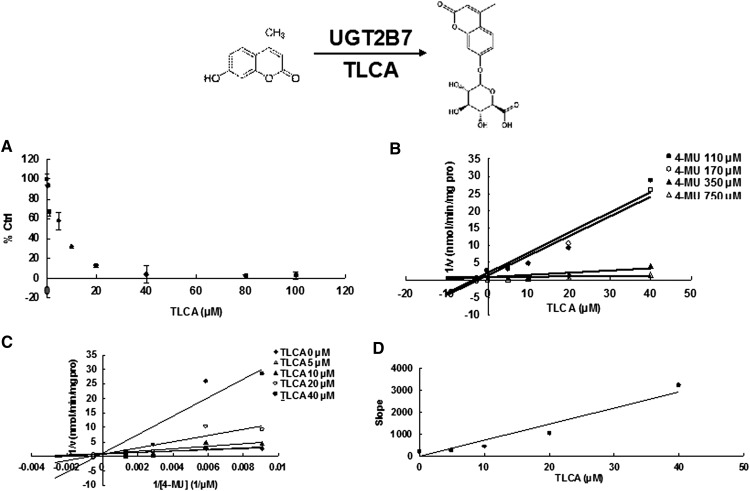
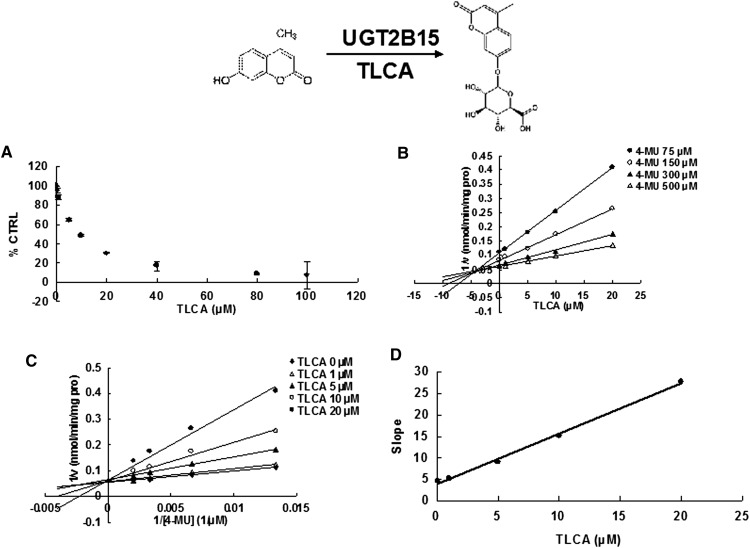
Due to the potent inhibition of TLCA toward many UGT forms, the inhibition kinetic type and parameters (Ki) were further investigated. Both Dixon and Lineweaver-Burk plots were employed to evaluate the inhibition type, and the second plot using the slopes obtained from Lineweaver-Burk plot versus the concentrations of TLCA was used to calculate the inhibition kinetic parameters (Ki). If the intersection point was located in the vertical axis and the second quadrant in the Lineweaver-Burk plot and Dixon plot respectively, the inhibition type was classified as competitive inhibition. If the intersection point was located in horizontal axis in both Dixon and Lineweaver-Burk plots, the inhibition type was classified as noncompetitive inhibition. The results show that TLCA competitively inhibited UGT1A1 (Fig. 2B, C), UGT1A3 (Fig. 3B, C), UGT1A4 (Fig. 4B, C), and noncompetitively inhibited UGT1A7 (Fig. 5B, C) and UGT1A10 (Fig. 6B, C). The inhibition of UGT2B7 (Fig. 7B, C) and UGT2B15 (Fig. 8B, C) was also best fit to competitive inhibition. The inhibition kinetic parameters (Ki) were calculated to be 2.4, 0.3, 0.03, 16.0, 12.9, 0.1, and 3.3 μM for the activity of UGT1A1 (Fig. 2D), UGT1A3 (Fig. 3D), UGT1A4 (Fig. 4D), UGT1A7 (Fig. 5D), UGT1A10 (Fig. 6D), UGT2B7 (Fig. 7D), and UGT2B15 (Fig. 8D), respectively.
Fig. 2.
Evaluation of TLCA's inhibition toward recombinant UGT1A1-catalyzed 4-MU glucuronidation. A: TLCA exhibited concentration-dependent inhibition toward recombinant UGT1A1-catalyzed 4-MU glucuronidation. B: Dixon plot of TLCA's inhibition toward recombinant UGT1A1-catalyzed 4-MU glucuronidation. C: Lineweaver-Burk plot of TLCA's inhibition toward recombinant UGT1A1-catalyzed 4-MU glucuronidation. D: Second plot of TLCA's inhibition toward recombinant UGT1A1-catalyzed 4-MU glucuronidation. The data point represents the mean of the duplicate experiments.
Fig. 3.
Evaluation of TLCA's inhibition toward recombinant UGT1A3-catalyzed 4-MU glucuronidation. A: TLCA exhibited concentration-dependent inhibition toward recombinant UGT1A3-catalyzed 4-MU glucuronidation. B: Dixon plot of TLCA's inhibition toward recombinant UGT1A3-catalyzed 4-MU glucuronidation. C: Lineweaver-Burk plot of TLCA's inhibition toward recombinant UGT1A3-catalyzed 4-MU glucuronidation. D: Second plot of TLCA's inhibition toward recombinant UGT1A3-catalyzed 4-MU glucuronidation. The data point represents the mean of the duplicate experiments.
Fig. 4.
Evaluation of TLCA's inhibition toward recombinant UGT1A4-catalyzed TFP glucuronidation. A: TLCA exhibited concentration-dependent inhibition toward recombinant UGT1A4-catalyzed TFP glucuronidation. B: Dixon plot of TLCA's inhibition toward recombinant UGT1A4-catalyzed TFP glucuronidation. C: Lineweaver-Burk plot of TLCA's inhibition toward recombinant UGT1A4-catalyzed TFP glucuronidation. D: Second plot of TLCA's inhibition toward recombinant UGT1A4-catalyzed TFP glucuronidation. The data point represents the mean of the duplicate experiments.
Fig. 5.
Evaluation of TLCA's inhibition toward recombinant UGT1A7-catalyzed 4-MU glucuronidation. A: TLCA exhibited concentration-dependent inhibition toward recombinant UGT1A7-catalyzed 4-MU glucuronidation. B: Dixon plot of TLCA's inhibition toward recombinant UGT1A7-catalyzed 4-MU glucuronidation. C: Lineweaver-Burk plot of TLCA's inhibition toward recombinant UGT1A7-catalyzed 4-MU glucuronidation. D: Second plot of TLCA's inhibition toward recombinant UGT1A7-catalyzed 4-MU glucuronidation. The data point represents the mean of the duplicate experiments.
Fig. 6.
Evaluation of TLCA's inhibition toward recombinant UGT1A10-catalyzed 4-MU glucuronidation. A: TLCA exhibited concentration-dependent inhibition toward recombinant UGT1A10-catalyzed 4-MU glucuronidation. B: Dixon plot of TLCA's inhibition toward recombinant UGT1A10-catalyzed 4-MU glucuronidation. C: Lineweaver-Burk plot of TLCA's inhibition toward recombinant UGT1A10-catalyzed 4-MU glucuronidation. D: Second plot of TLCA's inhibition toward recombinant UGT1A10-catalyzed 4-MU glucuronidation. The data point represents the mean of the duplicate experiments.
Fig. 7.
Evaluation of TLCA's inhibition toward recombinant UGT2B7-catalyzed 4-MU glucuronidation. A: TLCA exhibited concentration-dependent inhibition toward recombinant UGT2B7-catalyzed 4-MU glucuronidation. B: Dixon plot of TLCA's inhibition toward recombinant UGT2B7-catalyzed 4-MU glucuronidation. C: Lineweaver-Burk plot of TLCA's inhibition toward recombinant UGT2B7-catalyzed 4-MU glucuronidation. D: Second plot of TLCA's inhibition toward recombinant UGT2B7-catalyzed 4-MU glucuronidation. The data point represents the mean of the duplicate experiments.
Fig. 8.
Evaluation of TLCA's inhibition toward recombinant UGT2B15-catalyzed 4-MU glucuronidation. A: TLCA exhibited concentration-dependent inhibition toward recombinant UGT2B15-catalyzed 4-MU glucuronidation. B: Dixon plot of TLCA's inhibition toward recombinant UGT2B15-catalyzed 4-MU glucuronidation. C: Lineweaver-Burk plot of TLCA's inhibition toward recombinant UGT2B15-catalyzed 4-MU glucuronidation. D: Second plot of TLCA's inhibition toward recombinant UGT2B15-catalyzed 4-MU glucuronidation. The data point represents the mean of the duplicate experiments.
Two typical substrates, AZT and estradiol, were then selected as representative of xenobiotic and endogenous substrates to clarify the influence of TLCA toward the glucuronidation of these two compounds. The concentration-dependent inhibition of TLCA toward the glucuronidation of AZT and estradiol was also demonstrated (supplementary Fig. IIA, Fig. 3A). Furthermore, the competitive inhibition of TLCA toward the glucuronidation of AZT (supplementary Fig. IIB, C) and estradiol (supplementary Fig. IIIB, C) was demonstrated. The inhibition kinetic parameters (Ki) were calculated to be 0.3 and 2.2 μM for inhibition of TLCA toward AZT and estradiol glucuronidation (supplementary Figs. IID, IIID).
Prediction of in vivo metabolic disorders in humans
Due to the strongest inhibition potential of TLCA toward different UGT enzymes, changes in in vivo metabolism could be predicted based on the concentration of TLCA. The concentration of TLCA in serum obtained from mice with intrahepatic cholestasis of pregnancy was reported to be 0.3 μM (16). Using this concentration in combination with the Ki values for the inhibition of TLCA toward 4-MU glucuronidation, the AUCi/AUC values were calculated to be 1.1, 2, 11, 1.02, 1.02, 4, and 1.1 for UGT1A1, UGT1A3, UGT1A4, UGT1A7, UGT1A10, UGT2B7, and UGT2B15, respectively. In humans, the TLCA concentration was reported to never exceed 25 nM (17). Using this maximum value, the AUCi/AUC values were calculated to be 1.01, 1.08, 1.83, 1.002, 1.002, 1.25, and 1.008 for UGT1A1, UGT1A3, UGT1A4, UGT1A7, UGT1A10, UGT2B7, and UGT2B15, respectively.
DISCUSSION
The inhibitory capability of BAs toward UGTs is difficult to study using conventional animal models due to the complexity of factors influencing activity in vivo. For example, the role of BA in the activation of nuclear receptors might interfere with the evaluation of BA inhibition toward UGT enzymes. The pregnane X receptor was found to be activated by LCA (18, 19). LCA can also activate the vitamin D receptor (20). CDCA, CA, GCA, and GCDCA were reported to be agonists of farnesoid X receptor (FXR). (21–23). Tauro-β-muricholic acid in mice was reported to be a naturally occurring FXR antagonist (24). All affected nuclear receptors regulate the expression and activity of different genes encoding UGT enzymes. For example, BAs can induce the activity of UGT2B4 via activation of FXR (25). The UGT2B4 promoter also contains a peroxisome proliferator-activated receptor (PPAR)α response element, and can be activated by PPARα agonist fenofibrate (26). The activity of UGT2B7 can be inhibited by hydrophobic BAs via a negative FXR response element located in the UGT2B7 promoter (27). FXR activation can also regulate the expression of UGT1A3 (28). To avoid these complex factors, a relatively simple in vitro UGT enzyme incubation system was utilized in the present study.
The detailed metabolic inhibition profile of BAs toward important UGT isoforms was clarified in the present study, and TLCA was demonstrated to be the strongest inhibitor toward most of UGT isoforms, followed by LCA, which is consistent with the reports in which LCA and TLCA were reported to be able to significantly induce the liver damage (29, 30). LCA can be metabolized through UGT isoform-catalyzed glucuronidation elimination, so, the wide inhibition of LCA toward UGT isoforms was observed in the present study. TLCA has similar structure with LCA, and can enter the activity cavity. However, TLCA cannot be metabolized through glucuronidation by our present study (data not shown). Therefore, TLCA exhibited stronger inhibition than LCA. CA and GCA, at 100 μM, were found to increase the activity of UGT1A3 by 35 and 45%, respectively. Given that induced expression of UGT1A3 through nuclear receptors does not occur in the present in vitro system, the allosteric activation of CA and GCA toward UGT1A3 might be the potential reason. However, the detailed mechanism needs to be further investigated
According to the predicted values of AUCi/AUC, TLCA exhibited the strongest inhibition toward UGT1A4-catalyzed metabolic reaction. UGT1A4 is widely accepted to be the main UGT enzyme involved in the N-glucuronidation of primary, secondary, and tertiary amines located in the compounds. Xenobiotics catalyzed by UGT1A4 include nicotine, cotinine, and nitrosamines (31). The strongest inhibition of UGT1A4 by BAs might significantly affect the metabolism of these compounds. TLCA also exerted strong inhibition potential toward UGT2B7 and UGT1A3. These two UGT forms were also involved in the metabolism of BAs, thus inhibition of these two UGT forms by BAs could in turn affect BA metabolism. Additionally, these two UGT forms can also participate in the metabolism of many drugs, including AZT. Therefore, this substrate was selected to evaluate whether its glucuronidation could be affected by TLCA. Indeed, TLCA competitively inhibited HLM-mediated glucuronidation of AZT with a potent inhibition potential of Ki = 0.3 μM. In addition to the UGT1A4 isoform, BAs can inhibit other UGTs including UGT1A1, UGT1A7, UGT1A10, and UGT2B15. UGT1A1 plays a key role in the metabolism of two important endogenous compounds, bilirubin and estradiol. The inhibition of TLCA toward the glucuronidation of estradiol was also demonstrated in the present study. The accumulation of BAs was reported to potentiate colon carcinogenesis (32). Low activity of UGT1A7 and UGT1A10 was also strongly correlated with the risk of colon cancer (33, 34). Inhibition of UGT1A7 and UGT1A10 by TLCA could provide a possible link to the correlation of increased BAs and high risk of colon cancer. In the present study, two concentrations of TLCA were used to predict the in vivo situation due to the relatively few reports on the serum concentrations of TLCA. Information on the serum concentrations of TLCA in various diseases might reveal a better understanding of disease risk.
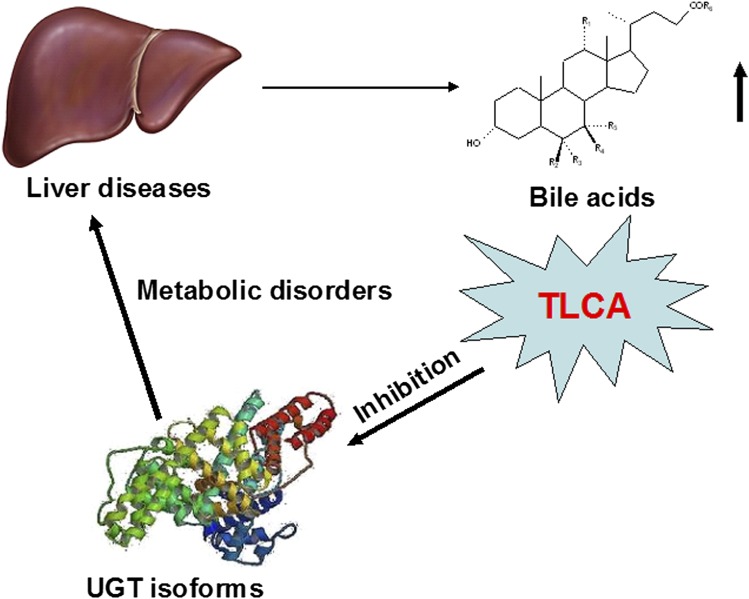
In conclusion, the present study details inhibition profiles of BAs toward UGT enzymes, and the BA structure-UGT inhibition relationships. In vivo risk was predicted based on the inhibition of TLCA toward UGTs due to the strongest inhibition of TLCA toward different forms of UGT. However, the influence of other BAs toward UGTs should not be neglected. It should also be noted that the present results should be considered in the context of the complex environment in vivo and in cells, such as the influence of BAs on nuclear receptors as summarized in Fig. 9. The disrupted homeostasis of BAs due to diseases (e.g., cholestasis) could inhibit UGT-catalyzed metabolism resulting in altered metabolism of xenobiotics and endogenous compounds.
Fig. 9.
Brief summary of the influence of elevated BAs toward hepatic metabolism of xenobiotics and endobiotics.
Supplementary Material
Footnotes
Abbreviations:
- AUC
- area under the curve
- AZT
- azidothymidine
- BA
- bile acid
- CA
- cholic acid
- CDCA
- sodium chenodeoxycholate
- DCA
- sodium deoxycholate
- DHCA
- dehydrocholic acid
- FXR
- farnesoid X receptor
- GCA
- glycocholic acid hydrate
- HDCA
- hyodeoxycholic acid
- HLM
- human liver microsome
- I.D.
- inner diameter
- LCA
- lithocholic acid
- 4-MU
- 4-methylumbelliferone
- 4-MUG
- 4-methylumbelliferone-β-d-glucuronide
- PPAR
- peroxisome proliferator-activated receptor
- TCDCA
- taurochenodeoxycholate
- TDCA
- sodium taurodeoxycholate hydrate
- TFP
- trifluoperazine
- TLCA
- taurolithocholic acid
- TUDCA
- sodium tauroursodeoxycholate
- UDCA
- ursodeoxycholic acid
- UDPGA
- uridine-5′-diphosphoglucuronic acid trisodium salt
- UGT
- UDP-glucuronosyltransferase
This work was supported by the National Natural Science Foundation of China (No. 81202586, 81274047 and No. 81102507) and the National Cancer Institute, Center for Cancer Research, Intramural Research Program. The authors have declared no conflicts of interest.
The online version of this article (available at http://www.jlr.org) contains supplementary data in the form of three figures and one table.
REFERENCES
- 1.Yang L., Xiong A., He Y., Wang Z., Wang C., Wang Z., Li W., Yang L., Hu Z. 2008. Bile acids metabolomic study on the CCl4- and α-naphthylisothiocyanate-induced animal models: quantitative analysis of 22 bile acids by ultraperformance liquid chromatography-mass spectrometry. Chem. Res. Toxicol. 21: 2280–2288 [DOI] [PubMed] [Google Scholar]
- 2.Russell D. W. 2003. The enzymes, regulation, and genetics of bile acid synthesis. Annu. Rev. Biochem. 72: 137–174 [DOI] [PubMed] [Google Scholar]
- 3.Elliott W. H., Hyde P. M. 1971. Metabolic pathways of bile acid synthesis. Am. J. Med. 51: 568–579 [DOI] [PubMed] [Google Scholar]
- 4.Palmeira C. M., Rolo A. P. 2004. Mitochondrially-mediated toxicity of bile acids. Toxicology. 203: 1–15 [DOI] [PubMed] [Google Scholar]
- 5.Kiang T. K., Ensom M. H., Chang T. K. 2005. UDP-glucuronosyltransferases and clinical drug-drug interactions. Pharmacol. Ther. 106: 97–132 [DOI] [PubMed] [Google Scholar]
- 6.Matern H., Matern S., Schelzig C., Gerok W. 1980. Bile acid UDP-glucoronyltransferase from human liver. Properties and studies on aglycone substrate specificity. FEBS Lett. 118: 251–254 [DOI] [PubMed] [Google Scholar]
- 7.Parquet M., Pessah M., Sacquet E., Salvat C., Raizman A., Infante R. 1985. Glucuronidation of bile acids in human liver, intestine and kidney. An in vitro study on hyodeoxycholic acid. FEBS Lett. 189: 183–187 [DOI] [PubMed] [Google Scholar]
- 8.Trottier J., Verreault M., Grepper S., Monte D., Belanger J., Kaeding J., Caron P., Inaba T. T., Barbier O. 2006. Human UDP-glucuronosyltransferase (UGT)1A3 enzyme conjugates chenodeoxycholic acid in the liver. Hepatology. 44: 1158–1170 [DOI] [PubMed] [Google Scholar]
- 9.Gall W. E., Zawada G., Mojarrabi B., Tephly T. R., Green M. D., Coffman B. L., Mackenzie P. I., Radominska-Pandya A. 1999. Differential glucuronidation of bile acids, androgens and estrogens by human UGT1A3 and 2B7. J. Steroid Biochem. Mol. Biol. 70: 101–108 [DOI] [PubMed] [Google Scholar]
- 10.Pillot T., Ouzzine M., Fournel-Gigleux S., Lafaurie C., Radominska A., Burchell B., Siest G., Magdalou J. 1993. Glucuronidation of hyodeoxycholic acid in human liver. Evidence for a selective role of UDP-glucuronosyltransferase 2B4. J. Biol. Chem. 268: 25636–25642 [PubMed] [Google Scholar]
- 11.Schneider H., Fiander H., Latta R. K., Ross N. W. 1993. Bile acid inhibition of xenobiotic-metabolizing enzymes is a factor in the mechanism of colon carcinogenesis: tests of aspects of the concept with glucuronosyltransferase. Eur. J. Cancer Prev. 2: 393–400 [DOI] [PubMed] [Google Scholar]
- 12.Fang Z. Z., Cao Y. F., Hu C. M., Hong M., Sun X. Y., Ge G. B., Liu Y., Zhang Y. Y., Yang L., Sun H. Z. 2013. Structure-inhibition relationship of ginsenosides towards UDP-glucuronosyltransferases (UGTs). Toxicol. Appl. Pharmacol. 267: 149–154 [DOI] [PubMed] [Google Scholar]
- 13.Lu H., Fang Z. Z., Cao Y. F., Hu C. M., Hong M., Sun X. Y., Li H., Liu Y., Fu X., Sun H. 2013. Isoliquiritigenin showed strong inhibitory effects towards multiple UDP-glucuronosyltransferase (UGT) isoform-catalyzed 4-methylumbelliferone (4-MU) glucuronidation. Fitoterapia. 84: 208–212 [DOI] [PubMed] [Google Scholar]
- 14.Uchaipichat V., Mackenzie P. I., Elliot D. J., Miners J. O. 2006. Selectivity of substrate (trifluoperazine) and inhibitor (amitriptyline, androsterone, canrenoic acid, hecogenin, phenylbutazone, quinidine, quinine, and sulfinpyrazone) “probes” for human UDPglucuronosyltransferases. Drug Metab. Dispos. 34: 449–456 [DOI] [PubMed] [Google Scholar]
- 15.Tanaka N., Matsubara T., Krausz K. W., Patterson A. D., Gonzalez F. J. 2012. Disruption of phospholipid and bile acid homeostasis in mice with nonalcoholic steatohepatitis. Hepatology. 56: 118–129 [DOI] [PMC free article] [PubMed] [Google Scholar]
- 16.Abu-Hayyeh S., Papacleovoulou G., Lovgren-Sandblom A., Tahir M., Oduwole O., Jamaludin N. A., Ravat S., Nikolova V., Chambers J., Selden C., et al. 2013. Intrahepatic cholestasis of pregnancy levels of sulfated progesterone metabolites inhibit farnesoid X receptor resulting in a cholestatic phenotype. Hepatology. 57: 716–726 [DOI] [PMC free article] [PubMed] [Google Scholar]
- 17.Takikawa H., Maruyama T., Ota S., Matsumoto K., Suqimoto T., Takano E. 1984. Conjugated hyperbilirubinemia in an autopsy case with myocardial infarction and sepsis. Jpn. J. Med. 23: 258–260 [DOI] [PubMed] [Google Scholar]
- 18.Staudinger J. L., Goodwin B., Jones S. A., Hawkins-Brown D., MacKenzie K. I., LaTour A., Liu Y., Klaassen C. D., Brown K. K., Reinhard J., et al. 2001. The nuclear receptor PXR is a lithocholic acid sensor that protects against liver toxicity. Proc. Natl. Acad. Sci. USA. 98: 3369–3374 [DOI] [PMC free article] [PubMed] [Google Scholar]
- 19.Xie W., Radominska-Pandya A., Shi Y., Simon C. M., Nelson M. C., Ong E. S., Waxman D. J., Evans R. M. 2001. An essential role for nuclear receptors SXR/PXR in detoxification of cholestatic bile acids. Proc. Natl. Acad. Sci. USA. 98: 3375–3380 [DOI] [PMC free article] [PubMed] [Google Scholar]
- 20.Makishima M., Lu T. T., Xie W., Whitfield G. K., Domoto H., Evans R. M., Haussler M. R., Mangelsdorf D. J. 2002. Vitamin D receptor as an intestinal bile acid sensor. Science. 296: 1313–1316 [DOI] [PubMed] [Google Scholar]
- 21.Fujino T., Une M., Imanaka T., Inoue K., Nishimaki-Mogami T. 2004. Structure-activity relationship of bile acids and bile acid analogs in regard to FXR activation. J. Lipid Res. 45: 132–138 [DOI] [PubMed] [Google Scholar]
- 22.Parks D. J., Blanchard S. G., Bledsoe R. K., Chandra G., Consler T. G., Kliewer S. A., Stimmel J. B., Willson T. M., Zavacki A. M., Moore D. D., et al. 1999. Bile acids: natural ligands for an orphan nuclear receptor. Science. 284: 1365–1368 [DOI] [PubMed] [Google Scholar]
- 23.Nakahara M., Furuya N., Takagaki K., Sugaya T., Hirota K., Fukamizu A., Kanda T., Fujii H., Sato R. 2005. Ileal bile acid-binding protein, functionally associated with the farnesoid X receptor or the ileal bile acid transporter, regulates bile acid activity in the small intestine. J. Biol. Chem. 280: 42283–42289 [DOI] [PubMed] [Google Scholar]
- 24.Li F., Jiang C., Krausz K. W., Li Y., Albert I., Hao H., Fabre K. M., Mitchell J. B., Patterson A. D., Gonzalez F. J. 2013. Microbiome remodelling leads to inhibition of intestinal farnesoid X receptor signalling and decreased obesity. Nat. Commun. 4: 2384. [DOI] [PMC free article] [PubMed] [Google Scholar]
- 25.Barbier O., Torra I. P., Sirvent A., Claudel T., Blanquart C., Duran-Sandoval D., Kuipers F., Kosykh V., Fruchart J. C., Staels B. 2003. FXR induces the UGT2B4 enzyme in hepatocytes: a potential mechanism of negative feedback control of FXR activity. Gastroenterology. 124: 1926–1940 [DOI] [PubMed] [Google Scholar]
- 26.Barbier O., Duran-Sandoval D., Pineda-Torra I., Kosykh V., Fruchart J. C., Staels B. 2003. Peroxisome proliferator-activated receptor alpha induces hepatic expression of the human bile acid glucuronidating UDP-glucuronosyltransferase 2B4 enzyme. J. Biol. Chem. 278: 32852–32860 [DOI] [PubMed] [Google Scholar]
- 27.Lu Y., Heydel J. M., Li X., Bratton S., Lindblom T., Radominska-Pandya A. 2005. Lithocholic acid decreases expression of ugt2b7 in Caco-2 cells: a potential role for a negative farnesoid X receptor response element. Drug Metab. Dispos. 33: 937–946 [DOI] [PMC free article] [PubMed] [Google Scholar]
- 28.Erichsen T. J., Aehlen A., Ehmer U., Kalthoff S., Manns M. P., Strassburg C. P. 2010. Regulation of the human bile acid UDP-glucuronosyltransferase 1A3 by the farnesoid X receptor and bile acids. J. Hepatol. 52: 570–578 [DOI] [PubMed] [Google Scholar]
- 29.Matsubara T., Tanaka N., Sato M., Kang D. W., Krausz K. W., Flanders K. C., Ikeda K., Luecke H., Wakefield L. M., Gonzalez F. J. 2012. TGF-β-SMAD3 signaling mediates hepatic bile acid and phospholipid metabolism following lithocholic acid-induced liver injury. J. Lipid Res. 53: 2698–2707 [DOI] [PMC free article] [PubMed] [Google Scholar]
- 30.Mottino A., Tuchweber B., Plaa G. L., Yousef I. M. 2000. Role of perivenous hepatocytes in taurolithocholate-induced cholestasis in vivo. Toxicol. Lett. 116: 69–77 [DOI] [PubMed] [Google Scholar]
- 31.Kuehl G. E., Murphy S. E. 2003. N-glucuronidation of nicotine and cotinine by human liver microsomes and heterologously expressed UDP-glucuronosyltransferases. Drug Metab. Dispos. 31: 1361–1368 [DOI] [PubMed] [Google Scholar]
- 32.Modica S., Murzilli S., Salvatore L., Schmidt D. R., Moschetta A. 2008. Nuclear bile acid receptor FXR protects against intestinal tumorigenesis. Cancer Res. 68: 9589–9594 [DOI] [PubMed] [Google Scholar]
- 33.Butler L. M., Duguay Y., Millikan R. C., Sinha R., Gagne J. F., Sandler R. S., Guillemette C. 2005. Joint effects between UDP-glucuronosyltransferase 1A7 genotype and dietary carcinogen exposure on risk of colon cancer. Cancer Epidemiol. Biomarkers Prev. 14: 1626–1632 [DOI] [PubMed] [Google Scholar]
- 34.Dellinger R. W., Chen G., Blevins-Primeau A. S., Krzeminski J., Amin S., Lazarus P. 2007. Glucuronidation of PhIP and N-OH-PhIP by UDP-glucuronosyltransferase 1A10. Carcinogenesis. 28: 2412–2418 [DOI] [PubMed] [Google Scholar]
Associated Data
This section collects any data citations, data availability statements, or supplementary materials included in this article.


