

Summary
The N-terminal region of both skeletal and cardiac ryanodine receptor is a disease mutation hotspot. Recently, a crystal structure of the RyR1 fragment (residues 1-559) was solved. This N-terminal structure contains three separate domains, A, B, and C, and was docked into a central vestibule in a full-length RyR1 cryo-EM map. Here we reconstructed 3D cryo-EM structures of two GFP-tagged RyR2s with GFP inserted after residue Glu-310 and Ser-437, respectively. The structures of RyR2E310-GFP and RyR2S437-GFP displayed an extra mass on domain B and C, directly validating the predicted docking model. Next, we revealed domain movements in molecular dynamics flexible fitting models in both the closed and open state cryo-EM maps. To further probe the conformational changes, we generated FRET pairs by inserting CFP or YFP in two selected domains, FRET studies of three dual-insertion pairs and three co-expressed single-insertion pairs showed the dynamic structural changes within the N-terminal domains.
Introduction
Ryanodine receptors (RyRs) form a class of intracellular calcium release channels in various animal tissues such as muscles and neurons. They are the major cellular mediators of the release of calcium ions from the sarcoplasmic reticulum, an essential step in muscle contraction. Mutations in skeletal muscle RyR1 are associated with malignant hyperthermia and central core disease (Robinson et al., 2006; Rosenberg et al., 2007). Mutations in cardiac muscle RyR2 are linked to two genetic forms of cardiac arrhythmia: catecholaminergic polymorphic ventricular tachycardia and arrhythmogenic right ventricular cardiomyopathy (Herren et al., 2009; Liu et al., 2008).
RyR is the largest known ion channel. Due to its large molecular mass (~5,000 amino acid residues for one monomer, 2.3 MDa for the functional homo-tetramer) and as an intrinsic membrane protein, it is a difficult subject for NMR or X-ray crystallography, and there is little progress in obtaining suitable crystals of the full-length RyR protein for X-ray crystallography. Recently, crystal structures of RyR1 fragments, mainly in the N-terminal region, have been reported (Amador et al., 2009; Lobo and Van Petegem, 2009; Tung et al., 2010). The largest fragment contains residues 1-559, and approximately covers one tenth of the full-length RyR1 sequence (Tung et al., 2010). The crystal structure consists of three domains, domain A (residues 1-205), domain B (206-394), and domain C (395-532). Interestingly, the N-terminal fragment (residues 1-604) of the inositol-1,4,5-trisphosphate receptor (InsP3R), another tetrameric intracellular calcium release channel, has also been crystalized and found to comprise three domains, which are very similar to the RyR1 ABC domains (Seo et al., 2012). Docking the crystal structure of the ABC domains into a full-length RyR1 cryo-electron microscopy (cryo-EM) density map has placed the domains in the cytoplasmic portion of RyR1, forming a vestibule in the center of the cytoplasmic assembly (Tung et al., 2010). However, the docking model of ABC domains is in variance with previous docking models of the N-terminal regions of RyR1 (Baker et al., 2002; Serysheva et al., 2008), and with our previously mapped location of residues Ser-437 in RyR2 (corresponds to Ser-422 in RyR1) by cryo-EM (Wang et al., 2007). In the present study, we employed a more accurate methodology than that was used in our previous study. We constructed two full-length RyR2-Green Fluorescent Protein (GFP) chimeras in which GFP flanked with shorter linkers were inserted either after residue Glu-310 or after residue Ser-437. The cryo-EM three-dimensional (3D) structure of RyR2E310-GFP clearly showed an extra mass in domain B, while the cryo-EM 3D structure of RyR2S437-GFP distinctly displayed an extra mass next to domain C. These two 3D structures directly corroborate the docking model of the ABC domains (Tung et al., 2010).
The N-terminal region of both RyR1 and RyR2 is a hotspot of disease-causing mutations. Dozens of mutations have been identified in this region. Based on the docking model of the ABC crystal structure, most of the N-terminal mutations are located at domain-domain interfaces, and are hypothesized to disrupt domain-domain interactions and affect thereof those occur during RyR channel gating (Tung et al., 2010). Previous cryo-EM studies have indicated that the cytoplasmic domains of RyR undergo considerable conformational changes (Samso et al., 2009; Sharma et al., 2000). Kimlicka et al. have recently docked the atomic structure of the ABC domains into a cryo-EM-derived structural model of RyR1 that is putatively in an open state, which led them to propose structural differences in the disposition of the ABC domains between open and closed states of RyR1 (Kimlicka et al., 2013). To gain further insights into conformational dynamics inside N-terminal ABC domains, we fitted the crystal structure of the ABC domains in the cryo-EM density maps of RyR1 in both the closed and open states using a molecular dynamics flexible fitting (MDFF) approach. Comparison of the docking models obtained in the two conformations reveals the ABC domains movements that occur in RyR transits between closed and open states.
To provide experimental evidence for the conformational changes in the N-terminal region of the channel and to test both Kimlicka et al’s rigid body docking (Kimlicka et al., 2013) and our MDFF docking models, we generated fluorescence resonance energy transfer (FRET) pairs by inserting cyan fluorescent protein (CFP) or yellow fluorescent protein (YFP) after any two selected residues in His-29, Glu-310, and Lys-441 in the three domains A, B, and C, respectively. Conformational dynamics inside the N-terminal region were investigated using three dual-insertion pairs (RyR2H29-CFP/E310-YFP, RyR2H29-CFP/Y441-YFP, and RyR2E310-YFP/K441-CFP) as well as in three co-expression single-insertion pairs (RyR2H29-CFP/RyR2E310-YFP, RyR2H29-CFP/RyR2Y441-YFP, and RyR2E310-YFP/RyR2K441-CFP). Our results indicated that upon RyR channel activation by caffeine, domains A and B move close to each other, domains B and C move apart, whereas distance between domains A and C is largely unchanged within one subunit of RyR. Regarding inter-subunit dynamics, our data reveal that domain A moves away from both domains B and C in the neighboring subunits; meanwhile the distance between domains B and C from two neighboring subunits remains unchanged. In support of the docking models, we found that most of the residue-residue distance changes observed by FRET are consistent with those predicted from the docking models.
Results
3D Reconstructions of RyR2E310-GFP and RyR2S437-GFP
In 2002, we devised a method to map the surface-exposed residues in the full-length RyR2 (Liu et al., 2002). Briefly, we genetically tagged the residue of interest with a GFP, and identified the GFP location as an extra mass in the density map derived from cryo-EM. Proteins of the size of GFP (molecular mass 28 kDa) are easily visualized and mapped by image processing, even at an intermediate resolution (20–30Å). To minimize potential disruptive effects of the GFP insertion on the folding of both GFP and RyR2, two Gly-rich spacers (10-residues and 9-residues) flanked the inserted GFP (Kratz et al., 1999). In the current work, we have removed 5 residues from the Gly-rich linkers in the original design, and thus the cDNAs of RyR2E310-GFP and RyR2S437-GFP were constructed, in which the entire GFP sequence flanked with shorter Gly-rich linkers (5-residues and 4-residues on each side) were inserted after Glu-310 and Ser-437, respectively (Figure S1). The shorter linkers should result in a more accurate 3D localization of GFP due to the reduced extendibility and flexibility from the linkers. The residue Glu-310 in mouse RyR2 corresponds to Glu-295 in rabbit RyR1, which, according to the published docked crystal structure (Tung et al., 2010), should be located in a loop between two β-strands in domain B. The residue Ser-437, which was picked in our previous study by analyzing the hydrophilicity of the RyR2 primary structure (Liu et al., 2002), corresponds to Ser-422 in a loop of RyR1 between two α-helices in domain C (Figure S1). We used RyR2-GFPs instead of RyR1-GFPs for structure determination due to the lower expression levels of the cDNA of RyR1-fluorescent protein (GFP, CFP, and YFP) constructs in HEK293 cells compared to RyR2-fluorescent proteins. Since the three RyR isoforms (RyR1, RyR2, and RyR3) share a high degree of sequence identity (~70%), the intact RyR structures determined by cryo-EM (Radermacher et al., 1994; Sharma et al., 2000; Sharma et al., 1998) and fragment structures determined by X-ray crystallography (Lobo and Van Petegem, 2009) are essentially the same for all isoforms. Therefore structural information obtained from RyR2 should be applicable to the other two RyR isoforms.
To ensure that the insertion of GFP does not grossly alter the structure and function of RyR2, we determined the response of RyR2E310-GFP and RyR2S437-GFP to caffeine. As shown in Figure S2A, S2C and S2D, HEK293 cells transfected with RyR2S437-GFP showed a caffeine response pattern similar to that of HEK293 cells transfected with wild type RyR2. In order to obtain stable RyR2E310-GFP construct, we inserted GFP after E310 in RyR2 cDNA harboring a reduced activity mutation A4860G (Jiang et al., 2007). We have previously found that the A4860G mutation, located in the inner pore helix of RyR2, results in a more structurally homogeneous cryo-EM preparation than wild type RyR2, thus we have used RyR2A4860G as a RyR2 background in several cryo-EM studies (Meng et al., 2007; Wang et al., 2011). RyR2E310-GFP exhibited caffeine induced Ca2+-release but with significantly reduced response compared to the wild type RyR2 (Figure S2B and S2D). This reduced caffeine response is attributed to the A4860G mutation, which was characterized in a previously study (Wang et al., 2004). Thus, both RyR2E310-GFP and RyR2S437-GFP form functional calcium release channels.
To directly validate the docking position of the RyR1 ABC domains’ crystal structure in the cryo-EM density map, we determined 3D reconstructions for both RyR2E310-GFP and RyR2S437-GFP from thousands of single particles that were recorded by cryo-EM (Figure S3). Since we used full-length RyR2-GFP chimeras, each reconstructed RyR2-GFP construct should result in an additional peripheral domain at the location of the insertion site. As shown in Figure 1, a 3D reconstruction of RyR2E310-GFP clearly showed an extra mass in the domain B, while for RyR2S437-GFP, an extra mass distinctly appeared in the domain C. Comparison with the previous 3D structure of control RyR2 (without GFP insertion (Meng et al., 2007)) showed no other significant density differences in both the RyR2E310-GFP and RyR2S437-GFP 3D reconstructions. Thus, these 3D reconstructions confirm the location of the ABC domains predicted by docking analysis.
Figure 1. 3D localization of E310-GFP and S437-GFP.
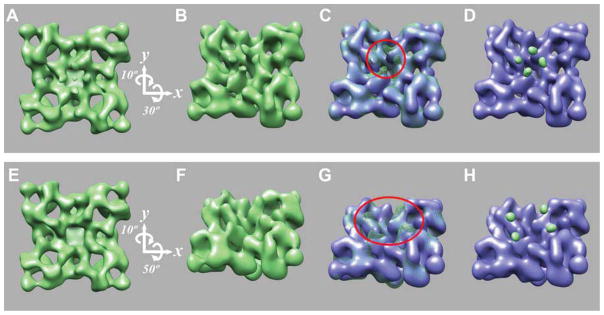
A and E, surface representations of 3D reconstruction of RyR2E310-GFP and RyR2S437-GFP, respectively, shown in a top view (cytoplasmic, t-tubule facing side). B and F, in a tilted view. C and G, 3D reconstructions of RyR2E310-GFP and RyR2S437-GFP shown in green mesh and superimposed on the 3D reconstruction of control RyR2 (without GFP insertion, shown in blue), with the most noticeable extra masses highlighted by red circles. D and H, 3D difference maps (RyR2E310-GFP – control RyR2 and RyR2S437-GFP – control RyR2) corresponding to the inserted GFP are shown in green and superimposed on the 3D reconstruction of control RyR2 (blue).
Conformational dynamics in the ABC domains revealed by docking the crystal structure into the closed and open state cryo-EM density maps
Previous cryo-EM studies have revealed that the cytoplasmic domains of RyR undergo a global conformational change (Samso et al., 2009; Sharma et al., 2000). To gain further insights, we fitted the crystal structure of the ABC domains (PDB access code 2XOA) into RyR1 cryo-EM density maps of both closed (EMDB access code 1606) and open (EMDB 1607) states (Samso et al., 2009) by using a molecular dynamics flexible fitting approach. The starting model was built by docking the ABC atomic structure as a rigid body into the cryo-EM density maps using the program Situs (Wriggers, 2010). The docking position in the closed conformation is identical to the original published data (Tung et al., 2010). The program MDFF was employed for automatically and simultaneously refining the fitting of the atomic structure into the cryo-EM density maps, the stereochemical properties and the secondary structure elements in the atomic models are maintained through restraints (Trabuco et al., 2008). In MDFF, the initial rigid body atomic structure is simulated by using molecular dynamics, with the cryo-EM density map as a guiding potential in addition to the standard force field. From this potential, forces proportional to the gradient of the cryo-EM density map are applied to drive atoms into high-density regions of the map, resulting in a new structure that represents a functional conformation that was captured by the cryo-EM experimental data (Trabuco et al., 2008). The resulting flexibly fitted atomic structure reveals additional individual domain movements compared to the rigid body docking model (See Movie 1 in the Supplemental Data). The MDFF protocol was optimized to achieve the best cross-correlation coefficient and to minimize over-fitting. The optimization of the MDFF protocol is shown in Figure S4, the parameters we have tested included the numbers of dynamics and minimization steps (see Table S1 for detail). Protocols #6 and #5 utilized the minimal number of steps to provide an optimal fit of the ABC domains structure to the closed and open state RyR1 cryo-EM density maps, respectively. The cross-correlation coefficients were improved from 0.89 to 0.93 by MDFF optimization for the closed conformation; and improved from 0.88 to 0.93 for the open conformation density map, indicating better fittings for both closed and open state conformations.
To probe the conformational dynamics inside N-terminal region, we compared the structural changes of ABC domains when RyR1 transits from the closed to the open state. In agreement with the recent report by Kimlicka et al. (2013), we found that when RyR1 changes its conformation from the closed to the open state, the ABC domains in each RyR1 monomer moved toward the corners of the tetrameric structure, e.g. ABC domains in one RyR1 subunit moved away from the other three subunits. Movie 2 in the Supplemental Data depicts the conformational transitions of this simulated process.
To further explore the conformational dynamics of ABC domains within one subunit of RyR1, we next performed a close visual examination of the ABC domains movements inside one RyR1 subunit in both the closed and open state cryo-EM density maps. It appears that domains A and B move closer to each other, whereas the distances between domains A and C and between domains B and C remain relatively the same (see movements of domains in cryo-EM density maps in Figure 2 and movement of ABC crystal structure in docking models in Supplemental Movie 3).
Figure 2. A close-up view of ABC domain movements inside one RyR1 subunit.
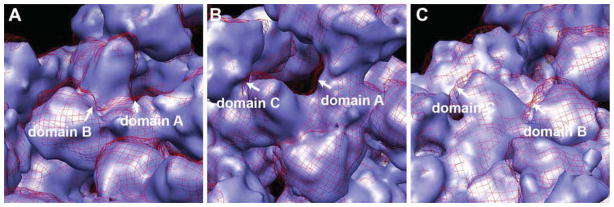
A, A zoomed tilted view of RyR1 in closed conformation (blue surface) and open conformation (red mesh), domains A and B move close to each other. B, Domains A and C move toward the same direction, and no change in the relative distance. C, Domains B and C also move in the same direction with no change in the relative distance.
Conformational dynamics in the ABC domains revealed by FRET analysis
Thus far, our docking analysis of the ABC domains in closed and open states has yielded predictions that largely agree with those discussed recently (Kimlicka et al., 2013; Tung et al., 2010). Our MDFF docking models reveal the domain movements of ABC domains inside one RyR1 subunit and between neighboring subunits. Next, we sought to further probe the conformational dynamics inside the central vestibule and to directly test the domain movements suggested by our docking models. We generated several CFP-YFP FRET pairs by selecting an insertion site in each of the three domains, A, B, and C. The FRET signals is measured and used to identify interactions between the labeled structural domains. The efficiency of this energy transfer is inversely proportional to the sixth power of the distance between donor and acceptor making FRET extremely sensitive to small distance change (Valeur, 2001). By monitoring the FRET signal change, we can characterize the movement between two domains bearing the donor and acceptor of the FRET pair.
We selected the fluorescent protein insertion sites by the following criteria: first, the residue must be in a loop that faces the top (solvent-facing surface) of each domain, and thus the inserted CFP or YFP will be on top of the domain so that it will not disrupt the overall structure of RyR; second, the two residues should be sufficiently separated so that the inserted CFP and YFP are not physically contacted each other. Residue His-29 in RyR2 (corresponding to Leu-29 in RyR1) is located in a loop between two β-strands in domain A. Residue Glu-310 in RyR2 (corresponds to Glu-295 in RyR1) that was selected for the cryo-EM study, is also located in a loop between two β-strands in domain B. We picked residue Lys-441 in RyR2 (corresponding to Arg-426 in RyR1) in domain C, because, according to the crystal structure, Lys-441 is in the same loop as Ser-437 (also selected for the cryo-EM study) that connects two α-helices. However, Ser-437 is the second residue from the N-terminus of the loop, whereas Lys-441 is located close to the middle of the loop. Choosing the residue close to the center is expected to reduce the possible structural disruption for both RyR2 and inserted CFP or YFP. Through selecting two out of three insertion sites, we generated three co-expressed single-insertion FRET pairs (RyR2H29-CFP/RyR2E310-YFP, RyR2H29-CFP/RyR2K441-YFP, and RyR2E310-YFP/RyR2K441-CFP, see models in Figure 3A), as well as three dual-insertion FRET pairs (RyR2H29-CFP/E310-YFP, RyR2H29-CFP/Y441-YFP, and RyR2E310-YFP/K441-CFP, see models in Figure 4A). Since the ABC domains are clustered in the central rim in the cytoplasmic assembly (Tung et al., 2010), in the 3 dual-insertion pairs, multiple FRET pairs will be formed by CFP/YFP from the same RyR subunit and by CFP/YFP from the neighboring RyR subunits (one CFP donor can forms 4 different FRET pairs with the four YFP in different RyR subunit. On the contrary, in the three co-expressed single-insertion FRET pairs, there are only three types of FRET pairs formed by CFP and YFP from neighboring RyR subunits, and two pairs have much weaker FRET than the dominant one (see models in Figure 3A).
Figure 3. Analysis of three FRET pairs obtained by co-expression of N-terminal CFP and YFP single-site insertions.

A, Structural models of FRET pairs obtained by co-expression of two RyR cDNAs expressing single-site CFP or YFP insertions. Functional RyR2 is a homo-tetramer that is composed of four subunits. We co-expressed two individual cDNAs in HEK293 cells, with one cDNA having one domain labeled with CFP only, and the other domain labeled with YFP only. When the two cDNAs are co-transfected, they form six possible hybrid RyR2 molecules. The green, blue, and red ellipses indicate predicted FRET signals from strong to weak, according to the distance between donor and acceptor measured in the docking model of the crystal structure. Numbers at bottom are the mathematical probabilities of each structure. B, Confocal images showing cyan (donor) and yellow fluorescence (acceptor) before and after photobleaching in a HEK293 cell that co-expresses RyR2H29-CFP and RyR2E310-YFP cDNA. The green ellipse demarcates the area selected for photobleaching. Scale bar, 5μm. C, FRET analysis of HEK293 cells co-expressing two single-insertion cDNAs. Changes of averaged FRET efficiency of the co-expressed RyR2H29-CFP and RyR2E310-YFP, RyR2H29-CFP and RyR2Y441-YFP, RyR2E310-YFP and RyR2K441-CFP upon treatment with RyR channel activator, caffeine. Data are mean ± s.e.m., with the number of cells indicated on the bars. **P<0.01, ***P<0.001, n.s., not significant.
Figure 4. FRET analysis of three N-terminal dual insertion FRET pairs.

A, Structural models of designed dual-insertion FRET pairs in the N-terminal region showing top views of RyR with the locations of CFP (donor) and YFP (acceptor) insertion sites. We selected three insertion sites, His-29, Glu-310, and Lys-441, which are from domains A, B, and C, respectively, and then created three FRET pairs (RyR2H29-CFP/E310-YFP, RyR2H29-CFP/Y441-YFP, and RyR2E310-YFP/K441-CFP). Blue arrows indicate FRET pairs formed by two sites within one RyR subunit, and purple arrows represent FRET pairs between different subunits. Numbers are the distance (in Å) measured in the docking model of the crystal structure. B, FRET analysis of HEK293 cells expressing three dual-insertion FRET pairs. Data shown are changes of averaged FRET efficiency of the RyR2H29-CFP/E310-YFP, RyR2H29-CFP/Y441-YFP, and RyR2E310-YFP/K441-CFP upon treatment with RyR channel activator, caffeine. Data are mean ± s.e.m., with the number of cells indicated on the bars; n.s., not significant, and **P<0.01, compared to control.
To determine whether the substituted CFP and YFP in the single insertions (RyR2H29-CFP, RyR2E310-YFP, RyR2K441-CFP, and RyR2K441-YFP), and in the dual insertions (RyR2H29-CFP/E310-YFP, RyR2H29-CFP/Y441-YFP, and RyR2E310-YFP/K441-CFP) affect RyR2 function, we measured the Ca2+ release induced by caffeine using fluo-3 AM as a Ca2+ indicator. As shown in Figure S5, HEK293 cells expressing RyR2H29-CFP, RyR2E310-YFP, RyR2K441-CFP, RyR2K441-YFP, RyR2H29-CFP/E310-YFP, RyR2H29-CFP/Y441-YFP, and RyR2E310-YFP/K441-CFP responded to caffeine in a similar manner compare to the wild type (n=3–5). Therefore, these CFP-or YFP-tagged RyR2s also form functional calcium release channels.
We then examined the live HEK293 cells transfected with various CFP- or YFP-tagged RyR2s by confocal microscopy (Figure 3B), and monitored the change in FRET signals in the cells upon activation of RyR2 channels by caffeine. As shown in Figure 3C, in the cells that co-expressed single insertion FRET pairs, FRET efficiency decreased in RyR2H29-CFP/RyR2E310-YFP (domains A/B) and RyR2H29-CFP/RyR2Y441-YFP (domains A/C), but scarcely changed in the RyR2E310-YFP/RyR2K441-CFP (domains B/C). As represented in Figure 4B, in the cells transfected with a dual insertion FRET pair, FRET efficiency was largely unchanged in RyR2H29-CFP/E310-YFP (domains A/B) and RyR2H29-CFP/Y441-YFP (domains A/C), whereas FRET efficiency decreased in RyR2E310-YFP/K441-CFP (domains B/C).
A straightforward interpretation of the observed FRET efficiency changes between donor and acceptor is that a decrease in FRET efficiency indicates that the donor and acceptor are moving apart; oppositely, an increase in FRET efficiency means that the donor and acceptor are moving closer to each other. As shown in Figure 3A, there are six probable hybrid RyR2 molecules when two cDNAs are co-expressed, in which one cDNA includes CFP only as the donor, and the other has YFP only as the acceptor. In the cells that co-expressed RyR2H29-CFP and RyR2E310-YFP (top panel), RyR2H29-CFP and RyR2K441-YFP (middle panel), or RyR2E310-YFP and RyR2K441-CFP (lower panel), there are three types of FRET pairs, all arising from FRET across subunit-subunit boundaries (e.g. inter-subunit FRET). As shown in the structural model of Figure 3A, for illustrative purpose, we colored the three FRET pair types in green, blue, and red, corresponding to the distances between donor and acceptor ranging from short to long, and thus FRET signals from strong to weak. In theory, FRET efficiency mainly depends on the donor-to-acceptor separation distance, with an inverse 6th power law due to the dipole-dipole coupling mechanism (Valeur, 2001). The FRET efficiency also depends on the relative orientation of the donor emission dipole moment and the acceptor absorption dipole moment, but, in most cases, even modest reorientation of donor and acceptor molecules does not result in a large error in the estimated energy transfer distance (Sezgin and Schwille, 2011). Moreover, fluorescent proteins (CFP and YFP) do not reorient on a timescale that is faster than their fluorescence lifetime (Sezgin and Schwille, 2011). We neglected the FRET efficiency change caused by the donor and acceptor orientations and attribute it to the distance change between the donor and acceptor. In Figure 3A, the FRET signals from FRET pairs depicted in blue and red are dramatically lower than the FRET signal from the green FRET pair (For inter-subunit domains A and B, the FRET efficiency ratio between green, blue, and red pairs is roughly 3000:8:5). The FRET pairs highlighted with green ellipses will be the primary contributors to the observed FRET in Figure 3C. In addition, considering that RyR2 is a homo-tetramer, and all four subunits move in a coordinate manner, the reduced FRET efficiency with caffeine simulation that we detected in cells co-expressing RyR2H29-CFP and RyR2E310-YFP, or RyR2H29-CFP and RyR2K441-YFP indicates that domain A is moving apart from both domains B and C. Meanwhile, no significant change in FRET efficiency was observed in cells co-expressing RyR2E310-YFP and RyR2K441-CFP, indicating that the distance between domains B and C from neighboring subunits remains unchanged upon caffeine stimulation.
Results from FRET pairs formed in the dual-insertion RyR2s are complicated because the ABC domains cluster around the central vestibule so closely, such that, in addition to the FRET pair formed by donor and acceptor inside the same subunit of RyR2 (intra-subunit FRET), there are also FRET pairs formed by donors and acceptors from different subunits (inter-subunit FRET, see models in Figure 4A). In both RyR2H29-CFP/Y441-YFP (domains A/C) and RyR2E310-YFP/K441-CFP (domains B/C), the intra-subunit FRET pair should dominate over the inter-subunit pairs for which the separation between donor and acceptor is large (60–103Å). No significant changes in FRET efficiency were measured for cells co-expressing RyR2H29-CFP/Y441-YFP, which indicates the distance between domain A and C within one subunit is roughly unchanged. A significant decrease in FRET efficiency was detected for RyR2E310-YFP/K441-CFP, indicating that domains B and C move apart upon activation of RyR2. However, in the dual insertion pair RyR2H29-CFP/E310-YFP (domains A/B), one pair out of the three inter-subunit FRET pairs is a source of significant FRET efficiency, since its inter-fluorophore distance (22Å) is comparable with that for the intra-subunit FRET pair (33 Å, see left panel in Fig. 4A). Bearing in mind that the inter-subunit FRET efficiency for domains A and B decreased according to the results obtained with co-expressed RyR2H29-CFP and RyR2E310-YFP (Figure 3C), to make no significant changes in the apparent FRET efficiency in the cells, the intra-subunit FRET efficiency must be increased, e.g. domains A and B move closer in the same subunit.
In summary, our FRET results demonstrate that upon RyR channel activation by caffeine, within each subunit domain A and B move close to each other, whereas the distance between domains A and C is largely unchanged. These two observations are consistent with the domain movements predicted from the docking models. However, domains B and C move apart as revealed by FRET, but the docking model predicted no change. For domain-domain interactions occurring between adjacent subunits, domains A moves away from both domains B and C, which are also consistent with the docking models. However, the distance between domains B and C is largely unchanged according to FRET, but it was predicted to increase by the docking model.
Subsequently, we used the docking models (both rigid body docking and molecular dynamics flexible fitting) to measure the changes in distance between the residues that were selected for the FRET study (Figure 5). The most obvious predicted changes are the inter-subunit ones, since the ABC domains in each subunit move to the respective corners of the RyR tetramer, and so all the distances between donor and acceptor residues are predicted to increase, and therefore result in a decrease in FRET upon addition of caffeine (nine inter-subunit FRET pairs, three for each CFP/YFP insertion pair as indicated by green, blue and red ellipses in Figure 3A). The observed decreases in FRET associated with inter-subunit interactions involving domains A and B and between domains A and C are consistent with the docking predictions. However, no significant FRET changes were detected for domains B and C located on different subunits, indicating that the conformational dynamics are more complex than predicted from the modeling.
Figure 5. Molecular dynamics flexible fitting of the crystal structure of ABC domains into closed and open state of RyR1 cryo-EM density maps.
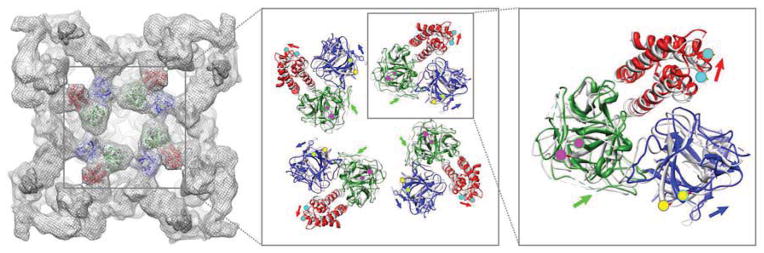
Crystal structure of RyR1 N-terminal ABC domains was docked into closed and open state of RyR1 cryo-EM density maps using MDFF method to flex the atomic structure into the two density maps of RyR1 in different conformations. The flexible docking model of the ABC domains in the closed state RyR1 cryo-EM density map (grey mesh in the background) is shown in the left panel. Two flexible docking models of ABC domains are overlaid in the middle and the right panels in which the docking model in the closed state is shown in grey, and the model in the open state is shown in color (domain A, blue; B, green; and C, red). The three residues selected for FRET studies are highlighted with color dots (His-29, yellow; Glu-295, magenta; and Arg-426, cyan). In the zoomed view in the middle and right panel, color dots outlined by grey circles represent residues in the closed state conformation, and color dots outlined by color circles are residues in the open state, color arrows are indicated the direction of movements of each residues from the closed state to the open state.
In contrast, based upon the docking models, distance changes between the closed and open states of donor and acceptor residues for all three intra-subunit FRET pairs (domains A/B, A/C, and B/C in the same subunit) are subtle: the movements are less than 2Å in molecular dynamics flexible fitting, so they are considered insignificant (distance changes involving the three intra-subunit FRET pairs that are predicted by molecular dynamics flexible fitting can be perceived in the close-up view in the right panel of Figure 5). Thus, the predicted conformational dynamics between domains A and C within the same subunit are consistent with the FRET analysis which showed no significant change in FRET (Figure 4B). Also, no significant change in FRET was observed for domains A and B, again in agreement with the docking results, but, as remarked above and indicated in Figure 4A (left panel), FRET from this pair is predicted to have a large contribution from energy transfer to an adjacent subunit in addition to the intra-subunit contribution to the net FRET. A small but significant decrease in FRET was observed for domains B and C indicative of subtle intra-subunit conformational changes that were not predicted by the docking methods (see Figure 6 for summary).
Figure 6. Movements of N-terminal ABC domains when RyR switches from closed to open conformation as determined by direct visualization, rigid body docking, molecular dynamics flexible fitting, or FRET analysis.

In both the rigid body docking and MDFF docking models, distances between two inter-subunit domains or intra-subunit domains in the closed and open state were directly measured from the selected residues (H29 in domain A, E310 in domain B, and K441 in domain C) in UCSF Chimera. For direct visualization, relative domain movements were measured in the closed and open state cryo-EM density maps, using two points on the domain surface close to the selected residues. For FRET analysis, we used the distance between two selected residues in the closed state conformation as the reference, the distance between the residues in the open state was then calculated base on the changes in FRET efficiencies.
Discussion
In this study, we have refined our GFP insertion protocol for cryo-EM mapping of residues in the 3D structure of RyR. GFP is widely used as a genetic reporter in cell and molecular biology. Here we use it both as a structural maker for 3D cryo-EM and as a sensitive probe for FRET characterization of conformational dynamics. Kratz and colleagues first inserted the entire sequence of GFP into a hepatitis B virus core protein, and examined the chimeric virus particles by cryo-EM (Kratz et al., 1999). Later, Charpilienne et al. used GFP as model inserts in the capsid protein in rotaviruses, and also as subjects for structure determination by cryo-EM (Charpilienne et al., 2001). Chevalier et al. also used GFP fused to C-terminal domain of VP3 protein in the infectious bursal disease virus and visualized the protein by negatively stained electron microscopy (Chevalier et al., 2002). In 2002, we explored the utility of inserting GFP into RyR, and mapped one of the divergent regions of RyR by localizing the GFP in a 3D structure determined by cryo-EM (Liu et al., 2002). Additionally, we have mapped a number of functionally important sites in the 3D structure of RyR by this approach, including three divergent regions, four disease-causing mutation hotspots, and two phosphorylation sites (Wagenknecht and Liu, 2010). Besides GFP, other proteins, such as outer surface lipoprotein C (OspC) and outer surface protein A (OspA) of the Lyme disease agent Borrelia burgdorferi, were inserted into core Hepatitis B virus and characterized by cryo-EM (Skamel et al., 2006; Walker et al., 2008). Both OspC (~210 aa) and OspA (256 aa) have similar molecular masses to GFP, and could in principle be used as structure markers for cryo-EM studies. In all the studies, linkers were added to GFP, OspC and OspA to provide a flexible linkage to the target proteins. For example, the overall shape of GFP is a cylinder, with the N-terminus and C-terminus located at one end of the cylinder. However, the N-terminus and C-terminus are not contiguous, being separated by about 2 nm according to the crystal structures (Ormö et al., 1996), and so a few linker residues are required just to bridge this gap. In our protocol, we followed the design from the work of Kratz et al: 10 Glycine-rich amino acids were added on the N-terminus and 9 on the C-terminus of GFP (“long linkers”). Most of our cryo-EM mappings are consistent with other studies. For instance, 3D localization of residue Tyr-2801 in the phosphorylation domain (Meng et al., 2007) matches within ~30Å of its position in docking models of crystal structure of RyR fragments (Sharma et al., 2012; Yuchi et al., 2012); 3D localization of residue Tyr-846 (Wang et al., 2011) is consistent with the docking model of N-terminal fragment (Zhu et al., 2013); 3D mapping of divergent region 2 using GFP inserted at residue Thr-1366 (Liu et al., 2004) matches precisely the localization of this region that was determined by comparing a 3D reconstructions of RyR1 with that of RyR3, which lacks this region (Sharma et al., 2000); 3D localization of Arg-626 in the FKBP-adjoining domain by combining FRET and cryo-EM (Wang et al., 2011) is consistent to the binding assay between RyR and FKBP (Girgenrath et al., 2013). However, a shortcoming of the long linkers is that in certain case they may allow GFP to move away from the target site, depending upon the environment of the site. In our previous mapping of Ser-437, the inserted GFP with long linkers was located between domain 5 and 9 (Wang et al., 2007), on the opposite side of domain 5 from where the GFP with short linker was determined in this study. The long linker GFP is roughly 60Å from the insertion site that is predicted from the docking model of RyR1 ABC domains. The offset may come from the flexibility of linkers, from the flexibility of the loop structure of RyR where the Ser-437 located, and from the cylinder shape of GFP with overall length of nearly 50Å. In this study, we refined our GFP insertion protocol by truncating the linkers by 5 residues, and we found that the centers-of-mass of the difference density for both Glu-310 and Ser-437 are roughly 30Å from the predicted insertion sites, an offset that is largely due to the shape of GFP itself. Thus, with the short linkers, we should be able to map the surface-exposed residues of RyR more precisely.
In the present study, we utilized a molecular dynamics flexible fitting method to dock the crystal structure of the N-terminal ABC domains into both closed and open states of RyR1 cryo-EM density maps. Comparison of the two docking models revealed domain movements that occur when RyR switches from the closed to the open state. Most of distance changes determined from molecular dynamics flexible fitting (e.g. inter- and intra-subunit domains A and B and domains A and C) are consistent with the FRET results. However, both inter- and intra-subunit motions involving domains B and C that are predicted by the modeling do not agree with the FRET data: in the flexible fitting models, inter-subunit domains B and C move apart and the distance between domains B and C inside the same subunit shows no significant change; based upon FRET data, there is no significant change in the distance between domains B and C in two adjacent subunit and domains B and C move apart inside one subunit (Figure 6). The difference could have two explanations. First, the molecular dynamics flexible fitting models were built in cryo-EM density maps of RyR1, whereas the FRET analysis was performed in RyR2. Although both RyR isoforms have similar 3D structures (Radermacher et al., 1994; Sharma et al., 1998), there could be an isoform-specific conformational dynamics as well as some isoform specific structural features (Lobo and Van Petegem, 2009). Unfortunately, the resolution of the available RyR2 3D maps is much poorer than that of the best RyR1 maps, and cDNA of RyR1-fluorescent protein (GFP, CFP, and YFP) constructs do not express well in HEK293 cells as RyR2-fluorescent proteins do. Second, the conformational dynamics revealed by FRET analysis and flexible fitting are slightly different: the flexible fitting provides a direct estimate of the distance changes between the two selected residues, whereas FRET yields the distance change between donor and acceptor molecules, CFP and YFP, that are inserted at the selected residues. The distance change reflected by the two methods will likely differ, but the FRET experimental data should be useful for detecting dynamic regions within RyR and the qualitative nature of the dynamics, that is, whether two regions are moving away or towards one another.
In the docking model of ABC domains, the interface between inter-subunit domains A and B contains a cluster of a dozen of disease-causing mutations (Tung et al., 2010). On the basis of the mutations’ location at this interface, Tung et al. proposed a model in which movement of ABC domains is coupled with RyR channel gating, and inter-subunit interfaces, such as that involving domains A and B, and that bear mutations, are prone to gating-inducing movements (Tung et al., 2010). In this study, we have directly detected movement between inter-subunit domains A and B by FRET analysis, by molecular modeling, and by visualization of cryo-EM maps, supporting the proposed model of Tung et al (2010).
In summary, we have refined our GFP insertion protocol for more precisely mapping residues in the 3D structure of RyR. Our cryo-EM structures of E310-GFP and S437-GFP directly validate the predicted docking model using the crystal structure of the RyR ABC fragment. Our FRET analysis and molecular dynamics flexible docking model have begun to provide insight into the intra- and inter-subunit conformational dynamics within the N-terminal ABC domains that are coupled to gating of the RyR’s ion channel.
Experimental Procedures
Construction of GFP-, CFP-, or YFP-tagged RyR2s
The cloning and construction of the 15-kb full-length cDNA encoding the mouse RyR2 has been described previously (NCBI reference sequence NP_076357.2, GI:124430578) (Zhao et al., 1999). The cDNA encoding GFP, YFP, or CFP flanked by Gly-rich linkers and an AscI site was obtained by PCR as described previously (Liu et al., 2002). The AscI site was introduced into a cDNA fragment of RyR2 after specific a residue (H29, E310, S437, or K441) by overlap extension using PCR. The fragment with AscI site was subcloned into the full-length RyR2 cDNA. The AscI-AscI fragment containing GFP, YFP, or CFP and the linkers were then subcloned into the full-length RyR2 at the introduced AscI site. The sequences of all PCR fragments and the orientation of the inserted GFP, YFP, or CFP cDNA were verified by DNA sequencing analysis.
Cryo-EM and Image Processing
The expression and purification of RyR2E310-GFP and RyR2S437-GFP were carried out as described previously (Liu et al., 2002). Cryo-EM grids were prepared by an FEI Vitrobot computer-controlled freeze-plunging instrument (FEI Company, Hillsboro, OR), and examined in an FEI Tecnai F20 field emission gun transmission electron microscope operated at 200 kV, equipped with an Oxford CT3500 cryo-transfer holder (Gatan, Inc., Warrendale, PA). Images were recorded on a 4k×4k 16-bit TIETZ 415 CCD camera with a physical pixel size of 15μm (TVIPS, Gauting, Germany). Each exposure corresponded to an electron dose of ~20 e-/Å2 by using low-dose procedures. The microscope is operated at a nominal magnification of 50,000×, and the effective magnification on the CCD is 89,000× due to a post-magnification ratio of 1.78. To obtain sufficient orientation sampling of RyR molecules, we tilted the grids between 0° and 50° during data collection. Images were processed using the SPIDER/WEB software package, and 3D reconstructions were obtained through use of a projection matching procedure. The final 3D reconstructions of RyR2E310-GFP and RyR2S437-GFP were computed from 9,295 and 9,226 particles, respectively. The final resolution of both reconstructions was estimated to be 28Å, as determined by Fourier shell correlation with a cut-off value of 0.5. The difference maps were calculated by subtracting the 3D volume of RyR2 control (without GFP insertion) from 3D volumes of the RyR2E310-GFP and RyR2S437-GFP.
Molecular dynamics flexible docking
First, we docked the crystal structure of N-terminal ABC domain (PDB code 2XOA) as a rigid body into both the closed (EMDB ID 1606) and the open state (EMDB ID 1607) RyR1 cryo-EM maps by using FFT-accelerated 6D exhaustive search tool, as implemented in the colores program from the Situs package with Laplacian filter applied (Wriggers, 2010). It generated four best positions in the four-fold symmetrized cryo-EM map identical to the center regions as shown by Tung et al (2010). Next, we flexibly fitted the original docking results into those corresponding density maps segmented from the entire 3D models for both states using Molecular Dynamics Flexible Fitting (MDFF) (Trabuco et al., 2008; Zhu et al., 2013). We tried seven different MDFF protocols with increasing simulation steps and varying energy minimization steps to not only reach convergence but also avoid over-fitting. We set the scaling factor to 0.3 for the first 200 minimization steps, and changed it to 1.0 for the subsequent minimization steps. To evaluate the flexible fitting results, we calculated the cross-correlation coefficient between the segmented density map and a simulated map created from each frame of the MDFF trajectory for each protocol. The cross-correlation coefficient plateaued at protocol #6 for the closed state density map and protocol #5 for the open state density map, respectively (see Figure S4 for the optimization of MDFF protocols, and Table S1 for details on parameter for each protocol).
FRET Measurements
HEK293 cell culture, cDNA transfection, and FRET measurement were performed as described previously (Liu et al., 2010). We utilized the acceptor photobleaching approach to detect and measure FRET signals in the live cells. The FRET efficiency was calculated according to the equation: , where Idonor-pre and Idonor-post are the respective background-corrected donor fluorescence intensities before and after photobleaching of the acceptor fluorescence. Donor-to-acceptor separation distance was estimated by equation , where R0 is the Förster distance of the FRET pair, i.e. the distance at which the energy transfer efficiency is 50%.
Supplementary Material
Highlights.
Two cryo-EM 3D reconstructions validate the docking model of RyR N-terminal domains
Docking models in the closed and open states predict N-terminal domain movements
FRET analysis reveals dynamic conformational changes within RyR N-terminal domains
Acknowledgments
This work was supported by National Institutes of Health grants R01HL095541 to Z.L., R01AR040615 to T.W, and R01HL075210 to S.R.W.C, and by grants to S.R.W.C from the Canadian Institutes of Health Research (CIHR) and Heart and Stroke Foundation of Canada (HSFC). We gratefully acknowledge the 3D-EM and Advanced Light Microscopy and Image Analysis Core Facilities at the Wadsworth Center.
Footnotes
Publisher's Disclaimer: This is a PDF file of an unedited manuscript that has been accepted for publication. As a service to our customers we are providing this early version of the manuscript. The manuscript will undergo copyediting, typesetting, and review of the resulting proof before it is published in its final citable form. Please note that during the production process errors may be discovered which could affect the content, and all legal disclaimers that apply to the journal pertain.
References
- Amador FJ, Liu S, Ishiyama N, Plevin MJ, Wilson A, MacLennan DH, Ikura M. Crystal structure of type I ryanodine receptor amino-terminal β-trefoil domain reveals a disease-associated mutation “hot spot” loop. Proc Natl Acad Sci USA. 2009;106:11040–11044. doi: 10.1073/pnas.0905186106. [DOI] [PMC free article] [PubMed] [Google Scholar]
- Baker ML, Serysheva II, Sencer S, Wu Y, Ludtke SJ, Jiang W, Hamilton SL, Chiu W. The skeletal muscle Ca2+ release channel has an oxidoreductase-like domain. Proc Natl Acad Sci USA. 2002;99:12155–12160. doi: 10.1073/pnas.182058899. [DOI] [PMC free article] [PubMed] [Google Scholar]
- Charpilienne A, Nejmeddine M, Berois M, Parez N, Neumann E, Hewat E, Trugnan G, Cohen J. Individual rotavirus-like particles containing 120 molecules of fluorescent protein are visible in living cells. J Biol Chem. 2001;276:29361–29367. doi: 10.1074/jbc.M101935200. [DOI] [PubMed] [Google Scholar]
- Chevalier C, Lepault J, Erk I, Da Costa B, Delmas B. The maturation process of pVP2 requires assembly of infectious bursal disease virus capsids. J Virol. 2002;76:2384–2392. doi: 10.1128/jvi.76.5.2384-2392.2002. [DOI] [PMC free article] [PubMed] [Google Scholar]
- Girgenrath T, Mahalingam M, Svensson B, Nitu FR, Cornea RL, Fessenden JD. N-terminal and central segments of the type 1 ryanodine receptor mediate its interaction with FK506-binding proteins. J Biol Chem. 2013;288:16073–16084. doi: 10.1074/jbc.M113.463299. [DOI] [PMC free article] [PubMed] [Google Scholar]
- Herren T, Gerber P, Duru F. Arrhythmogenic right ventricular cardiomyopathy/dysplasia: a not so rare “disease of the desmosome” with multiple clinical presentations. Clin Res Cardiol. 2009;98:141–158. doi: 10.1007/s00392-009-0751-4. [DOI] [PubMed] [Google Scholar]
- Jiang D, Chen W, Wang R, Zhang L, Chen SRW. Loss of luminal Ca2+ activation in the cardiac ryanodine receptor is associated with ventricular fibrillation and sudden death. Proc Natl Acad Sci USA. 2007;104:18309–18314. doi: 10.1073/pnas.0706573104. [DOI] [PMC free article] [PubMed] [Google Scholar]
- Kimlicka L, Lau K, Tung C-C, Van Petegem F. Disease mutations in the ryanodine receptor N-terminal region couple to a mobile intersubunit interface. Nat Commun. 2013;4:1506. doi: 10.1038/ncomms2501. [DOI] [PMC free article] [PubMed] [Google Scholar]
- Kratz PA, Böttcher B, Nassal M. Native display of complete foreign protein domains on the surface of hepatitis B virus capsids. Proc Natl Acad Sci USA. 1999;96:1915–1920. doi: 10.1073/pnas.96.5.1915. [DOI] [PMC free article] [PubMed] [Google Scholar]
- Liu N, Ruan Y, Priori SG. Catecholaminergic polymorphic ventricular tachycardia. Prog Cardiovasc Dis. 2008;51:23–30. doi: 10.1016/j.pcad.2007.10.005. [DOI] [PubMed] [Google Scholar]
- Liu Z, Wang R, Tian X, Zhong X, Gangopadhyay J, Cole R, Ikemoto N, Chen SRW, Wagenknecht T. Dynamic, inter-subunit interactions between the N-terminal and central mutation regions of cardiac ryanodine receptor. J Cell Sci. 2010;123:1775–1784. doi: 10.1242/jcs.064071. [DOI] [PMC free article] [PubMed] [Google Scholar]
- Liu Z, Zhang J, Li P, Chen SRW, Wagenknecht T. Three-dimensional reconstruction of the recombinant type 2 ryanodine receptor and localization of its divergent region 1. J Biol Chem. 2002;277:46712–46719. doi: 10.1074/jbc.M208124200. [DOI] [PubMed] [Google Scholar]
- Liu Z, Zhang J, Wang R, Wayne Chen SR, Wagenknecht T. Location of Divergent Region 2 on the Three-dimensional Structure of Cardiac Muscle Ryanodine Receptor/Calcium Release Channel. Journal of Molecular Biology. 2004;338:533–545. doi: 10.1016/j.jmb.2004.03.011. [DOI] [PubMed] [Google Scholar]
- Lobo PA, Van Petegem F. Crystal structures of the N-terminal domains of cardiac and skeletal muscle ryanodine receptors: insights into disease mutations. Structure. 2009;17:1505–1514. doi: 10.1016/j.str.2009.08.016. [DOI] [PubMed] [Google Scholar]
- Meng X, Xiao B, Cai S, Huang X, Li F, Bolstad J, Trujillo R, Airey J, Chen SRW, Wagenknecht T, et al. Three-dimensional localization of serine 2808, a phosphorylation site in cardiac ryanodine receptor. J Biol Chem. 2007;282:25929–25939. doi: 10.1074/jbc.M704474200. [DOI] [PMC free article] [PubMed] [Google Scholar]
- Ormö M, Cubitt AB, Kallio K, Gross LA, Tsien RY, Remington SJ. Crystal structure of the aequorea victoria green fluorescent protein. Science. 1996;273:1392–1395. doi: 10.1126/science.273.5280.1392. [DOI] [PubMed] [Google Scholar]
- Radermacher M, Rao V, Grassucci R, Frank J, Timerman AP, Fleischer S, Wagenknecht T. Cryo-electron microscopy and three-dimensional reconstruction of the calcium release channel/ryanodine receptor from skeletal muscle. J Cell Biol. 1994;127:411–423. doi: 10.1083/jcb.127.2.411. [DOI] [PMC free article] [PubMed] [Google Scholar]
- Robinson R, Carpenter D, Shaw M-A, Halsall J, Hopkins P. Mutations in RYR1 in malignant hyperthermia and central core disease. Hum Mutat. 2006;27:977–989. doi: 10.1002/humu.20356. [DOI] [PubMed] [Google Scholar]
- Rosenberg H, Davis M, James D, Pollock N, Stowell K. Malignant hyperthermia. Orphanet J Rare Dis. 2007;2:21. doi: 10.1186/1750-1172-2-21. [DOI] [PMC free article] [PubMed] [Google Scholar]
- Samso M, Feng W, Pessah IN, Allen PD. Coordinated movement of cytoplasmic and transmembrane domains of RyR1 upon gating. PLoS Biol. 2009;7:e1000085. doi: 10.1371/journal.pbio.1000085. [DOI] [PMC free article] [PubMed] [Google Scholar]
- Seo MD, Velamakanni S, Ishiyama N, Stathopulos PB, Rossi AM, Khan SA, Dale P, Li C, Ames JB, Ikura M, et al. Structural and functional conservation of key domains in InsP3 and ryanodine receptors. Nature. 2012;483:108–112. doi: 10.1038/nature10751. [DOI] [PMC free article] [PubMed] [Google Scholar]
- Serysheva II, Ludtke SJ, Baker ML, Cong Y, Topf M, Eramian D, Sali A, Hamilton SL, Chiu W. Subnanometer-resolution electron cryomicroscopy-based domain models for the cytoplasmic region of skeletal muscle RyR channel. Proc Natl Acad Sci USA. 2008;105:9610–9615. doi: 10.1073/pnas.0803189105. [DOI] [PMC free article] [PubMed] [Google Scholar]
- Sezgin E, Schwille P. Fluorescence techniques to study lipid dynamics. Cold Spring Harb Perspect Biol. 2011;3:a009803. doi: 10.1101/cshperspect.a009803. [DOI] [PMC free article] [PubMed] [Google Scholar]
- Sharma MR, Jeyakumar LH, Fleischer S, Wagenknecht T. Three-dimensional structure of ryanodine receptor isoform three in two conformational states as visualized by cryo-electron microscopy. J Biol Chem. 2000;275:9485–9491. doi: 10.1074/jbc.275.13.9485. [DOI] [PubMed] [Google Scholar]
- Sharma MR, Penczek P, Grassucci R, Xin H-B, Fleischer S, Wagenknecht T. Cryoelectron microscopy and image analysis of the cardiac ryanodine receptor. J Biol Chem. 1998;273:18429–18434. doi: 10.1074/jbc.273.29.18429. [DOI] [PubMed] [Google Scholar]
- Sharma P, Ishiyama N, Nair U, Li W, Dong A, Miyake T, Wilson A, Ryan T, MacLennan DH, Kislinger T, et al. Structural determination of the phosphorylation domain of the ryanodine receptor. FEBS Journal. 2012;279:3952–3964. doi: 10.1111/j.1742-4658.2012.08755.x. [DOI] [PMC free article] [PubMed] [Google Scholar]
- Skamel C, Ploss M, Bottcher B, Stehle T, Wallich R, Simon MM, Nassal M. Hepatitis B virus capsid-like particles can display the complete, dimeric outer surface protein C and stimulate production of protective antibody responses against borrelia burgdorferi infection. J Biol Chem. 2006;281:17474–17481. doi: 10.1074/jbc.M513571200. [DOI] [PubMed] [Google Scholar]
- Trabuco LG, Villa E, Mitra K, Frank J, Schulten K. Flexible fitting of atomic structures into electron microscopy maps using molecular dynamics. Structure. 2008;16:673–683. doi: 10.1016/j.str.2008.03.005. [DOI] [PMC free article] [PubMed] [Google Scholar]
- Tung CC, Lobo PA, Kimlicka L, Van Petegem F. The amino-terminal disease hotspot of ryanodine receptors forms a cytoplasmic vestibule. Nature. 2010;468:585–588. doi: 10.1038/nature09471. [DOI] [PubMed] [Google Scholar]
- Valeur B. Molecular Fluorescence: Principles and Applications. Weinheim, FRG: Wiley-VCH Verlag GmbH; 2001. Effects of intermolecular photophysical processes on fluorescence emission; pp. 72–124. [Google Scholar]
- Wagenknecht T, Liu Z. Electron microscopy of ryanodine receptors. In: Serysheva II, editor. Structure and function of calcium release channels. Burlington, MA: Academic Press; 2010. pp. 27–47. [Google Scholar]
- Walker A, Skamel C, Vorreiter J, Nassal M. Internal core protein cleavage leaves the Hepatitis B virus capsid intact and enhances its capacity for surface display of heterologous whole chain proteins. J Biol Chem. 2008;283:33508–33515. doi: 10.1074/jbc.M805211200. [DOI] [PMC free article] [PubMed] [Google Scholar]
- Wang R, Bolstad J, Kong H, Zhang L, Brown C, Chen SRW. The Predicted TM10 Transmembrane Sequence of the Cardiac Ca2+ Release Channel (Ryanodine Receptor) Is Crucial for Channel Activation and Gating. J Biol Chem. 2004;279:3635–3642. doi: 10.1074/jbc.M311367200. [DOI] [PubMed] [Google Scholar]
- Wang R, Chen W, Cai S, Zhang J, Bolstad J, Wagenknecht T, Liu Z, Chen SRW. Localization of an NH2-terminal disease-causing mutation hot spot to the “Clamp” region in the three-dimensional structure of the cardiac ryanodine receptor. J Biol Chem. 2007;282:17785–17793. doi: 10.1074/jbc.M700660200. [DOI] [PMC free article] [PubMed] [Google Scholar]
- Wang R, Zhong X, Meng X, Koop A, Tian X, Jones PP, Fruen BR, Wagenknecht T, Liu Z, Chen SRW. Localization of the dantrolene-binding sequence near the FK506-binding protein-binding site in the three-dimensional structure of the ryanodine receptor. J Biol Chem. 2011;286:12202–12212. doi: 10.1074/jbc.M110.194316. [DOI] [PMC free article] [PubMed] [Google Scholar]
- Wriggers W. Using Situs for the integration of multi-resolution structures. Biophys Rev. 2010;2:21–27. doi: 10.1007/s12551-009-0026-3. [DOI] [PMC free article] [PubMed] [Google Scholar]
- Yuchi Z, Lau K, Van Petegem F. Disease mutations in the ryanodine receptor central region: crystal structures of a phosphorylation hot spot domain. Structure. 2012;20:1201–1211. doi: 10.1016/j.str.2012.04.015. [DOI] [PubMed] [Google Scholar]
- Zhao M, Li P, Li X, Zhang L, Winkfein RJ, Chen SRW. Molecular identification of the ryanodine receptor pore-forming segment. J Biol Chem. 1999;274:25971–25974. doi: 10.1074/jbc.274.37.25971. [DOI] [PubMed] [Google Scholar]
- Zhu L, Zhong X, Chen SRW, Banavali N, Liu Z. Modeling a ryanodine receptor N-terminal domain connecting the central vestibule and the corner clamp region. J Biol Chem. 2013;288:903–914. doi: 10.1074/jbc.M112.429670. [DOI] [PMC free article] [PubMed] [Google Scholar]
Associated Data
This section collects any data citations, data availability statements, or supplementary materials included in this article.