

Abstract
Purpose
Sonodynamic therapy is a developing noninvasive modality for cancer treatment, based on the selective activation of a sonosensitizer agent by acoustic cavitation. The activated sonosensitizer agent might generate reactive oxygen species leading to cancer cell death. We investigated the potential poly-methyl methacrylate core-shell nanoparticles (NPs) loaded with meso-tetrakis (4-sulfonatophenyl) porphyrin (TPPS) have to function as an innovative sonosensitizing system, ie, TPPS-NPs.
Methods
Shockwaves (SWs) generated by a piezoelectric device were used to induce acoustic cavitation. The cytotoxic effect of the sonodynamic treatment with TPPS-NPs and SWs was investigated on the human neuroblastoma cell line, SH-SY5Y. Cells were exposed for 12 hours to TPPS-NPs (100 μg/mL) and then to SWs (0.43 mJ/mm2 for 500 impulses, 4 impulses/second). Treatment with SWs, TPPS, and NPs alone or in combination was carried out as control.
Results
There was a statistically significant decrease in SH-SY5Y cell proliferation after the sonodynamic treatment with TPPS-NPs and SWs. Indeed, there was a significant increase in necrotic (16.91% ± 3.89%) and apoptotic (27.45% ± 3.03%) cells at 48 hours. Moreover, a 15-fold increase in reactive oxygen species production for cells exposed to TPPS-NPs and SWs was observed at 1 hour compared with untreated cells. A statistically significant enhanced mRNA (messenger ribonucleic acid) expression of NRF2 (P<0.001) and a significant downregulation of TIGAR (P<0.05) and MAP3K5 (P<0.05) genes was observed in cells exposed to TPPS-NPs and SWs at 24 hours, along with a statistically significant release of cytochrome c (P<0.01) at 48 hours. Lastly, the sonosensitizing system was also investigated in an in vitro three-dimensional model, and the sonodynamic treatment significantly decreased the neuroblastoma spheroid growth.
Conclusion
The sonosensitizing properties of TPPS were significantly enhanced once loaded onto NPs, thus enhancing the sonodynamic treatment’s efficacy in an in vitro neuroblastoma model.
Keywords: poly-methyl methacrylate nanoparticles, sonodynamic therapy, ultrasound, shockwaves, cancer
Introduction
Although progress in basic research has led to the design of new generations of anticancer targeted drugs with some notable achievements,1 further progress in cancer treatment may be also made by a more thorough investigation into other existing, but still poorly studied, therapeutic approaches. Amongst these, sonodynamic therapy takes advantage of nonthermal ultrasound to activate chemical compounds known as sonosensitizer agents, such as the nontoxic hematoporphyrins, a group of chemicals that were originally used as light-activated agents. The activated sonosensitizer agent is then able to kill cancer cells through the generation of highly reactive products, such as reactive oxygen species (ROS).2–4
This followed the assumption that inertial cavitation determined by acoustic waves at an appropriate energy fluency rate may cause an energy transfer which triggers electronic excitation in the appropriate sonosensitizer agent.5 The attractive feature of this innovative modality for cancer treatment emerges from the fact that the ultrasound energy can be targeted directly onto deep-seated malignant cancer sites, overcoming one of the main drawbacks of the photodynamic therapy modality, ie, the shallow penetration of light through skin and tissues limiting photodynamic therapy to the treatment of superficial and endoscopically reachable tumors.6 Sonodynamic therapy has two essential components: sonosensitizer agent and ultrasound. Although neither of these is individually cytotoxic, in combination they might be able to initiate a sonochemical reaction that culminates in cell death via apoptosis or necrosis.4
Nanoparticles (NPs) may enhance the sonodynamic therapy response by playing different roles: if properly engineered, when the sonosensitizer agent is loaded onto NPs, it passes more readily across the cell membrane, reaching its critical intracellular target. It has been demonstrated that sonosensitizers loaded onto NPs are more readily taken up by cells than is the free drug.7 Indeed, the use of NPs as carriers makes for a high sonosensitizer payload, whilst preserving the sonochemical properties during the activation process. The surface charge on NPs plays an important role in the way NPs interact with cell surfaces, and it has been reported that cationic particles generally enhance cellular uptake.8,9 Moreover, NPs are able not only to function as a sonosensitizer per se, but also as energy transducers.10 Therefore, we engineered poly-methyl methacrylate core-shell NPs so as to load the meso-tetrakis (4-sulfonatophenyl) porphyrin (TPPS) onto their cationic surface to form an innovative sonosensitizing system, ie, TPPS-NPs. The synthetic water-soluble TPPS has been widely investigated as a photosensitizer because of its high tumor tissue affinity and retention rate,11 as well as a remarkable quantum yield of singlet oxygen formation in solution.12 However, TPPS exploitation for photodynamic therapy applications has been hampered to date by its poor and unpredictable capability to readily pass the cell membrane and reach the critical intracellular target.13 Thus, the loading of TPPS onto NPs might well enhance the efficacy of the sonosensitizing system.
Our group introduced the use of shockwaves (SWs), characterized by microsecond pressure surges with a sudden peak positive pressure (up to values of about 100 MPa), followed by a smaller peak negative pressure (about 10 MPa), to improve the energy transfer by acoustic cavitation. To date, SWs have been generally used for renal or hepatic concernment disintegration and in orthopedics for the treatment of syndromes involving insertions. However, this treatment modality could be of greater interest if more attention were paid to its capability to transfer energy, rather than to its mechanical properties for damaged tissues.14 Indeed, it has already been reported that SWs generated by a piezoelectric device are able to elicit the electronic excitation of porphyrins by energy transfer, leading to cancer cell death in in vitro and in vivo models.15,16
Neuroblastoma, an embryonic tumor of the autonomic nervous system, is the most common cancer diagnosed during the first year of life. It may follow various courses, from spontaneous regression to an aggressive treatment-resistant disease, which is often metastatic. The main obstacles to the treatment are acquired drug resistance and selection of rare resistant clones from a heterogeneous tumor environment. This refractory form predominates over all others and has poor prognosis with only a 30% event-free survival at 5 years.17 Therefore, we investigated whether TPPS-NPs were able to enhance the sonodynamic treatment with SWs in an in vitro two- and three-dimensional neuroblastoma model. Neuroblastoma tumors display various morphologies, and neuroblastoma-derived cell lines are classified on the basis of their appearance and expression profiles.18 The human cell line SH-SY5Y, representative of the aggressive neuronal “type I” histotype, was used, and the effects on cell proliferation were evaluated both in monolayer and spheroid culture. The sonodynamic activity of TPPS-NPs activated by SWs was also evaluated by analyzing the intracellular ROS generation, cell death, mRNA (messenger ribonucleic acid) gene expression and cytochrome c release. Investigation was also carried out on the influence TPPS-loaded NPs have on SH-SY5Y proliferation in monolayer cell culture after photodynamic treatment.
Materials and methods
NP synthesis and characterization
Poly-methyl methacrylate NPs were obtained using the following procedure. Briefly, an aqueous solution (50 mL) of methacryloyloxy-undecyl-dimethylethylammonium bromide (see compound 2 in Figures S1, S2 and S3) (0.56 g, 1.44 mmol) was introduced at room temperature into a 250 mL three-neck reactor equipped with: a condenser, a mechanical stirrer, a thermometer, and inlets for nitrogen. The mixture was purged with nitrogen at a stirring rate of 300 rpm and heated to +80°C. Methylmethacrylate (4.68 g, 46.7 mmol) was then added to the aqueous solution. After 10 minutes of equilibration time, 10 mg (0.037 mmol) of 2,2′-azobis(2-methylpropionamidine) dihydrochloride (AIBA) dissolved in 0.5 mL of MilliQ® (Merck Millipore, Billerica, MA, USA) water were added, and the mixture was allowed to react for 4 hours. The product was then purified by dialysis (against water) to remove any residual monomers and stabilizers.
The ultraviolet (UV) spectrum of the NPs and the amount of TPPS released were determined by spectrophotometric measurements with a Lambda 20 spectrophotometer (PerkinElmer, Waltham, MA, USA). Supernatants were filtered with an Amicon Ultra 0.5 mL 100 K Millipore Filter (Merck Millipore) by an EBA 12 HETTIC centrifuge equipped with a F-205 FALC tube rotator. The hydrodynamic diameter of the nanospheres was determined by photon correlation spectroscopy (PCS) at +25°C using a Zetasizer 3000 HS system (Malvern Instruments, Malvern, UK) equipped with a 10 mV He-Ne laser. Data were analyzed on the basis of the viscosity and refractive index of pure water at +25°C. The instrument was calibrated with standard polystyrene latex particles, 200 nm in diameter. The sample was diluted in water to a concentration of 20 mg/mL. Electrophoretic mobility was evaluated by measuring the ζ-potential at +25°C using the same Zetasizer 3000 HS system. The instrument calibration was checked by standard polystyrene latexes, supplied by Malvern Instruments with a known ζ-potential. The loading per gram of nanospheres of quaternary ammonium groups was determined by potentiometric titration of the chloride and bromide ions respectively obtained after complete ion exchange. The ionic exchange was accomplished by dispersing 142.6 mg of the nanosphere sample in 25 mL of 1 M KNO3 at room temperature for 6 hours. The mixture was then adjusted to pH 2 with concentrated H2SO4, and bromide ions were titrated with a 0.012 M solution of AgNO3. Atomic force microscopy (AFM) samples were prepared by spin-coating deposition of NP solutions on atomic flat silicon substrate at 1,500 rpm. AFM images were performed in air and recorded using a Multimode IIIA (Bruker, Billerica, MA, USA) scanning probe. Imaging was done in tapping mode using a silicon RTESPA probe (Bruker; frequency f0 = 270 KHz and nominal tip radius ≤15 nm).
TPPS loading and release experiments
Briefly, TPPS was combined with NPs by electrostatic interaction: a certain amount of porphyrin (typically from 20 μg/mL to 150 μg/mL in MilliQ water) was added to an aqueous solution of positively charged NPs (0.5 mg/mL) and stirred at room temperature in a Vortex apparatus for 20 seconds. Each sample was then centrifuged (4 minutes, 4,722 relative centrifugal force) with a 100 kDa filter. The filtrate was analyzed by spectrophotometry at the appropriate wavelength, generating a calibration curve for further determination of the loading values.
Release procedure
The TPPS released from NPs was studied to ensure that it was the TPPS-NPs that generated the ROS during the experiments and not free TPPS that may have been released by NPs. To this aim, release experiments were performed as a function of saline concentration and time at +37°C and analyzed by spectrophotometric analysis (absorbance and fluorescence). A 100 kDa centrifugal filter tube, which is permeable by TPPS but not by TPPS-NPs and NPs, was used for the release experiments, which for more clarity has been depicted in Figure 1 and was performed as follows: 1) 0.1 mL of TPPS-NPs in MilliQ water, corresponding to 2.5 mg of NPs loaded with 250 μg of TPPS, were placed in a 100 kDa centrifugal filter tube and suspended with 0.4 mL of releasing medium (phosphate-buffered saline [PBS], pH 7.4, 150 mM, or cell culture medium) (Figure 1A); 2) the whole assembly was shaken at +37°C in a rotating stirring flat plate for predetermined time intervals (Figure 1B); 3) the solution was centrifuged-filtered for 4 minutes at 4,722 relative centrifugal force, and the resulting bottom portion of the medium (0.4 mL), potentially containing TPPS, was analyzed by spectrophotometric analysis (Figure 1C); 4) 0.4 mL of fresh medium was added to the 100 kDa centrifugal filter tube to maintain a constant volume (Figure 1D).
Figure 1.

TPPS release experiments.
Note: TPPS-NPs in MilliQ® water (Merck Millipore, Billerica, Ma, USA) are placed in a 100 kDa centrifugal filter tube and suspended with releasing medium (A); the whole mixture was shaken at 37°C (B); the solution was centrifuged and the resulting bottom portion analyzed by spectrophoto metric analysis (C); an equal volume of fresh medium was added to the tube to maintain a constant volume (D).
Abbreviation: TPPS, meso-tetrakis (4-sulfonatophenyl) porphyrin.
Considering that TPPS is completely water soluble (≤6 mg/mL) and that the quantity present on our NPs was 0.1 mg/mL, we can assume that the conditions used for the release experiments ensured sufficient dilution to allow for TPPS release.
TPPS-NP sample preparation for in vitro experiments
A total of 100 μL of TPPS (5 mg/mL in MilliQ water) was added to 70 μL of the NPs mother solution (71.3 mg/mL) so as to ensure a quantitative binding of porphyrin onto NPs (see calibration curve, Figure S4B). MilliQ water was then added to reach a total volume of 1 mL. Then, 200 μL of this TPPS-NP mother solution (5.0 mgNPs/mL; 500 μgTPPS/mgNPs) was then withdrawn and added to the plate, which contained 800 μL of culture medium. This meant that the NP concentration used for cell treatment was 1 mgNPs/mL, while all the experiments were carried out with a TPPS loading on the NPs of 100 μgTPPS/mgNPs, which is equivalent to 100 μgTPPS of loaded TPPS per mL.
Cell culture
The SH-SY5Y human neuroblastoma cell line (ICLC, Interlab Cell Line Collection, Genova, Italy) was cultured in 50% Dulbecco’s Modified Eagle’s Medium (DMEM) and 50% F-12 (v/v) supplemented with 2 mM L-glutamine, 100 UI/mL penicillin, 100 μg/mL streptomycin and (Sigma, Milano, Italy) in a humidified atmosphere of 5% CO2 air at +37°C. The SH-SY5Y was detached using 0.05% trypsin-0.02% EDTA solution (Sigma), resuspended in culture medium and seeded at the appropriate cell concentration for cell culture experiments. The SH-SY5Y neuroblastoma spheroids were obtained through liquid overlay in agarose-coated 96-well plates, as reported by Friedrich et al,19 seeding 2.5 × 10³ cells per well in 100 μL of culture medium.
In vitro sonodynamic treatment
The SH-SY5Y in the exponential growth phase was preincubated in the dark for 12 hours with culture medium containing free or loaded TPPS (100 μg/mL) onto NPs. The cells were then removed from the flask with 0.05% trypsin-0.02% EDTA solution and normalized to 5 × 10⁵ cells in 0.4 mL of PBS into 96-well plates (TPP, Trasadingen, Switzerland). A piezoelectric SW generator (Piezoson 100; Richard Wolf, Knittlingen, Germany) was used to generate focused SWs at an energy flux density (ie, the energy at the focal point) of 0.43 mJ/mm2 for 500 impulses (4 impulses/second). Common ultrasound gel was used as a contact medium between the device and the treated well. The in vitro SW treatment was delivered under a dim light.
In vitro photodynamic treatment
SH-SY5Y in the exponential growth phase was preincubated in the dark for 12 hours with culture medium containing free or loaded TPPS (100 μg/mL) onto NPs. The cells were then removed from the flask with 0.05% trypsin-0.02% EDTA solution and normalized to 1 × 10⁵ cells in 1 mL of PBS into polystyrene tubes. A custom compact system for photodynamic treatment with fixed source-cuvette positioning and light diffuser all-around cell culture was used. The light-emitting source of the system is based on InGaN light-emitting diodes (Cree Inc, Durham, NC, USA) with 20 mW max radiant power (emitted flux) and a central wavelength of 405 nm. The system allows continuous radiant flux regulation from 0 to 20 mW with a programmable non-switching diode current source. The energy fluency rates of the UV radiation were adjusted to 15 mW/cm2 for 5 minutes, measured using Actinic UV-meter (Jelosil, Le Landeron, Switzerland).
Cell proliferation assay
The WST-1 cell proliferation assay (Roche Applied Science, Penzberg, Germany) was used to evaluate any effects the treatment had on the SH-SY5Y cell growth. After the various treatments, 2.5 × 10³ cells were seeded in 100 μL of culture medium in replicates (n=8) in 96-well culture plates. WST-1 reagent (10 μL) was added at 24, 48, and 72 hours, and the plates were incubated at +37°C in 5% CO2 for 3.5 hours. The well absorbance was measured at 450 and 620 nm (reference wavelength) in a microplate reader (Asys UV340; Biochrom, Cambridge, UK). Cell proliferation data were expressed as a percentage of untreated cells.
Flow cytometric analyses
The TPPS cellular uptake, cell death, and ROS generation were assessed by a C6 flow cytometer (Accurri Cytometers, Milano, Italy), and analyses were performed by FCS Express 4 (BD Bioscience, Milano, Italy). The intracellular fluorescence, determined by the photodynamic active substance (TPPS), was evaluated by flow cytometer at a 488 nm excitation (FL3), after cell exposure to TPPS or TPPS-NPs. It was expressed as the integrated median fluorescence intensity (iMFI), which was the product of the frequency of TPPS positive cells and the median fluorescence intensity of the cells. The most suitable TPPS or TPPS-NP concentration for the study, ie, the concentration able to reach more than 50% of the cell population without significantly affecting cell viability, was chosen on the basis of the iMFI ratio. This ratio was the difference in the iMFI of treated and untreated cells over the iMFI of untreated cells.20
Cell death was evaluated by the Dead Cell Apoptosis Kit with allophycocyanin (APC)-Annexin V and Sytox® Green (Life Technologies, Milano, Italy). Briefly, 5 × 10 5 SH-SY5Y cells were treated and washed twice at 24 and 48 hours with 1× Annexin-binding buffer at 1,500 rpm for 5 minutes and then stained with APC-Annexin V and Sytox Green. The samples were run on the flow cytometer at 640 nm excitation to measure APC-Annexin V (FL4) and at 488 nm to measure Sytox Green (FL1), respectively. Any cell debris with low FSC (forward light scatter) and SSC (side light scatter) were excluded from the analyses. A total of 10,000 events were analyzed for APC-Annexin V (FL4) and Sytox Green (FL1) staining to discriminate apoptotic (Annexin V positive) and late apoptotic/necrotic cells (Annexin V and Sytox Green positive) from viable cells (Annexin V and Sytox Green negative).
The ROS generation was measured with the 2,7- dichlorodihydrofluorescein (DCFH) diacetate (DA) (DCFH-DA; Molecular Probes, Carlsbad, CA, USA) as intracellular probe for oxidative stress. DCFH-DA is a stable, nonfluorescent molecule that readily crosses the cell membrane and is hydrolyzed by intracellular esterases to the nonfluorescent DCFH, which is rapidly oxidized in the presence of peroxides to highly fluorescent dichlorofluorescein (DCF) upon oxidation by ROS.21 Briefly, cells were incubated with 10 μM DCFH-DA for 30 minutes, washed with PBS, trypsinized, collected in 1 mL of PBS, and analyzed. The ROS production was expressed as the iMFI, which was the product of the frequency of ROS-producing cells and the median fluorescence intensity of the cells. The iMFI ratio was determined to yield the ratiometric increase in fluorescence per time point.20
Fluorescence microscopy observation of cytotoxicity
After the sonodynamic treatment with TPPS-NPs (100 μg/mL) and SWs (0.43 mJ/mm2 for 500 impulses, 4 impulses/second), 25 × 103 SH-SY5Y cells were seeded in 1 mL of culture medium in 24-well plates and were allowed to attach for 48 hours on glass coverslips in the wells. The Live/Dead Cell Double Staining Kit (Sigma) was then used for the simultaneous fluorescence staining of viable and nonviable cells. Briefly, this kit contains acetoxymethyl ester of calcein (calcein-AM) and propidium iodide solutions, which stain viable and nonviable cells, respectively. Calcein-AM is highly lipophilic and cell-membrane permeable. Though calcein-AM itself is not a fluorescent molecule, the calcein generated from calcein-AM by esterase in a viable cell emits a strong green fluorescence. Alternatively, propidium iodide reaches the nucleus by passing through disordered areas of dead cell membrane and intercalates with the deoxyribonucleic acid (DNA) double helix of the cell to emit a red fluorescence. The coverslips were then mounted on glass slides, observed under fluorescence microscopy (DMI4000B Leica, Wetzlar, Germany) and photographed at 63× magnification. For the cell count, a total of 50 cells per slide were analyzed at a magnification of 40× in three separate areas, three times in three individual experiments.
Real-time polymerase chain reaction (PCR) analysis of oxidative stress-associated gene expression
Total RNA was isolated from the SH-SY5Y cells at 24 hours after sonodynamic treatment. Briefly, cells were incubated for 12 hours with TPPS, NPs, or TPPS-NPs at the same concentration (100 μg/mL) and exposed to SWs at 0.43 mJ/mm2 for 500 impulses (4/second). After 24 hours, the cells were then collected in an RNA cell protection reagent (Qiagen, Milano, Italy) and stored at −80°C. Total RNA was then obtained by the RNeasy® Plus Mini Kit (Qiagen). The total RNA concentration (μg/mL) was determined by the fluorometer Qubit (Invitrogen, Milano, Italy) and the Quant-iT™ RNA Assay Kit (Invitrogen); calibration was done applying a two-point standard curve, according to the manufacturer’s instructions. The integrity of the RNA samples was determined by the total RNA 6000 Nano Kit (Agilent Technologies, Milano, Italy) by the Agilent 2100 Bioanalyzer (Agilent Technologies).
Real-time reverse transcriptase (RT)-PCR analysis was carried out using 500 ng of total RNA, which was reverse transcribed in a 20 μL cDNA (complementary DNA) reaction volume, using the QuantiTect® Reverse Transcription Kit (Qiagen), according to the manufacturer’s instructions; 12.5 ng of cDNA was used for each 10 μL real-time RT-PCR reaction. Quantitative RT-PCR was performed using the SsoFast™ EvaGreen (Bio-Rad, Milan, Italy). QuantiTect Primer Assay (Qiagen) was used as the gene-specific primer pair for APAF1 (Cat No QT00092358), BAX (Cat No QT00031192), BCL2 (Cat No QT00025011), CDKN1A (Cat No QT00062090), GPX1 (Cat No QT00203392), HIF1A (Cat No QT00083664), MAP3K5 (Cat No QT00041594), NRF2 (Cat No QT00027384), NQO1 (Cat No QT00050281), RRN18S (Cat No QT00199367), SOD1 (Cat No QT01008651), TIGAR (Cat No QT00071225), and TP53 (Cat No QT00060235). The transcript of the reference gene ribosomal RNA 18S (RRN18S) was used to normalize mRNA data, and real-time PCR was performed by a MiniOpticon™ Real Time PCR system (Bio-Rad). The PCR protocol conditions were as follows: HotStarTaq DNA polymerase activation step at +95°C for 30 seconds, followed by 40 cycles at +95°C for 5 seconds and +55°C for 10 seconds. All runs were performed with at least three independent cDNA preparations per sample, and all samples were run in duplicate. At least two non-template controls were included in all PCR runs. The quantification data analyses were performed using the Bio-Rad CFX Manager Software version 1.6 (Bio-Rad) according to the manufacturer’s instructions. These analyses were performed in compliance with the MIQE (Minimum Information for Publication of Quantitative Real-time PCR Experiments) guidelines.22
Cytochrome c analysis
The cells were analyzed after 48 hours from the sonodynamic treatment, ie, incubation in the dark with TPPS-NPs (100 μg/mL) for 12 hours followed by treatment with SWs at 0.43 mJ/mm2 for 500 impulses (4 impulses/second). Cytosolic cytochrome c was then determined in supernatants from the selectively permeabilized cells using an enzyme-linked immunosorbent assay (eBioscience, San Diego, CA, USA), following the manufacturer’s instructions. The concentration of cytochrome c was calibrated from a standard curve based on reference standards.
Neuroblastoma spheroid analysis
The SH-SY5Y cell suspensions (2.5 × 10³ cells in 100 μL) were placed in a 96-well culture plate and treated for free association of cells to form multicellular tumor spheroids. The spheroid formation was analyzed after 3 days, and phase contrast photographs were taken in an inverted DMI4000B microscope (Leica, Wetzlar, Germany). The diameter of each neuroblastoma spheroid was measured by the Leica Application Suite Software (Leica) and the volume (V) was calculated by V =4/3πr3. According to the experimental setting, spheroids were then treated with SWs at 0.43 mJ/mm2 for 500 impulses (4 impulses/second) alone or in combination with TPPS or TPPS-NPs (100 μg/mL) preincubated in the dark for 12 hours. Both the integrity of the spheroid and the volume were then recorded at 24, 48, and 72 hours after the sonodynamic treatment. Data are presented as average ± standard deviation of three independent experiments with three replicates for each condition.
Statistical analysis
Data are shown as the average values ± standard deviation of three independent experiments. Statistical analyses were performed with Graph-Pad Prism 5.0 software (La Jolla, CA, USA); two-way analysis of variance and Bonferroni’s test were used to calculate the threshold of significance. Statistical significance was set at P<0.05.
Results
TPPS-NP characterization
Core-shell NPs (Figure 2), obtained by emulsion polymerization reaction, were characterized by an average hydrodynamic diameter of 93 ± 1.4 nm (five measurements; Table S1). The ammonium group loading, available for the interaction with TPPS, was determined by potentiometric titration of bromide ions obtained after complete ion exchange and was 265 μmol of quaternary ammonium bromides per gram of nanosphere (Figure S4A). Lastly, the ζ-potential of NPs (38.8 ± 2.4 mV), which was measured after dialysis purification, confirmed that the cationic co-monomer employed in the polymerization reaction is covalently bound to the NP surface (Table S2). AFM enabled the direct visualization of the NPs as well as the direct estimation of the radius distribution (Figure 2). The NPs were deposited on atomic flat silicon substrate spin-coating a solution of 0.14 mg/mL at 1,500 rpm. These experimental conditions prevented the aggregation of the NPs and realized a very uniform deposition over 1 cm2 of isolated NPs, which could be clearly distinguished from the substrate. The size distribution was calculated using a grain analysis algorithm (threshold chosen at 50% of the nano-object height) and taking into account the overestimation of the measured size due to the finite size of the tip. The mean value of the radius was 72 ± 17 nm.
Figure 2.
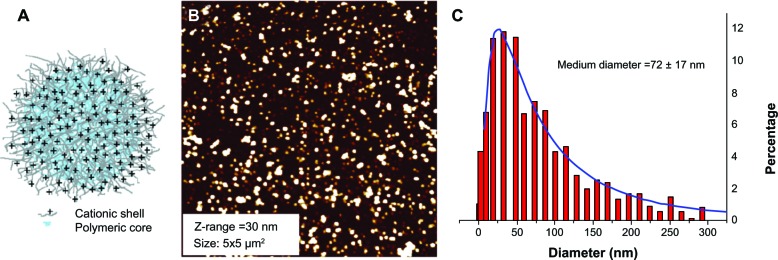
(A) Representation of polymethyl methacrylate core-shell nanoparticles; (B) atomic force microscopy image of nanospheres deposited on atomic flat silicon Z-range =72 ± 17 nm; (C) distribution (%) of nanoparticle radius.
The difference in the NPs radii observed with PCS and AFM techniques could be ascribed to the different environments in which the measurements were performed eg, water and air, respectively. The Stokes diameter measured with PCS corresponds to the size of the solvated NP, which was expanded due to the presence of the external ammonium groups; while AFM directly measured the dry radius.
NP stability evaluation
The stability of the TPPS-NP system was evaluated by mimicking physiological conditions using further PBS treatment (150 mM) at +37°C and cell growth culture medium as the washing solution. The results of the spectrophotometric analysis showed that there was no relevant release of TPPS from the nanospheres, under the reported conditions (Figure S5 and Figure S6A–D). As the amount of TPPS released was not detectable, absorbance measurements when using PBS as washing solution were been reported, while TPPS release using culture medium is below 1% (Figure S6C and D to be compared with Figure S6A). Thus, we are confident that TPPS, even if electrostatically loaded onto the particles, is tightly bounded to the cationic shell, and no significant release from the spheres during in vitro experiments is likely to occur.
Effects of sonodynamic and photodynamic treatment with TPPS-NPs on SH-SY5Y cell proliferation
As shown in Table 1, exposing SH-SY5Y cells to TPPS or TPPS-NPs from 25 to 100 μg/mL for 12 hours did not affect cell viability. A dose-dependent increase of the iMFI ratio corresponding to the TPPS internalization was observed after TPPS or TPPS-NP incubation. Noteworthy is the fact that the iMFI was enhanced by TPPS loading onto NPs (Table 1). The sonodynamic effect on SH-SY5Y cell proliferation was then evaluated after 48 hours of exposure to SWs of TPPS or TPPS-NP preincubated cells. Only when the cells were preincubated with TPPS-NPs were the sound waves able to significantly decrease SH-SY5Y cell proliferation at an energy flux density of 0.43 mJ/mm2 for 500 impulses (4/second) (Figure 3). Moreover, the decrease in cell proliferation was TPPS-NP dose-dependent (Figure 3). Therefore, we analyzed the effect sonodynamic therapy had on cell proliferation when cells were preincubated for 12 hours with 100 μg/mL TPPS or TPPS-NPs as a function of time. Experiments were also carried out on the effects TPPS-NPs had on cell proliferation compared with TPPS alone when cells preincubated for 12 hours were exposed to an appropriate light beam (LB).
Table 1.
TPPS cellular uptake by SH-SY5Y after 12 hours of incubation
| Concentration (μg/mL) | TPPS
|
TPPS-NPs
|
||
|---|---|---|---|---|
| Cell population (%) | iMFI ratio | Cell population (%) | iMFI ratio | |
| 25 | 54.42 ± 6.94 | 39.61 ± 12.81 | 70.23 ± 5.62 | 86.47 ± 5.05a |
| 50 | 73.19 ± 4.06 | 78.95 ± 3.33 | 97.42 ± 2.31b | 190.23 ± 16.23b |
| 100 | 85.01 ± 6.07 | 114.46 ± 8.31 | 97.98 ± 2.25 | 256.36 ± 15.35c |
Notes: Statistically significant difference versus cells incubated with TPPS alone:
P<0.05
P<0.01
P<0.001.
Abbreviations: TPPS, meso-tetrakis (4-sulfonatophenyl) porphyrin; NPs, nanoparticles; iMFI, integrated median fluorescence intensity.
Figure 3.
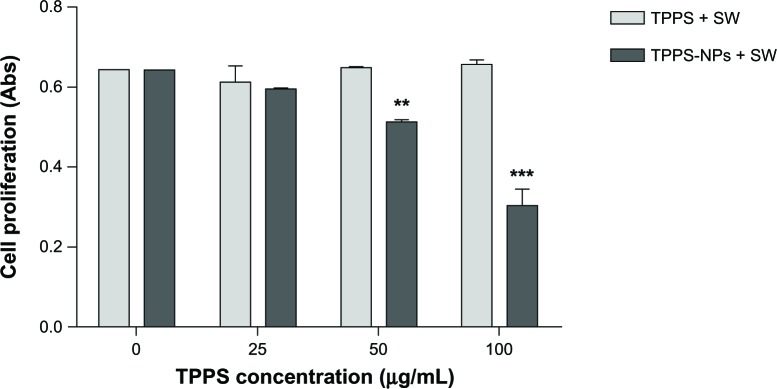
Effect of sonodynamic treatment on SH-SY5Y proliferation as a function of sonosensitizer dose and formulations. Cells were incubated for 12 hours with increasing concentration of TPPS or TPPS-NPs (25, 50, and 100 μg/ml) and then exposed to SWs at 0.43 mJ/mm2 for 500 impulses (4/second).
Notes: Cell proliferation was evaluated after 48 hours by WST-1 assay (Roche Applied Science, Penzberg, Germany). Statistically significant difference versus sonodynamic treatment with TPPS: **P<0.01; ***P<0.001.
Abbreviations: TPPS, meso-tetrakis (4-sulfonatophenyl) porphyrin; NPs, nanoparticles; SW, shockwave.
Interestingly control treatments, ie, cells exposed to unloaded NPs, SWs, or an LB alone or in combination, did not affect SH-SY5Y cell proliferation when compared with untreated cells (Figure 4A and B). Noteworthy was the fact that at the same concentration tested of 100 μg/mL, the TPPS-NPs enhanced the sonodynamic treatment efficacy compared with TPPS alone (Figure 4C). Whereas, both TPPS alone and TPPS loaded onto NPs exerted the same effect on SH-SY5Y cell proliferation in the photodynamic treatment (Figure 4D). The different activities observed of TPPS alone after SW or LB exposure might be ascribed to the inner lower energy locally generated by acoustic waves compared with light. For example, the strongest energy transfer produced by the photodynamic treatment might be less affected by cell internalization at the concentration tested (Table 1). On the other hand, the same activity observed with TPPS loaded onto NPs after SWs or an LB may be due to the presence of the NPs that lead to a decrease in the cavitation threshold, enhancing the sonodynamic treatment efficacy.
Figure 4.

Effect of different treatment conditions on SH-SY5Y proliferation as a function of time. Sonodynamic treatment was performed with SWs at 0.43 mJ/mm2 for 500 impulses (4/second) and photodynamic therapy with an LB at 15 mW, for 5 minutes. The control conditions are reported on the upper panels (A and B), ie, treatments without the sensitizer, and the lower panels (C and D) report treatment on cells incubated for 12 hours with the sensitizer, ie, TPPS (100 μg/ml).
Notes: Cell proliferation was evaluated by WST-1 assay (Roche Applied Science, Penzberg, Germany). Statistically significant difference versus untreated cells: **P<0.01; ***P<0.001.
Abbreviations: NPs, nanoparticles; SW, shockwave; LB, light beam; TPPS, meso-tetrakis (4-sulfonatophenyl) porphyrin; SDT, sonodynamic treatment; PDT, photodynamic treatment; Abs, absorbance; h, hours.
Effects of sonodynamic treatment with TPPS-NPs on SH-SY5Y cell death
Depending on the cell proliferation data, SH-SY5Y cell death was evaluated after 48 hours from the sonodynamic treatment with TPPS-NPs (100 μg/mL) and SWs by fluorescence microscopy and flow cytometry. As shown in Figure 5C, there were about 50% of nonviable cells in the whole cell population stained with calcein-AM and propidium iodide. Furthermore, flow cytometry was used to analyze the SH-SY5Y cells stained with APC-Annexin V and Sytox Green 48 hours after the sonodynamic treatment with TPPS (100 μg/mL), unloaded NPs (1 mg/mL), or TPPS-NPs (100 μg/mL) and SWs at 0.43 mJ/mm2 for 500 impulses (4/second), so as to determine whether the inhibition of cell growth was mediated via apoptosis. Only the sonodynamic treatment with TPPS-NPs was able to induce a significant increase of the apoptotic (P<0.001) and necrotic (P<0.01) cell percentage when compared with the other treatment conditions (Table 2). Figure 5D shows representative flow cytometry density plots 48 hours after the sonodynamic treatment with TPPS or TPPS-NPs.
Figure 5.

Effect of sonodynamic treatment on SH-SY5Y cell death. Representative images of (A) viable cells stained with acetoxymethyl ester of calcein, (B) nonviable cells with propidium iodide, and (C) overlay image, after 48 hours from sonodynamic treatment with TPPS-NPs. Cells were incubated for 12 hours with TPPS-NPs (100 μg/ml) and then exposed to SWs at 0.43 mJ/mm2 for 500 impulses (4/second). Scale bars: 100 μm (63× magnification). (D) Representative flow cytometry density plots of SH-SY5Y at 48 hours from different treatment conditions: cells were exposed to SWs (0.43 mJ/mm2 for 500 impulses, 4/second) alone or after cell incubation for 12 hours with TPPS (100 μg/ml) or TPPS-NPs (100 μg/ml). The cells were stained with Annexin V-APC (FL-4) and Sytox® Green (FL-1). Each density plot represents viable cells in the lower left quadrant (negative to APC-Annexin V and Sytox Green), apoptotic cells in the lower right quadrant (positive to APC-Annexin V and negative to Sytox Green), and necrotic cells in the upper right quadrant (positive to Annexin V and Sytox Green).
Notes: Sytox® Green (Life Technologies, Milano, Italy). Annexin V-APC (Life Technologies).
Abbreviations: TPPS, meso-tetrakis (4-sulfonatophenyl) porphyrin; NPs, nanoparticles; SW, shockwave; APC, allophycocyanin.
Table 2.
Flow cytometric evaluation of SH-SY5Y cell death after 48 hours from different treatment conditions: cells were exposed to SWs (0.43 mJ/mm2 for 500 impulses, 4/second) alone or after cell incubation for 12 hours with TPPS (100 μg/mL), unloaded NPs (1 mg/ml), or TPPS-NPs (100 μg/mL)
| Cell treatments | Viable cells (%) | Apoptotic cells (%) | Necrotic cells (%) |
|---|---|---|---|
| Untreated cells | 91.69 ± 1.56 | 4.80 ± 3.39 | 2.36 ± 3.10 |
| SW | 84.04 ± 2.44 | 13.22 ± 1.27 | 1.23 ± 1.61 |
| TPPS + SW | 85.48 ± 2.94 | 13.14 ± 4.81 | 2.03 ± 0.78 |
| NPs + SW | 83.63 ± 1.66 | 12.14 ± 2.45 | 2.56 ± 2.04 |
| TPPS-NPs + SW | 55.73 ± 4.99a | 27.45 ± 3.03a | 16.91 ± 3.89b |
Note: Statistically significant difference versus untreated cells:
P<0.001
P<0.01.
Abbreviations: SW, shockwave; TPPS, meso-tetrakis (4-sulfonatophenyl) porphyrin; NPs, nanoparticles.
SH-SY5Y ROS generation after sonodynamic treatment with TPPS-NPs
DCFH-DA was used as a ROS probe to examine the ROS generation induced by the sonodynamic treatment. In fact, the highly fluorescent DCF can be determined by flow cytometry at an excitation of 488 nm (FL1) in the presence of peroxides.
The intracellular ROS levels were determined after 1, 5, 30, and 60 minutes from the sonodynamic treatment with SWs alone or in combination with TPPS (100 μg/mL), unloaded NPs (1 mg/mL) or TPPS-NPs (100 μg/mL).
As shown in Figure 6, the sonodynamic treatment led to a slight increase in ROS generation 1 hour after the SW treatment of TPPS (P<0.05) or unloaded NP (P<0.05) exposed cells compared with cells treated only with SWs. Conversely, the sonodynamic treatment with TPPS-NPs led to a statistically significant increase in ROS generation as early as 1 minute (P<0.05) after the treatment, reaching a 15-fold increase at 1 post-treatment hour (P<0.001).
Figure 6.
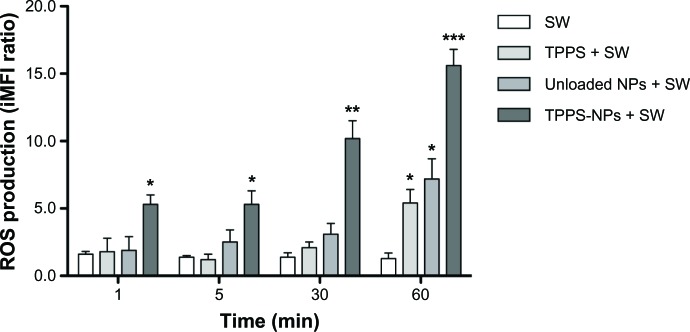
SH-SY5Y ROS production after different treatment conditions as a function of time. The cells were exposed to SWs at 0.43 mJ/mm2 for 500 impulses (4/second) alone or after cell incubation for 12 hours with TPPS (100 μg/ml), unloaded NPs (1 mg/ml), or TPPS-NPs (100 μg/ml).
Notes: ROS levels were determined according to the dichlorofluorescin-diacetate assay by flow cytometry and expressed as an iMFI ratio. Statistically significant difference versus untreated cells: *P<0.05; **P<0.01; ***P<0.001.
Abbreviations: ROS, reactive oxygen species; iMFI, integrated median fluorescence intensity; SW, shockwave; TPPS, meso-tetrakis (4-sulfonatophenyl) porphyrin; NPs, nanoparticles; min, minutes.
Effects of sonodynamic treatment with TPPS-NPs on oxidative stress-associated gene expression and cytochrome c release
Real-time RT-PCR analysis was used to investigate the effect sonodynamic treatment has on the mRNA expression of genes involved in the apoptotic mechanism and in the oxidative stress after 24 post-treatment hours. As shown in Figure 7A, the mRNA expression of NRF2 coding for a transcription activator, which is essential for the coordinated upregulation of genes in response to oxidative stress, was significantly enhanced (P<0.001); whereas the mRNA expression of TIGAR coding for a protein that protects cells from DNA damage by ROS, and MAP3K5 coding for a protein with a crucial role in the apoptosis signal transduction pathway through mitochondria-dependent caspase activation were significantly downregulated (P<0.05) after the TPPS-NPs and SW treatment compared with untreated cells.
Figure 7.
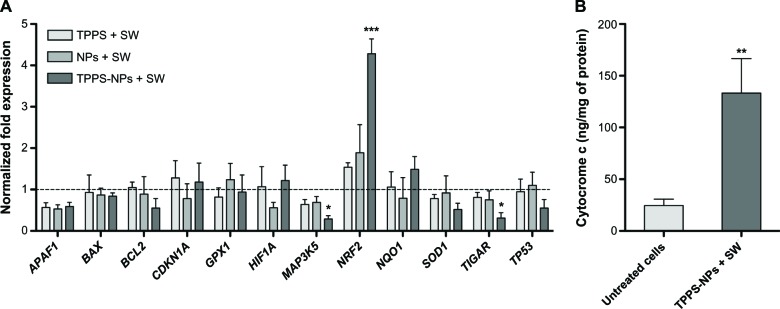
(A) mRNA expression analysis in SH-SY5Y cells at 24 hours from sonodynamic treatment. Cells were incubated for 12 hours with TPPS, NPs, or TPPS-NPs at the same concentration (100 μg/ml) and then exposed to SWs at 0.43 mJ/mm2 for 500 impulses (4/second). RRN18S (ribosomal RNA 18S) was used as a reference gene to normalize the data. The sonodynamic therapy-induced alterations in mRNA levels were compared with those of the untreated cells stated as 1 and are shown by the dotted line. (B) Cytochrome c release at 48 hours post sonodynamic treatment with TPPS-NPs. The cells were incubated for 12 hours with TPPS-NPs (100 μg/ml) and then exposed to SWs at 0.43 mJ/mm2 for 500 impulses (4/second).
Notes: Statistically significant difference versus untreated cells: *P<0.05; **P<0.01; ***P<0.001.
Abbreviations: TPPS, meso-tetrakis (4-sulfonatophenyl) porphyrin; SW, shockwave; NPs, nanoparticles; mRNA, messenger RNA; RNA, ribonucleic acid.
Since cytochrome c release, which is peculiar to oxidative stress, may induce apoptosis, its release in cytosolic extracts of SH-SY5Y cells treated with TPPS-NPs for 12 hours and then exposed to SWs was assessed. As shown in Figure 7B, there was a statistically significant increase in the release of mitochondrial cytochrome c into cytosol after 48 hours from the sonodynamic treatment compared with untreated cells (P<0.01).
Reduced spheroid size after sonodynamic treatment with TPPS-NPs
The growth rate of the neuroblastoma spheroids was monitored by taking phase contrast images at different time points and calculating the spheroid volumes. It was evident as early on as 24 post-treatment hours that the SH-SY5Y spheroids treated with TPPS-NPs for 12 hours and then exposed to SWs were smaller in volume than the untreated spheroids, those treated with SWs alone, or those treated in combination with TPPS and SWs (Figure 8). Moreover, SW treated spheroids maintained their integrity.
Figure 8.

The average volume of SH-SY5Y spheroids after different treatment conditions. The spheroids were exposed to SW alone or after incubation of spheroids for 12 hours with TPPS or TPPS-NPs. Statistically significant difference versus untreated spheroids: **P<0.01, ***P<0.001.
Abbreviations: TPPS, meso-tetrakis (4-sulfonatophenyl) porphyrin; NPs, nanoparticles; SW, shockwave; h, hours.
Discussion
Although sonodynamic therapy is a promising new anticancer approach, its consistency as anticancer treatment modality has still to be established since its underlying mechanism has not yet been well defined. Some researchers have suggested that the activation of the sonosensitizer might be due to the acoustic cavitation induced by ultrasound propagation in a liquid milieu.4,23 The presence of particles in the liquid milieu might provide nucleation sites able to promote the cavitation activity. As these particles have a rough surface, this might lead to a decrease in the threshold intensity required for the acoustic cavitation occurrence, promoting a positive effect on the cavitation activity of ultrasound.24
Therefore, it is more than reasonable to assume that properly designed NPs loaded with a sonosensitizer may not only act as an effective sonosensitizing vehicle capable of targeting tumor tissues and/or cells, but also as a tool to enhance the sonodynamic response. This led us to the investigation of whether a suitably tailored NP system might be able to enhance the sonodynamic activity in an in vitro neuroblastoma model.
Our data show that core-shell poly-methyl methacrylate NPs were able to significantly increase porphyrin incorporation into living cells (Table 1). Single cell treatments, such as exposure to SWs alone or TPPS alone, had no effect on SH-SY5Y cell proliferation. Indeed, the only sonodynamic treatment that showed a statistically significant decrease in SH-SY5Y cell proliferation was SWs in combination with TPPS-NPs (Figure 4), where this sonodynamic treatment significantly increased apoptotic cell death (Figure 5D and Table 2). As TPPS is commonly used in photodynamic therapy,25 we also investigated the influence of NPs on the photodynamic treatment of SH-SY5Y cells. Differently to the sonodynamic treatment, TPPS-NPs did not improve the photodynamic treatment efficacy compared with TPPS alone (Figure 4). This finding might be due to the different mechanisms involved, as maybe the NPs act only as a sonosensitizing vehicle in photodynamic treatment, whilst in sonodynamic treatment they enhance the cavitation activity.
The sonodynamic mechanism of action was then investigated. The sonodynamic treatment with SWs of SH-SY5Y cells exposed to TPPS-NPs increased the SH-SY5Y generation of ROS (Figure 6). The uncontrolled increase in the generation of free radicals may then exceed the capacity of antioxidant mechanisms resulting in cell damage. A one-electron product of oxygen reduction, the superoxide anion radical and its dismutation product, hydrogen peroxide (H2O2), are among the mayor biologically relevant free-radical species in cells. Although the DCF fluorescence is an assay of generalized oxidative stress rather than of any particular reactive species, the redox state of the sample monitored by detecting the increase in DCF fluorescence is assumed to be proportional to the concentration of hydrogen peroxide in the cells.21,26
Proapoptotic signals in the intrinsic apoptotic pathway, such as the proapoptotic protein Bax, translocate to mitochondria, resulting in mitochondrial membrane permeabilization. This, in turn, provides a route for the release of intermembrane space proteins, such as cytochrome c, into the cytosol. The release of caspase activators, such as cytochrome c, is considered a point of no return for programmed cell death.27 Sonodynamic treatment with TPPS-NPs and SWs was able to determine a statistically significant increase in cytoplasmic cytochrome c. This protein is highly redox-sensitive, since it acts as a reversible electron donor/acceptor, and the release of cytocrome c is considered to be a hallmark of mitochondrial-mediated apoptosis.28 Besides its function as an electron carrier, cytochrome c may act as a peroxidase.27 Once in the cytosol, cytochrome c promotes the formation of the apoptosome, a molecular platform for the activation of caspase-9, leading to the expression of two key apoptotic phenotypes; namely, exposure of phosphatidylserine on the outer surface of plasma membrane and DNA degradation.29 A statistically significant enhanced mRNA expression of NRF2 (P<0.001) and a statistically significant downregulation of TIGAR (P<0.05) and MAP3K5 (P<0.05) genes were observed, 24 hours after the sonodynamic treatment with TPPS-NPs and SWs. Intracellular redox homeostasis regulates the expression of multiple gene-encoded proteins affecting cell death and survival. In response to alterations in the oxidative status, the transcription of those genes can, in part, be modulated through a redox control of transcription factors.
As NRF2 (nuclear factor-erythroid 2-related factor 2) is a transcription factor, it acts as a sensor for oxidative/electrophilic stress binding to the antioxidant response elements within promoters of antioxidant enzymes and detoxifying enzymes, such as NADPH (nicotinamide adenine dinucleotide phosphate) quinone oxidoreductase 1 (NQO1).30 Reportedly, NRF2 is the main mediator of cellular adaptation to redox stress, since NRF2-dependent signal transduction can control cellular protection against oxidative stress-mediated cytotoxic effects. Other stress-related transcription factors induced by oxidative stress include the hypoxia-inducible factor (HIF), and our data showed that the HIF expression was not affected 24 hours post sonodynamic treatment, as was true for the TP53 expression. The p53 protein has both pro-oxidant and antioxidant functions and, albeit in different ways and with different outcomes, both can contribute to tumor suppression. Indeed, the p53 protein induces the transcription of the TIGAR gene (TP53-induced glycolysis and apoptosis regulator) gene, which lowers the intracellular concentrations of fructose-2,6-bisphosphate, consequently decreasing glycolysis and overall levels of intracellular ROS. TIGAR uses this pathway to decrease ROS levels and lower sensitivity to ROS-associated apoptosis. Therefore, TIGAR seems to function as a checkpoint for the negative regulation of glycolysis, and our data showed a statistically significant decrease in the TIGAR mRNA expression 24 hours after sonodynamic treatment. It has been reported that the knockdown of the basal levels of TIGAR suffices to stimulate ROS-production and autophagy, in a p53-independent fashion, to levels mimicked by the exogenous addition of H2O2.31 Oxidative stress activates transcription of a variety of antioxidant genes governed by key signaling pathways involved in cellular oxidative responses.28,32 Hence, MAPK is a downstream effector in antioxidant responses and its activity plays a key role in transducing various extracellular signals to the nucleus.33
The effect of TPPS-NPs and SW sonodynamic treatment on neuroblastoma multicellular tumor spheroids was evaluated as a supplement to monolayer-based assays before whole-animal studies. Noteworthy was the fact that this sonodynamic treatment was able to induce a statistically significant decrease in the growth of neuroblastoma spheroids without loss of their integrity.
Conclusion
TPPS loaded poly-methyl methacrylate NPs were able to improve the porphyrin sonodynamic activity in an in vitro two- and three-dimensional model of human neuroblastoma. This new sonosensitizing system significantly decreased cancer cell growth after SW exposure, suggesting its potential application for further progress in sonodynamic anticancer therapy.
Supplementary materials
Monomer synthesis
The cationic surfactant, methacryloyloxy-undecyl-dimethylethylammonium bromide (compound 2 in Figure S1) was obtained by following the previously reported procedure for the synthesis of its analog, MUTB (methacryloyloxy-undecyl-trimethylammonium bromide).1,2 Briefly, 11-bromoundecanol (20 g, 0.08 mol, 1 eq) and 320 mL of anhydrous tetrahydrofuran were mixed in a flask at 0°C under N2, followed by the addition of 10.8 mL (0.11 mol, 1.37 eq) of methacryloyl chloride. The reaction system was bubbled with N2 at room temperature for 2 hours and left under stirring overnight. The unreacted methacryloyl chloride and solvent were removed under reduced pressure. The yellowish residue was dissolved in ethyl ether and washed with saturated sodium hydrogen carbonate solution until the aqueous layer was basic. After evaporation of the ether, a viscous yellowish liquid of 11-bromoundecyl methacrylate (compound 1 in Figure S1) was obtained with a yield of 91%. Compound 2, with a yield of 58% was obtained by reacting compound 1 with N,N-dimethyl ethanamine (2.2 eq) in the presence of a small amount of hydroquinone to inhibit potential radical polymerization side reactions. After stirring the mixture under N2 at +40°C for 2 days, a solid was formed which was washed with diethyl ether to remove excess amine, and crystallized with acetone. The final compound was than dried under vacuum at room temperature.
1HNMR (400 MHz, DO) δ 5.94 (s, 1H), 5.51 (br s, 1H), 4.55–4.73 (m, 2H), 3.99 (t, J =5.68 Hz, 2H), 3.28 (q, J =6.54 Hz, 2H), 3.09–3.22 (m, 2H), 2.83–3.03 (m, 6H), 1.72–1.86 (m, 3H), 1.61 (br s, 2H), 1.44–1.58 (m, 2H), 1.22 (br s, 9H), 1.16 (br s, 6H) ppm.
13CNMR (100 MHz, D2O) δ: 168.2, 136.4, 125.9, 65.3, 63.5, 59.7, 50.3, 29.5, 29.4, 29.4, 29.2, 29.0, 28.5, 26.2, 25.9, 22.3, 18.0, 7.9 ppm.
Nanosphere synthesis
Nu-C11-01 nanoparticles were obtained using the experimental procedure described as follows. An aqueous solution (50 mL) of compound 2 (0.56 g, 1.44 mmol) was introduced at room temperature into a 250 mL three-neck reactor equipped with a condenser, a mechanical stirrer, a thermometer, and inlets for nitrogen. The mixture was purged with nitrogen, at a stirring rate of 300 rpm, and heated to +80°C. Methylmethacrylate (4.68 g, 46.7 mmol) was then added to the water solution. After 10 minutes equilibration time, 10 mg (0.037 mmol) of AIBA (2,2-azobis(2-methylpropionamidine) dihydrochloride) dissolved in 0.5 mL of MilliQ® (Merck Millipore, Billerica, MA, USA) water was added, and the mixture was allowed to react for 4 hours. At the end of the process, the product was purified by dialysis (against water) to remove residual monomer and stabilizer.
Nanoparticle characterization
Monomer synthesis.
1HNMR of compound 2; D2O, 400 MHz.
Note: This report was created by ACD/NMR Processor Academic Edition. For more information go to www.acdlabs.com/nmrproc/.
13CNMR of compound 2; D2O, 100 MHz.
Note: This report was created by ACD/NMR Processor Academic Edition. For more information go to www.acdlabs.com/nmrproc/.
Nanoparticle titration curve (A) and loading calibration curve (B).
TPPS (A) and TPPS-NPs (B) absorbance and photoluminescence spectra.
Abbreviations: TPPS, meso-tetrakis (4-sulfonatophenyl) porphyrin; NPs, nanoparticles.
(A) Emission (fluorescence) spectra of TPPS-NPs (100 μg/mg) in different medium. (B–D) Release experiments: (B) in PBS 150 mM at +37°C, emission (fluorescence) spectra of the filtrates at different times; (C) in culture medium at +37°C, emission (fluorescence) spectra of the filtrates at different times; (D) in culture medium at +37°C, absorbance spectra of the filtrates at different times.
Notes: In order for the curves to be at least partially in the scale range, we needed to reduce spectrofluorometer slit from 15 (completely opened) to 10. Absorbance spectra of the filtrates obtained from PBS release experiments have not been reported because they are below the detectable threshold.
Abbreviations: h, hours; TPPS, meso-tetrakis (4-sulfonatophenyl) porphyrin; NPs, nanoparticles; PBS, phosphate-buffered saline.
Table S1.
Hydrodynamic diameter measurements by dynamic light scattering (MilliQ® water at +25°C)
| Run | Angle | KCps | ZAve | PI | Fit |
|---|---|---|---|---|---|
| 1 | 90.0 | 165.4 | 95.7 | 0.201 | 0.000276 |
| 2 | 90.0 | 166.5 | 92.2 | 0.221 | 0.000190 |
| 3 | 90.0 | 168.5 | 92.4 | 0.248 | 0.000152 |
| 4 | 90.0 | 168.7 | 93.1 | 0.226 | 0.000195 |
| 5 | 90.0 | 170.3 | 93.1 | 0.258 | 0.000346 |
| Average | 167.9 | 93.3 | 0.231 | ||
| (±) | 1.9 | 1.4 | 0.023 |
Note: MilliQ® (Merck Millipore, Billerica, Ma, USA).
Abbreviations: PI, polydispersity index; KCps, Kilocounts per second; ZAve, average diameter.
Table S2.
NP ζ-potential measurements (MilliQ® water)
| Run | Angle | KCps | Mobility | ζ-potential | Width |
|---|---|---|---|---|---|
| 1 | 50.0 | 831.3 | 3.101 | 39.1 | 1.6 |
| 2 | 50.0 | 841.7 | 2.990 | 37.8 | 1.6 |
| 3 | 50.0 | 835.2 | 3.383 | 42.7 | 1.6 |
| 4 | 50.0 | 855.1 | 2.998 | 37.8 | 3.5 |
| 5 | 50.0 | 841.5 | 2.879 | 36.3 | 1.6 |
| Average | 841.0 | 3.070 | 38.8 | 2.0 | |
| (±) | 9.0 | 0.192 | 2.4 | 0.8 |
Note: MilliQ® (Merck Millipore, Billerica, Ma, USA).
Abbreviations: NP, nanoparticle; KCps, Kilocounts per second.
References
- 1.Liu S, Gonzalez YI, Danino D, Kaler EW. Macromolecules. 2005;38:2482–2491. [Google Scholar]
- 2.Samakande A, Hartmann PC, Sanderson RD. J Colloid Interface Sci. 2006;296(1):316–323. doi: 10.1016/j.jcis.2005.09.005. [DOI] [PubMed] [Google Scholar]
Acknowledgments
The authors gratefully acknowledge funding from the Italian Ministry of Health and Piemonte Region (grant “Giovani Ricercatori 2008,” GR-2008-1138087) and from the Associazione Italiana per la Ricerca sul Cancro (grant “MFAG 2012,” MFAG-13048). The authors thank Barbara Wade for her advice on the English language and Dr Andrea Liscio for atomic force microscopy measurements.
Footnotes
Disclosure
The authors report no conflicts of interest in this work.
References
- 1.Bergh J. Quo vadis with targeted drugs in the 21st century? J Clin Oncol. 2009;27(1):2–5. doi: 10.1200/JCO.2008.18.8342. [DOI] [PubMed] [Google Scholar]
- 2.Umemura S, Yumita N, Nishigaki R. Enhancement of ultrasonically induced cell damage by a gallium-porphyrin complex, ATX-70. Jpn J Cancer Res. 1993;84(5):582–588. doi: 10.1111/j.1349-7006.1993.tb00179.x. [DOI] [PMC free article] [PubMed] [Google Scholar]
- 3.Kuroki M, Hachimine K, Abe H, et al. Sonodynamic therapy of cancer using novel sonosensitizers. Anticancer Res. 2007;27(6A):3673–3677. [PubMed] [Google Scholar]
- 4.Tachibana K, Feril LB, Jr, Ikeda-Dantsuji Y. Sonodynamic therapy. Ultrasonics. 2008;48(4):253–259. doi: 10.1016/j.ultras.2008.02.003. [DOI] [PubMed] [Google Scholar]
- 5.Ashokkumar M. The characterization of acoustic cavitation bubbles – an overview. Ultrason Sonochem. 2011;18(4):864–872. doi: 10.1016/j.ultsonch.2010.11.016. [DOI] [PubMed] [Google Scholar]
- 6.Agostinis P, Berg K, Cengel KA, et al. Photodynamic therapy of cancer: an update. CA Cancer J Clin. 2011;61(4):250–281. doi: 10.3322/caac.20114. [DOI] [PMC free article] [PubMed] [Google Scholar]
- 7.Sazgarnia A, Shanei A, Meibodi NT, Eshghi H, Nassirli H. A novel nanosonosensitizer for sonodynamic therapy: in vivo study on a colon tumor model. J Ultrasound Med. 2011;30(10):1321–1329. doi: 10.7863/jum.2011.30.10.1321. [DOI] [PubMed] [Google Scholar]
- 8.Monasterolo C, Ballestri M, Sotgiu G, et al. Sulfonates-PMMA nanoparticles conjugates: a versatile system for multimodal application. Bioorg Med Chem. 2012;20(22):6640–6647. doi: 10.1016/j.bmc.2012.09.023. [DOI] [PubMed] [Google Scholar]
- 9.Samal SK, Dash M, Van Vlierberghe S, et al. Cationic polymers and their therapeutic potential. Chem Soc Rev. 2012;41(21):7147–7194. doi: 10.1039/c2cs35094g. [DOI] [PubMed] [Google Scholar]
- 10.Serpe L. Nanosonotechnology: the next challenge in cancer sonodynamic therapy. Nanotechnol Rev. 2012;1:173–182. [Google Scholar]
- 11.Megnin F, Faustino PJ, Lyon RC, Lelkes PI, Cohen JS. Studies on the mechanism of selective retention of porphyrins and metalloporphyrins by cancer cells. Biochim Biophys Acta. 1987;929(2):173–181. doi: 10.1016/0167-4889(87)90173-x. [DOI] [PubMed] [Google Scholar]
- 12.Binder S, Kolarova H, Tomankova K, Bajgar R, Daskova A, Mosinger J. Phototoxic effect of TPPS4 and MgTPPS4 on DNA fragmentation of HeLa cells. Toxicol In Vitro. 2011;25(6):1169–1172. doi: 10.1016/j.tiv.2010.11.005. [DOI] [PubMed] [Google Scholar]
- 13.Wang JT, Giuntini F, Eggleston IM, Bown SG, MacRobert AJ. Photochemical internalisation of a macromolecular protein toxin using a cell penetrating peptide-photosensitiser conjugate. J Control Release. 2012;157(2):305–313. doi: 10.1016/j.jconrel.2011.08.025. [DOI] [PubMed] [Google Scholar]
- 14.Ogden JA, Toth-Kischkat A, Schultheiss R. Principles of shock wave therapy. Clin Orthop Relat Res. 2001;(387):8–17. doi: 10.1097/00003086-200106000-00003. [DOI] [PubMed] [Google Scholar]
- 15.Canaparo R, Serpe L, Catalano MG, et al. High energy shock waves (HESW) for sonodynamic therapy: effects on HT-29 human colon cancer cells. Anticancer Res. 2006;26(5A):3337–3342. [PubMed] [Google Scholar]
- 16.Serpe L, Canaparo R, Berta L, Bargoni A, Zara GP, Frairia R. High energy shock waves and 5-aminolevulinic for sonodynamic therapy: effects in a syngeneic model of colon cancer. Technol Cancer Res Treat. 2011;10(1):85–93. doi: 10.7785/tcrt.2012.500182. [DOI] [PubMed] [Google Scholar]
- 17.Maris JM. Recent advances in neuroblastoma. N Engl J Med. 2010;362(23):2202–2211. doi: 10.1056/NEJMra0804577. [DOI] [PMC free article] [PubMed] [Google Scholar]
- 18.Maris JM, Hogarty MD, Bagatell R, Cohn SL. Neuroblastoma. Lancet. 2007;369(9579):2106–2120. doi: 10.1016/S0140-6736(07)60983-0. [DOI] [PubMed] [Google Scholar]
- 19.Friedrich J, Seidel C, Ebner R, Kunz-Schughart LA. Spheroid-based drug screen: considerations and practical approach. Nat Protoc. 2009;4(3):309–324. doi: 10.1038/nprot.2008.226. [DOI] [PubMed] [Google Scholar]
- 20.Bruns T, Peter J, Hagel S, Herrmann A, Stallmach A. The augmented neutrophil respiratory burst in response to Escherichia coli is reduced in liver cirrhosis during infection. Clin Exp Immunol. 2011;164(3):346–356. doi: 10.1111/j.1365-2249.2011.04373.x. [DOI] [PMC free article] [PubMed] [Google Scholar]
- 21.Eruslanov E, Kusmartsev S. Identification of ROS using oxidized DCFDA and flow-cytometry. Methods Mol Biol. 2010;594:57–72. doi: 10.1007/978-1-60761-411-1_4. [DOI] [PubMed] [Google Scholar]
- 22.Bustin SA, Benes V, Garson JA, et al. The MIQE guidelines: minimum information for publication of quantitative real-time PCR experiments. Clin Chem. 2009;55(4):611–622. doi: 10.1373/clinchem.2008.112797. [DOI] [PubMed] [Google Scholar]
- 23.Suslick KS, Flannigan DJ. Inside a collapsing bubble: sonoluminescence and the conditions during cavitation. Annu Rev Phys Chem. 2008;59:659–683. doi: 10.1146/annurev.physchem.59.032607.093739. [DOI] [PubMed] [Google Scholar]
- 24.Tuziuti T, Yasui K, Sivakumar M, Iida Y, Miyoshi N. Correlation between acoustic cavitation noise and yield enhancement of sonochemical reaction by particle addition. J Phys Chem A. 2005;109(21):4869–4872. doi: 10.1021/jp0503516. [DOI] [PubMed] [Google Scholar]
- 25.Lukšienė Ž, Rutkovskienė L, Jurkonienė S, Maksimov G, Griciūtė L. Evaluation of the photobiological efficiency of TPPS4 in two different types of mice tumors. Acta Medica Lituanica. 2002;9(1):5. [Google Scholar]
- 26.Royall JA, Ischiropoulos H. Evaluation of 2,7-dichlorofluorescin and dihydrorhodamine 123 as fluorescent probes for intracellular H2O2 in cultured endothelial cells. Arch Biochem Biophys. 1993;302(2):348–355. doi: 10.1006/abbi.1993.1222. [DOI] [PubMed] [Google Scholar]
- 27.Ow YP, Green DR, Hao Z, Mak TW. Cytochrome c: functions beyond respiration. Nat Rev Mol Cell Biol. 2008;9(7):532–542. doi: 10.1038/nrm2434. [DOI] [PubMed] [Google Scholar]
- 28.Trachootham D, Lu W, Ogasawara MA, Nilsa RD, Huang P. Redox regulation of cell survival. Antioxid Redox Signal. 2008;10(8):1343–1374. doi: 10.1089/ars.2007.1957. [DOI] [PMC free article] [PubMed] [Google Scholar]
- 29.Kowaltowski AJ, Castilho RF, Vercesi AE. Mitochondrial permeability transition and oxidative stress. FEBS Lett. 2001;495(1–2):12–15. doi: 10.1016/s0014-5793(01)02316-x. [DOI] [PubMed] [Google Scholar]
- 30.Shi X, Zhou B. The role of Nrf2 and MAPK pathways in PFOS-induced oxidative stress in zebrafish embryos. Toxicol Sci. 2010;115(2):391–400. doi: 10.1093/toxsci/kfq066. [DOI] [PubMed] [Google Scholar]
- 31.Bensaad K, Cheung EC, Vousden KH. Modulation of intracellular ROS levels by TIGAR controls autophagy. EMBO J. 2009;28(19):3015–3026. doi: 10.1038/emboj.2009.242. [DOI] [PMC free article] [PubMed] [Google Scholar]
- 32.Puzio-Kuter AM. The Role of p53 in metabolic regulation. Genes Cancer. 2011;2(4):385–391. doi: 10.1177/1947601911409738. [DOI] [PMC free article] [PubMed] [Google Scholar]
- 33.Johnson GL, Lapadat R. Mitogen-activated protein kinase pathways mediated by ERK, JNK, and p38 protein kinases. Science. 2002;298(5600):1911–1912. doi: 10.1126/science.1072682. [DOI] [PubMed] [Google Scholar]
Associated Data
This section collects any data citations, data availability statements, or supplementary materials included in this article.
Supplementary Materials
Monomer synthesis.
1HNMR of compound 2; D2O, 400 MHz.
Note: This report was created by ACD/NMR Processor Academic Edition. For more information go to www.acdlabs.com/nmrproc/.
13CNMR of compound 2; D2O, 100 MHz.
Note: This report was created by ACD/NMR Processor Academic Edition. For more information go to www.acdlabs.com/nmrproc/.
Nanoparticle titration curve (A) and loading calibration curve (B).
TPPS (A) and TPPS-NPs (B) absorbance and photoluminescence spectra.
Abbreviations: TPPS, meso-tetrakis (4-sulfonatophenyl) porphyrin; NPs, nanoparticles.
(A) Emission (fluorescence) spectra of TPPS-NPs (100 μg/mg) in different medium. (B–D) Release experiments: (B) in PBS 150 mM at +37°C, emission (fluorescence) spectra of the filtrates at different times; (C) in culture medium at +37°C, emission (fluorescence) spectra of the filtrates at different times; (D) in culture medium at +37°C, absorbance spectra of the filtrates at different times.
Notes: In order for the curves to be at least partially in the scale range, we needed to reduce spectrofluorometer slit from 15 (completely opened) to 10. Absorbance spectra of the filtrates obtained from PBS release experiments have not been reported because they are below the detectable threshold.
Abbreviations: h, hours; TPPS, meso-tetrakis (4-sulfonatophenyl) porphyrin; NPs, nanoparticles; PBS, phosphate-buffered saline.
Table S1.
Hydrodynamic diameter measurements by dynamic light scattering (MilliQ® water at +25°C)
| Run | Angle | KCps | ZAve | PI | Fit |
|---|---|---|---|---|---|
| 1 | 90.0 | 165.4 | 95.7 | 0.201 | 0.000276 |
| 2 | 90.0 | 166.5 | 92.2 | 0.221 | 0.000190 |
| 3 | 90.0 | 168.5 | 92.4 | 0.248 | 0.000152 |
| 4 | 90.0 | 168.7 | 93.1 | 0.226 | 0.000195 |
| 5 | 90.0 | 170.3 | 93.1 | 0.258 | 0.000346 |
| Average | 167.9 | 93.3 | 0.231 | ||
| (±) | 1.9 | 1.4 | 0.023 |
Note: MilliQ® (Merck Millipore, Billerica, Ma, USA).
Abbreviations: PI, polydispersity index; KCps, Kilocounts per second; ZAve, average diameter.
Table S2.
NP ζ-potential measurements (MilliQ® water)
| Run | Angle | KCps | Mobility | ζ-potential | Width |
|---|---|---|---|---|---|
| 1 | 50.0 | 831.3 | 3.101 | 39.1 | 1.6 |
| 2 | 50.0 | 841.7 | 2.990 | 37.8 | 1.6 |
| 3 | 50.0 | 835.2 | 3.383 | 42.7 | 1.6 |
| 4 | 50.0 | 855.1 | 2.998 | 37.8 | 3.5 |
| 5 | 50.0 | 841.5 | 2.879 | 36.3 | 1.6 |
| Average | 841.0 | 3.070 | 38.8 | 2.0 | |
| (±) | 9.0 | 0.192 | 2.4 | 0.8 |
Note: MilliQ® (Merck Millipore, Billerica, Ma, USA).
Abbreviations: NP, nanoparticle; KCps, Kilocounts per second.