

Abstract
Background
We have shown that individually, dietary fiber and protein increase secretion of the anorexigenic and insulinotropic hormone, glucagon-like peptide-1 (GLP-1).
Objective
Our objective was to combine, in one diet, high levels of fiber and protein to maximize GLP-1 secretion, improve glucose tolerance, and reduce weight gain.
Methods and Procedures
Lean (+/?) and obese (cp/cp) male James C Russell corpulent (JCR:LA-cp) rats lacking a functional leptin receptor were fed one of four experimental diets (control, high protein (HP), high fiber (HF, prebiotic fiber inulin), or combination (CB)) for 3 weeks. An oral glucose tolerance test (OGTT) was performed to evaluate plasma GLP-1, insulin and glucose. Plasma lipids and intestinal proglucagon mRNA expression were determined.
Results
Energy intake was lower with the HF diet in lean and obese rats. Weight gain did not differ between diets. Higher colonic proglucagon mRNA in lean rats fed a CB diet was associated with higher GLP-1 secretion during OGTT. The HP diet significantly reduced plasma glucose area under the curve (AUC) during OGTT in obese rats, which reflected both an increased GLP-1 AUC and higher fasting insulin. Diets containing inulin resulted in the lowest plasma triglyceride and total cholesterol levels.
Discussion
Overall, combining HP with HF in the diet increased GLP-1 secretion in response to oral glucose, but did not improve glucose tolerance or lipid profiles more than the HF diet alone did. We also suggest that glycemic and insulinemic response to prebiotics differ among rat models and future research work should examine their role in improving glucose tolerance in diet-induced vs. genetic obesity with overt hyperleptinemia.
INTRODUCTION
Oligofructose and inulin are unique soluble dietary fibers, known as prebiotic fibers, which are non-gel-forming; they selectively stimulate lactic-acid bacteria growth in the gut and show promise in regulating glucose control and obesity (1). Inulin is chiefly extracted from chicory root and has a degree of polymerization or a number of glucose or fructose units of 2 to ≥60 (2). High performance inulin has small molecular weight oligomers removed and an average degree of polymerization >23. Partial enzymatic hydrolysis of inulin results in production of oligofructose, which has a degree of polymerization <10. In humans, oligofructose has been shown to enhance satiety (3), improve glucose control in hyperglycaemic subjects (4), raise levels of plasma glucagon-like peptide-1 (GLP-1), (5) and improve blood lipid profiles (6). GLP-1 is a potent insulinotropic hormone (released from intestinal L cells in response to nutrients), that lowers blood glucose, inhibits food intake, decreases glucagon secretion, and enhances β-cell neogenesis (7).
It is generally accepted that the addition of fermentable fiber to a diet results in significant gains in the distal small intestine and large bowel mass (8). These changes may be associated with increased expression and secretion of gut hormones. We have shown that mixed dietary fibers and especially fermentable dietary fibers are able to increase distal gut mass, enhance GLP-1 secretion and upregulate proglucagon mRNA expression in rats (9–11).
In rats the specific fermentable fibers, inulin and oligofructose, have been shown to reduce hepatic triglyceride content and counteract fat mass development in both normal and obese Zucker rats (12,13). However, while fructans effectively lower plasma triglyceride concentrations in normal rats, obese Zucker rats were resistant to this hypotriglyceridemic effect (14). In the streptozotocin-treated rat, Cani et al. (15,16) have also demonstrated that oligofructose lowers post-prandial glycemia and partially restores insulin secretion. Supplementing a high fat, carbohydrate free diet with oligofructose reduces body weight, epidydimal fat mass, and glycemia in mice (16) and these effects are mediated in part through satiety (12,13,17). Most recently, Cani et al. (18) have demonstrated convincingly that the improvements in glucose tolerance seen with oligofructose consumption require a functional GLP-1 receptor. The beneficial effects of fructans in animal studies have generally been observed with diet compositions of ~10% oligofructose on a weight basis (12–15,18,19). In humans, an intake of ~10–20 g/day has generally been found to be effective yet produce few gastrointestinal complaints (20).
Compared to high-carbohydrate or high-fat meals, high protein (HP) meals contribute to increased satiety and reduced subsequent energy intake (21,22). Several studies have recently shown that part of the modulation of satiety by dietary protein may be related to increased secretion of GLP-1 (23–25). Although the number of L cells is highest in the distal colon, it is plausible that dietary protein, which is largely digested and absorbed along the length of the small intestine (26–29), contributes to increased plasma concentrations by stimulating the release of GLP-1 from L cells located proximally in the gut. In fact, we have previously shown that two protein sources, meat hydrolysate and essential amino acids are potent direct stimulators of GLP-1 release in vitro in the human enteroendocrine NCI-H716 cell line (30,31).
Given the potential benefits of GLP-1’s anti-diabetic and anti-obesity effects, we set out to formulate an overall dietary composition that would maximize the endogenous secretion of GLP-1 by targeting both the proximal gut with increased protein content and the distal gut with increased fiber content. To this end, the objective of this work was to evaluate the effects of a high fiber (HF) (using the prebiotic fiber inulin), a HP or a combination (CB) diet containing high levels of both fiber and protein on body weight, glucose control and blood lipid response in the genetically obese and insulin resistant James C Russell corpulent (JCR:LA-cp) rat. Given our previous work demonstrating the individual ability of dietary fiber and protein to stimulate GLP-1 secretion, we hypothesized that a CB diet would result in greater GLP-1 secretion than either diet alone.
METHODS AND PROCEDURES
Heterozygous and lean (+/?) and homozygous and obese (cp/cp) JCR:LA-cp male rats were bred in the established colony at the University of Alberta, Edmonton, Canada. At 7 weeks of age the animals were transported to the University of Calgary, Calgary, Canada and housed in a temperature and humidity controlled room with a reverse 12-h light, 12-h dark cycle. The JCR:LA-cp rat displays the autosomal recessive cp gene originally isolated by Koletsky (32). This strain was chosen because (cp/cp) male rats lack the isoforms of the ObR leptin receptor and are severely obese, hyperphagic, hypertriglyceridemic, hyperinsulinemic and markedly insulin resistant (33,34). It is unique because it is only one of five major strains with the cp gene to develop atherosclerotic and myocardial lesions from an early age (35). In addition, these rats exhibit several attributes typical of the obese/diabetic/hypertensive/dyslipidemic syndrome (metabolic syndrome) observed in human subjects (36). The protocol was approved by the University of Calgary Animal Welfare Committee. Animals were maintained on a nonpurified diet (5P14 ModRod PQ, PMI Nutrition International, Brentwood, MO) before the experimental period. During the experiment, animals were randomized to one of four experimental diets for 3 weeks (8 rats/group; 8 weeks of age at initiation). Initial body weight at randomization did not differ between diet groups within the lean or obese groups (231.5 ± 5.5 g and 332.1 ± 9.5 g, respectively). The composition of the experimental diets is given in Table 1. Inulin was supplied as 9 g/100 g diet in the fiber containing diets (Orafti Raftiline HP, Quadra Chemicals, Burlington, ON, Canada). Raftiline HP (Orafti) is a mixture of glucosyl-(fructosyl)n and (fructosyl)m-fructose with an average degree of polymerization of 25. Casein content was approximately double in the HP and CB diets compared to control and HF diets. The energy value of the control and HP diets was 15.1 MJ/kg (3.61 kcal/g) and 14.3 MJ/kg (3.42 kcal/g) for the HF and CB diets. Food intake was recorded daily and body weight weekly.
Table 1.
Experimental diet composition
| Composition (g/kg) | Controla | High protein | High fiber | Combination |
|---|---|---|---|---|
| Cornstarch | 466 | 318 | 376 | 228 |
| Casein | 140 | 287 | 140 | 287 |
| Dextrinized cornstarch | 155 | 155 | 155 | 155 |
| Sucrose | 100 | 100 | 100 | 100 |
| Soybean oil | 40 | 40 | 40 | 40 |
| Alphacel | 50 | 50 | 50 | 50 |
| AIN-93M-MX | 35 | 35 | 35 | 35 |
| L-cystine | 1.8 | 1.8 | 1.8 | 1.8 |
| AIN-93-VX | 10 | 10 | 10 | 10 |
| Choline bitartrate | 2.5 | 2.5 | 2.5 | 2.5 |
| Inulinb | – | – | 90 | 90 |
| % Energy from carbohydrate | 76 | 61 | 76 | 61 |
| % Energy from protein | 14 | 29 | 14 | 29 |
| % Energy from fat | 10 | 10 | 10 | 10 |
Based on AIN-93M purified diet for the maintenance of adult rats.
Inulin supplied as Orafti Raftiline HP (Quadra Chemicals, Canada).
Oral glucose tolerance test
An oral glucose tolerance test (OGTT) was performed according to our previous work using cardiac blood sampling (9,10). Briefly, rats were anesthetized with Halothane and a fasting cardiac blood sample obtained. The anesthetic was removed and a 2 g/kg body weight dose of dextrose was administered by gavage. Additional cardiac blood samples were drawn from each rat under anesthetic at t = 30 and 60 min post-gavage. Blood was collected with the addition of EDTA (1 mg/ml) and aprotinin (5 × 10⁵ kIU/l; Sigma, Oakville, ON, Canada). Diprotin A, an inhibitor of dipeptidyl peptidase IV was added at 34 μg/ml (Calbiochem, La Jolla, CA) to inhibit GLP-1 degradation (37). Blood was centrifuged at 1,600g for 15 min at 4 °C and plasma stored at −80 °C until analysis by radioimmunoassay. At the end of the glucose tolerance test, the small intestine and colon were excised, weighed, and length measured under tension with a clip weighing 5 g. A 3-cm segment of the distal duodenum, jejunum, ileum, and proximal colon were then flushed with ice-cold saline, immersed in liquid nitrogen, and stored at −80 °C for later mRNA analysis.
Radioimmunoassays and biochemistry
Blood glucose concentrations were determined using glucose Trinder enzymatic assay (Sigma, Oakville, ON, Canada). Area under the curve (AUC) was determined as described by Massimino et al. (38) and reflects the area above baseline. Radioimmunoassay kits for insulin and ELISA kits for active GLP-1 (7–36 amide) were obtained from Linco Research (St. Charles, MO). Blood lipids were measured by Calgary Laboratory Services (Calgary, AB, Canada) using commercially available enzymatic colorimetric assays (WAKO Chemicals USA, Richmond, VA).
RNA isolation and real-time quantitative polymerase chain reaction
Total RNA was extracted from the small intestine and colon using TRIzol reagent (Invitrogen, Burlington, ON, Canada) (39). Reverse transcription was performed with an input of 1 μg of total RNA using the first strand cDNA synthesis kit for real-time quantitative polymerase chain reaction (PCR) (Invitrogen, Burlington, ON, Canada) with oligo d(T)15 as a primer. The resultant cDNA was amplified using primers synthesized by University of Calgary Core DNA Services (Calgary, AB, Canada) and analyzed by real time-PCR. Primers used for amplification of cDNAs of interest were: 5′-ACCGCCCTGAGATTACTTTTCTG-3′ (forward) and 5′-AGTTCTCTTTCCAGGTTCACCAC-3′ (reverse) for proglucagon gene and 5′-TATCGGCAATGAGCGGTTCC-3′ (forward) and 5′-AGCACTGTGTTGGLATAGAGG-3′ (reverse) for actin gene. The PCR was heated for 1 min 30 s, then 40 cycles at 95 °C for 30 s, 60 °C for 30 s and 72 °C for 20 s in a DNA iCycler apparatus (BIO-RAD, Mississauga, ON, Canada). A melt curve showed the melting point of the PCR product of interest. Actin primers were included as an internal control. The 2−ΔΔCT method was utilized for the data analysis where threshold cycle (CT) indicates the fractional cycle number at which the amount of amplified target reaches a fixed threshold (40). The ΔCT is the difference in threshold cycles for proglucagon and actin and the ΔΔCT is the difference between the ΔCT for treatment diets and the ΔCT for control diet. Relative expression levels are presented as fold changes to the control group (for which levels were set to 1).
Statistics
All data are presented as mean ± s.e.m. Differences between treatments were determined using one-way ANOVA and Fisher’s multiple comparison post-hoc test (P ≤ 0.05) with SPSS software (SPSS, Chicago, IL).
RESULTS
Caloric intake and weight gain
In lean rats, the HF and CB diet groups had significantly lower average caloric intake (kcal/day) compared to the control (C) group (Table 2). The HP group had intermediate caloric intake. In the obese rats, the HF diet resulted in the lowest caloric intake. No differences were seen in weight gain over the 3-week intervention period (Table 2).
Table 2.
Food intake and body weight changes in lean and obese JCR:LA-cp rats over a 3-week feeding period
| Group | Diet | Food intake (g/day) | Caloric intake (kcal/day) | Final body weight (g) | Weight gain (g) |
|---|---|---|---|---|---|
| Lean | C | 22.9 ± 1.5 | 87.1 ± 5.6a | 279.4 ± 8.8 | 44.6 ± 3.5 |
| HP | 20.1 ± 1.0 | 76.6 ± 3.7a,b | 280.5 ± 10.4 | 43.8 ± 4.6 | |
| HF | 20.5 ± 1.8 | 72.9 ± 6.3b | 270.6 ± 10.5 | 40.6 ± 2.8 | |
| CB | 19.8 ± 0.8 | 70.7 ± 2.8b | 271.2 ± 23.4 | 46.5 ± 4.7 | |
| Obese | C | 34.9 ± 1.7 | 133.1 ± 6.5a | 411.4 ± 17.0 | 78.2 ± 5.0 |
| HP | 34.1 ± 2.3 | 130.0 ± 8.8a | 429.4 ± 21.5 | 82.3 ± 4.3 | |
| HF | 30.8 ± 1.7 | 109.5 ± 6.2b | 392.3 ± 17.2 | 75.7 ± 5.0 | |
| CB | 33.5 ± 1.2 | 119.3 ± 4.4a,b | 419.7 ± 16.2 | 88.2 ± 5.5 |
Values are mean ± s.e.m. (n = 8 rats/group). Weight gain represents final body weight minus initial body weight. Food intake represents average grams of food eaten per day over the 3-week feeding period. Caloric intake represents average energy intake per day over the 3-week feeding period. Values with different letters represent a significant difference between diets within either the lean or obese groups (P < 0.05).
C, control diet; CB, combination; HF, high fiber; HP, high protein; JCR:LA-cp; James C Russell corpulent.
Intestinal characteristics
Consistent with the known effects of dietary fiber on colonic mass we saw a significant increase in colon weight with the inulin-containing diets, HF and CB, in lean and obese rats (Table 3) compared to C and HP. Colon length was also significantly greater in HF and CB groups in obese rats and in CB lean rats. In the small intestine, the CB diet significantly increased overall mass compared to all other diets in the lean and obese rats. Small intestine length was also significantly greater in the CB group compared to C and HF in the lean rats but not different from the HP group.
Table 3.
Intestine characteristics of lean and obese JCR: LA-cp rats
| Group | Diet | Small intestine length (cm) | Small intestine weight (g) | Colon length (cm) | Colon weight (g) |
|---|---|---|---|---|---|
| Lean | C | 100.3 ± 1.8a | 4.8 ± 0.1a | 15.3 ± 0.5a,b | 0.83 ± 0.05a |
| HP | 102.2 ± 2.0a,b | 4.7 ± 0.2a | 15.1 ± 0.6a | 0.92 ± 0.19a,b | |
| HF | 100.1 ± 1.3a | 5.1 ± 0.2a | 16.3 ± 0.8a,b | 1.12 ± 0.08b | |
| CB | 106.0 ± 1.6b | 5.7 ± 0.2b | 16.9 ± 0.6b | 1.10 ± 0.06b | |
| Obese | C | 115.1 ± 2.0 | 7.1 ± 0.2a | 16.6 ± 0.5a | 0.89 ± 0.07a |
| HP | 120.3 ± 1.9 | 7.1 ± 0.2a,b | 17.8 ± 0.6a,b | 0.82 ± 0.05a | |
| HF | 117.3 ± 3.5 | 7.6 ± 0.3a | 19.1 ± 1.2b | 1.30 ± 0.08b | |
| CB | 119.9 ± 1.8 | 8.5 ± 0.2c | 19.1 ± 0.7b | 1.38 ± 0.06b |
Values are mean ± s.e.m. (n = 8 rats/group). Values with different letters represent a significant difference between diets within either the lean or obese groups (P < 0.05).
C, control diet; CB, combination; HF, high fiber; HP, high protein; JCR:LA-cp; James C Russell corpulent.
Plasma lipids
In the lean rats, high density lipoprotein (HDL) levels were significantly higher in the HP rats compared to those on any other diet (Table 4). The CB group had significantly higher HDL than the C and HF groups but lower levels than the HP group. Low-density lipoprotein (LDL) levels were significantly lower in the HF and CB groups compared to the HP group but did not differ from the control group. Total cholesterol levels reflected these patterns with the highest levels seen in the HP rats compared to all other diet treatments.
Table 4.
Blood lipids of lean and obese JCR rats at the end of a 3-week feeding period
| Group | Diet | Triglycerides (mmol/l) | HDL (mmol/l) | LDL (mmol/l) | Total Cholesterol (mmol/l) |
|---|---|---|---|---|---|
| Lean | C | 0.58 ± 0.08 | 0.95 ± 0.04a | 0.10 ± 0.04a,b | 1.30 ± 0.06a |
| HP | 0.43 ± 0.07 | 1.24 ± 0.02b | 0.20 ± 0.05b | 1.64 ± 0.04b | |
| HF | 0.56 ± 0.09 | 0.89 ± 0.03a | 0.05 ± 0.03a,c | 1.20 ± 0.04a | |
| CB | 0.47 ± 0.06 | 1.07 ± 0.05c | 0.08 ± 0.04a,c | 1.35 ± 0.07a | |
| Obese | C | 3.80 ± 0.47a | 2.16 ± 0.19a,b | 0.46 ± 0.18 | 4.12 ± 0.31a |
| HP | 3.88 ± 0.41a | 2.33 ± 0.17a | 0.33 ± 0.18 | 4.09 ± 0.40a,c | |
| HF | 2.00 ± 0.27b | 1.77 ± 0.17b | 0.18 ± 0.11 | 2.60 ± 0.27b | |
| CB | 2.47 ± 0.32b | 2.06 ± 0.08a,b | 0.19 ± 0.06 | 3.30 ± 0.16b,c |
Values are mean ± s.e.m. (n = 8 rats/group). Values with different letters represent a significant difference between diets within either the lean or obese groups (P < 0.05).
C, control diet; CB, combination; HF, high fiber; HP, high protein; JCR:LA-cp; James C Russell corpulent.
In obese rats, plasma triglycerides were significantly lower in the HF and CB groups compared to C and HP (Table 4). HDL levels were significantly higher in the HP rats compared to the HF rats, but not different from C and CB. The levels of LDL in the HF and CB groups were nearly half those seen in the C and HP groups but this was not significantly different. Reflective of reduced HDL and LDL, the total cholesterol was lowest in the HF rats, highest in the C and HP rats and levels in the CB diet were intermediate between the HF and HP diets.
OGTT
In support of our hypothesis, plasma GLP-1 levels in the lean rats when fasting and 30 and 60 min after glucose gavage were significantly higher in the CB group than the control and HF groups (Figure 1). However, given the higher fasting levels and reduced incremental rise over time, there were no significant differences in GLP-1 AUC between the four groups. In obese rats, GLP-1 levels when fasting were also significantly higher in CB vs. HP (Figure 1) and also tended to be higher than HP at 30 min post-gavage and higher than C at 60 min post-gavage (P = 0.08). Given the prolonged rise of GLP-1 levels with a HP diet over time, incremental AUC was significantly greater in HP than in control rats, with HF and CB found intermediate between the two.
Figure 1.

Plasma glucagon-like peptide-1 (GLP-1) in response to an oral glucose load in lean and obese rats after the 3-week dietary intervention period. Results represent the mean ± s.e.m. for eight lean rats in each diet group. The left hand panel represents the lean (+/?) rats. Open circles, control diet (C); open squares, high protein (HP); open triangles, high fiber (HF); open diamonds, combination (CB). The CB diet had significantly higher GLP-1 levels vs. the C and HF diet at t = 0, 30 and 60 min (P ≤ 0.05). The insert represents the area under the curve (AUC) for each diet treatment. No significant differences were found in AUC in lean rats. The right hand panel represents the obese (cp/cp) rats. The CB diet had significantly higher fasting GLP-1 levels vs. the HP diet (P ≤ 0.05). For the AUC insert, treatments with different letters are significantly different (P ≤ 0.05).
There were no significant differences between diet treatments among lean rats for plasma insulin levels at timings of 0, 30, or 60 min post-gavage. Among the lean rats, no diet differences were seen for insulin AUC (Figure 2). Among obese rats, the HP diet had significantly higher fasting insulin levels compared to all other diets (Figure 2). By 60 min post-gavage, the obese CB group had significantly lower insulin levels compared to the obese control group. No diet differences were seen in AUC for insulin among the obese rats.
Figure 2.
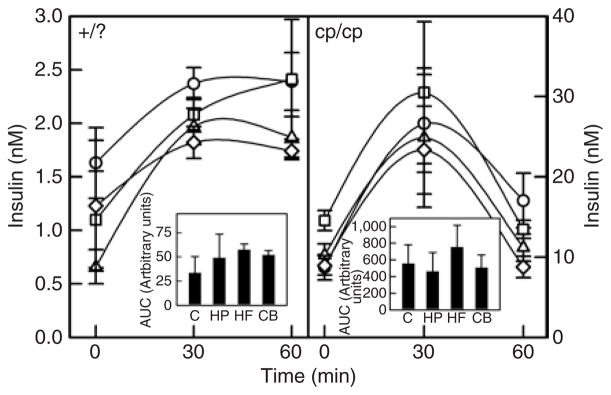
Plasma insulin in response to an oral glucose load in lean and obese rats. Results represent the mean ± s.e.m. for eight lean rats in each diet group. The left hand panel represents the lean (+/?) rats. Open circles, control diet (C); open squares, high protein (HP); open triangles, high fiber (HF); open diamonds, combination (CB). There were no significant differences between diet groups at time = 0, 30 or 60 min for lean rats. The insert represents the area under the curve (AUC) for each diet treatment. No significant differences were found in AUC for lean rats. The right hand panel represents the obese (cp/cp) rats. At fasting (t = 0), the HP diet had significantly higher insulin levels vs. all other diets (P ≤ 0.05). At t = 60 min the CB diet had significantly lower insulin than the C (P ≤ 0.05). No significant differences were found in AUC for obese rats.
No significant differences in plasma glucose concentrations were seen at any time point in lean rats during the OGTT and no differences observed in AUC for glucose (Figure 3). In obese rats, the CB diet resulted in significantly lower fasting glucose levels compared to the control and HP diets (Figure 3). The AUC for glucose was, however, significantly lower for the HP diet compared to the control and CB diet. The blunted rise in plasma glucose levels in response to oral glucose in our lean and obese rats is consistent with previous findings in this model (41–43).
Figure 3.

Plasma glucose in response to an oral glucose load in lean and obese rats. Results represent the mean ± s.e.m. for eight lean rats in each diet group. The left hand panel represents the lean (+/?) rats. Open circles, control diet (C); open squares, high protein (HP); open triangles, high fiber (HF); open diamonds, combination (CB). There were no significant differences in plasma glucose between diet treatments in lean rats. Insert represents the area under the curve (AUC) for each diet treatment. No significant differences were found in AUC for lean rats. The right hand panel represents the obese (cp/cp) rats. The CB diet had significantly lower fasting glucose levels compared to the C and HP diet (P ≤ 0.05). For the AUC insert, treatments with different letters are significantly different (P ≤ 0.05).
Gene expression
Proglucagon mRNA expression was significantly higher in the duodenum and jejunum of lean rats fed the HP vs. HF diet (Table 5). In the colon, the lean rats fed the CB diet had a significantly higher proglucagon mRNA expression compared to the HP and HF groups. Despite a nearly fourfold increase in colonic proglucagon in the obese rats with the protein and fiber diets, no significant differences were detected in any of the intestinal segments.
Table 5.
Fold changes in proglucagon mRNA expression in lean and obese JCR:LA rats
| Group | Diet | Duodenal proglucagon | Jejunal proglucagon | Ileal proglucagon | Colonic proglucagon |
|---|---|---|---|---|---|
| Lean | C | 1.0 ± 0.09a,b | 1.0 ± 0.6a,b | 1.0 ± 0.3 | 1.0 ± 0.15a,b |
| HP | 1.2 ± 0.2b | 1.7 ± 1.4b | 1.1 ± 0.6 | 0.5 ± 0.4b | |
| HF | 0.7 ± 0.2a,c | 0.4 ± 0.4a,c | 1.3 ± 1.0 | 0.7 ± 0.6b | |
| CB | 0.8 ± 0.5a,b | 1.4 ± 0.4b | 1.1 ± 0.4 | 1.9 ± 1.9a | |
| Obese | C | 1.0 ± 0.07 | 1.0 ± 0.8 | 1.0 ± 0.2 | 1.0 ± 0.23 |
| HP | 0.8 ± 0.1 | 1.8 ± 2.0 | 1.0 ± 0.6 | 3.5 ± 5.2 | |
| HF | 0.9 ± 0.2 | 1.0 ± 0.5 | 0.9 ± 0.4 | 3.8 ± 5.0 | |
| CB | 0.7 ± 0.4 | 1.0 ± 0.7 | 1.1 ± 0.9 | 3.8 ± 3.2 |
Values are mean ± s.e.m. of fold changes from the control diet group (n = 8 rats/group). Values with different letters represent a significant difference between diets within either the lean or obese groups (P < 0.05).
C, control diet; CB, combination; HF, high fiber; HP, high protein; JCR:LA-cp; James C Russell corpulent.
DISCUSSION
Independently, we have shown that diets high in fermentable fiber increase GLP-1 secretion in rats (9,10) and that meat hydrolysate and essential amino acids increase GLP-1 secretion in a human intestinal cell line (30,31). Delzenne et al. have also shown that prebiotic fibers specifically are able to reduce energy intake and body weight in rats (13,15,19). Our objective was to design a diet that combined the ability of dietary fiber to promote GLP-1 production in the distal gut with dietary protein to stimulate GLP-1 secretion from the proximal gut. We hereby report that combining HP with HF in the same diet results in maximal secretion of GLP-1 during an OGTT, and maximal upregulation of colonic proglucagon mRNA in lean rats compared to either diet component taken individually. However, other metabolic improvements seen with the CB diet were no greater in magnitude than those observed with the HF diet alone. Reductions in caloric intake, increases in colonic length and mass, and decreases in plasma triglycerides, and total cholesterol were equally seen in the HF and CB diet groups. In general these changes were seen in both lean and obese rats with the exception of the triglyceride lowering action of the CB diet, which was marked in the obese rats and not in lean rats. Although glycemia was improved by the HP diet in obese rats, no change was seen in lean rats or with the inulin-containing diets.
Supporting our hypothesis we did observe significantly greater proglucagon expression in the jejunum and colon of lean rats fed the CB diet, suggesting it may be possible to target specific sites along the intestine with appropriate fuels to increase GLP-1 production. Dietary fibers are not susceptible to digestion by human enzymes but are metabolized by bacteria in distal segments of the gut including the cecum and colon (8). Many studies have shown that dietary fibers, especially the fermentable fibers, upregulate proglucagon expression in the colon and stimulate greater GLP-1 release into the bloodstream in response to nutrients (9,10,15,18,19). Dietary protein, however, is chiefly digested and absorbed by the time it reaches the ileum (44) and could therefore be seen as a preferential fuel for proglucagon producing cells in the proximal gut. Although we are not aware of reports of altered proglucagon expression along the length of the gut with increased dietary protein, studies in humans have shown an increase in GLP-1 secretion following the consumption of a HP diet over 36 h or a single HP meal (23–25). In these lean rats there was a significant upregulation of proglucagon expression in the duodenum and jejunum of rats consuming the HP diet rather than those consuming the HF diet. Elevated expression of proglucagon in the colon of rats consuming the HP diet may be partially due to the greater endogenous protein losses observed with HP diets (44). The endogenous sources of protein, including desquamated cells, digestive enzymes and mucins, could act in the terminal ileum and more distal sites to upregulate proglucagon.
The increased proglucagon expression observed in the jejunum and colon may explain in part the significantly higher GLP-1 levels (at the time points of 0, 30, and 60 min when taking the OGTT) with the CB diet, when compared to the control and HF diets. When expressed as an incremental AUC, however, the CB diet was no better than the other diets in sustained elevated GLP-1 levels. This does not preclude, however, the possible physiological effects of the higher fasting and sustained GLP-1 levels present in the plasma of rats fed the CB diet. While AUC may represent the secretory capacity for GLP-1, the sustained basal levels of GLP-1 may impact GLP-1 availability and function. Indeed, Pannacciulli et al. (45) have recently shown that higher fasting plasma GLP-1 concentrations are associated with higher rates of energy expenditure and fat oxidation in humans. While many other studies sample peripheral blood as we did for GLP-1 analysis, it is known that GLP-1 is subject to rapid degradation by dipeptidyl peptide IV and it is possible that only 10–15% of intact GLP-1 reaches the systemic circulation (46). Our ability to detect a response in peripheral GLP-1 circulation could have been enhanced by sampling portal blood as has been done by Cani et al. (13,15,18,19).
In addition to increased proglucagon and GLP-1 secretion we also observed improved lipid profiles with the CB and inulin diets including reductions in triglycerides and total cholesterol in obese rats and reductions in LDL and total cholesterol in lean rats who were on the HP diet rather than on the C. Oligofructose has been shown to reduce liver triglyceride accumulation due to fructose feeding in normal rats and lessen the steatosis associated with obese Zucker fa/fa rats (12,14,47). These triglyceride lowering effects have been explained at least in part by inhibition of de novo fatty acid synthesis and downregulation of the expression and activity of lipogenic enzymes (48). Hyperinsulinemia, a prominent characteristic of the JCR:LA rat, induces lipogenic enzymes via enhanced expression of sterol-regulatory-binding protein-1c and ultimately results in increased hepatic lipid production and hypertriglyceridemia (49). The profound reduction in plasma triglycerides observed in the obese JCR:LA rats consuming inulin in our study is a new finding and suggests that this dietary intervention could have beneficial effects in decelerating the atherosclerotic process in the context of the specific genetic background of this model (50).
In general, there is an inverse relationship between plasma triglycerides and HDL in humans with hypertriglyceridemia often presenting with low HDL concentrations (51). This relationship is not as clear in rodents given observations that fibrates, a class of drugs used in the treatment of atherogenic dyslipidemia, effectively decrease plasma triglycerides but their effects on HDL levels occur in an opposite manner in these two species (52–54). In rodents the pronounced decrease in HDL observed with fibrates is associated with decreased liver apolipoprotein A-I mRNA (52), whereas in humans fibrate treatment consistently increases HDL and apolipoprotein A-I concentrations (53,54). It is perhaps not surprising then that we observed a concomitant lowering of HDL with the significant reduction in plasma triglycerides in these obese rats. Our work does support the reduction in plasma total cholesterol and triglycerides seen in other animal models with inulin and oligofructose (55). Part of the mechanism governing reduced cholesterol may be linked to the production of short-chain fatty acids in the gut. While the short-chain fatty acid acetate has been shown to increase cholesterol synthesis, propionate, which is increased proportionally with inulin feeding in rats, has shown inhibitory effects on cholesterol synthesis (56,57). To elucidate the precise role of prebiotic fibers in altering lipid profiles in humans, more work will be needed given that the few studies performed to date have shown inconsistent action with a decrease or no effect on plasma lipid levels (55).
The lack of significant reduction in body weight and glycemia with the inulin supplement was surprising given the clear reductions in these parameters seen with prebiotic fiber in other rat models (13–16,19). The lack of change in our study may be explained by the type of prebiotic fiber utilized in our study. Inulin is largely fermented in the distal colon whereas oligofructose is largely fermented in the cecum and proximal colon (58). In a direct comparison of oligofructose, inulin or a mixture of the two called Synergy 1, Cani et al. (19) demonstrated that oligofructose had the most dramatic effect in increasing intestinal GLP-1 content and proglucagon expression. Oligofructose, therefore, being largely fermented in the proximal gut (the primary site of GLP-1 production) may be the preferred prebiotic fiber for reducing body weight and improving glycemic control. In studies where oligofructose significantly increased GLP-1 there was an accompanying decrease in glycemia (14,15,18). Although the HP diet in our study resulted in the lowest glucose AUC during OGTT in obese rats, this may have been influenced by the CB of higher fasting insulin and increased GLP-1 AUC rather than either effect alone.
Another explanation for the lack of effect on weight gain and GLP-1 levels may be linked to the metabolic defects of the JCR:LA-cp rat model. The male cp/cp rat is characterized by marked hyperleptinemia (59) in addition to hyperinsulinemia and hyperphagia. Our findings of a diminished response to prebiotics are in agreement with the findings of Daubioul et al. (12,14) in the Zucker fa/fa fatty rat which likewise has a defective leptin receptor. Although oligofructose was able to reduce plasma triglycerides and hepatic steatosis in the Zucker fa/fa rat, it did not improve plasma insulin or glucose levels (14). Similarly we show a marked decrease in plasma triglycerides in obese rats with inulin but no change in insulin or glucose response. Moreover, Delmee et al. (16) have recently shown that advanced metabolic disturbance induced by a prolonged high-fat diet reduces the ability of oligofructose to decrease energy intake, body weight or glycemia in mice. It would therefore be beneficial to determine the precise role of oligofructose as a preventative agent in obesity and delineate differences in response based on genetics vs. diet-induced obese states.
To our knowledge this is the first study to combine in one diet both high dietary protein and high dietary fiber content and examine their effects on weight loss and blood glucose and lipid response in obese rats. Although we confirm our hypothesis (that providing targeted fuels along the length of the gut upregulates intestinal proglucagon gene expression and GLP-1 secretion to the greatest extent), these changes do not translate into a clear metabolic advantage of the CB diet over the HF diet alone, in the JCR:LA-cp rat. The advanced metabolic dysfunction seen in this monogenic model of obesity may preclude the ability of inulin to improve glycemic and insulinemic response over the relatively short duration examined.
Acknowledgments
We thank Kristine Lee for her extensive technical help. This work was supported in part by the Canadian Institutes of Health Research, the Natural Sciences and Engineering Research Council, and the Canadian Foundation for Innovation.
Footnotes
DISCLOSURE
The authors declared no conflict of interest.
References
- 1.Delzenne NM. Oligosaccharides: state of the art. Proc Nutr Soc. 2003;62:177–182. doi: 10.1079/pns2002225. [DOI] [PubMed] [Google Scholar]
- 2.Roberfroid MB. Prebiotics: preferential substrates for specific germs? Am J Clin Nutr. 2001;73:406S–409S. doi: 10.1093/ajcn/73.2.406s. [DOI] [PubMed] [Google Scholar]
- 3.Cani PD, Joly E, Horsmans Y, Delzenne NM. Oligofructose promotes satiety in healthy humans: a pilot study. Eur J Clin Nutr. 2006;60:567–572. doi: 10.1038/sj.ejcn.1602350. [DOI] [PubMed] [Google Scholar]
- 4.Yamashita K, Itakura M, Kawai K. Effect of fructo-oligosaccharides on blood glucose and serum lipids in diabetic subjects. Nutr Res. 1984;4:961–966. [Google Scholar]
- 5.Piche T, des Varannes SB, Sacher-Huvelin S, et al. Colonic fermentation influences lower esophageal sphincter function in gastroesophageal reflux disease. Gastroenterology. 2003;124:894–902. doi: 10.1053/gast.2003.50159. [DOI] [PubMed] [Google Scholar]
- 6.Delzenne NM, Williams CM. Prebiotics and lipid metabolism. Curr Opin Lipidol. 2002;13:61–67. doi: 10.1097/00041433-200202000-00009. [DOI] [PubMed] [Google Scholar]
- 7.Drucker DJ. The biology of incretin hormones. Cell Metab. 2006;3:153–165. doi: 10.1016/j.cmet.2006.01.004. [DOI] [PubMed] [Google Scholar]
- 8.McBurney MI, Reimer RA, Tappenden KA. Short chain fatty acids, intestinal adaptation, and nutrient utilization. In: Kritchevsky D, Bonfield C, editors. Dietary Fiber in Health and Disease. Plenum Press; New York: 1997. pp. 135–143. [Google Scholar]
- 9.Reimer RA, McBurney MI. Dietary fiber modulates intestinal proglucagon messenger ribonucleic acid and postprandial secretion of glucagon-like peptide-1 and insulin in rats. Endocrinology. 1996;137:3948–3956. doi: 10.1210/endo.137.9.8756571. [DOI] [PubMed] [Google Scholar]
- 10.Reimer RA, Thomson AB, Rajotte R, et al. A physiological level of rhubarb fiber increases proglucagon gene expression and modulates intestinal glucose uptake in rats. J Nutr. 1997;127:1923–1928. doi: 10.1093/jn/127.10.1923. [DOI] [PubMed] [Google Scholar]
- 11.Reimer RA, Thomson AB, Rajotte R, et al. Proglucagon messenger ribonucleic acid and intestinal glucose uptake are modulated by fermentable fiber and food intake in diabetic rats. Nutr Res. 2000;20:851–864. [Google Scholar]
- 12.Daubioul C, Rousseau N, Demeure R, et al. Dietary fructans, but not cellulose, decrease triglyceride accumulation in the liver of obese Zucker fa/fa rats. J Nutr. 2002;132:967–973. doi: 10.1093/jn/132.5.967. [DOI] [PubMed] [Google Scholar]
- 13.Cani PD, Neyrinck AM, Maton N, Delzenne NM. Oligofructose promotes satiety in rats fed a high-fat diet: involvement of glucagon-like peptide-1. Obes Res. 2005;13:1000–1007. doi: 10.1038/oby.2005.117. [DOI] [PubMed] [Google Scholar]
- 14.Daubioul CA, Taper HS, De Wispelaere LD, Delzenne NM. Dietary oligofructose lessens hepatic steatosis, but does not prevent hypertriglyceridemia in obese Zucker rats. J Nutr. 2000;130:1314–1319. doi: 10.1093/jn/130.5.1314. [DOI] [PubMed] [Google Scholar]
- 15.Cani PD, Daubioul CA, Reusens B, et al. Involvement of endogenous glucagon-like peptide-1(7-36) amide on glycemia-lowering effect of oligofructose in streptozotocin-treated rats. J Endocrinol. 2005;185:457–465. doi: 10.1677/joe.1.06100. [DOI] [PubMed] [Google Scholar]
- 16.Delmee E, Cani PD, Gual G, et al. Relation between colonic proglucagon expression and metabolic response to oligofructose in high fat diet-fed mice. Life Sci. 2006;79:1007–1013. doi: 10.1016/j.lfs.2006.05.013. [DOI] [PubMed] [Google Scholar]
- 17.Kok NN, Morgan LM, Williams CM, et al. Insulin, glucagon-like peptide 1, glucose-dependent insulinotropic polypeptide and insulin-like growth factor I as putative mediators of the hypolipidemic effect of oligofructose in rats. J Nutr. 1998;128:1099–1103. doi: 10.1093/jn/128.7.1099. [DOI] [PubMed] [Google Scholar]
- 18.Cani PD, Knauf C, Iglesias MA, et al. Improvement of glucose tolerance and hepatic insulin sensitivity by oligofructose requires a functional glucagon-like peptide-1 receptor. Diabetes. 2006;55:1484–1490. doi: 10.2337/db05-1360. [DOI] [PubMed] [Google Scholar]
- 19.Cani PD, Dewever C, Delzenne NM. Inulin-type fructans modulate gastrointestinal peptides involved in appetite regulation (glucagon-like peptide-1 and ghrelin) in rats. Br J Nutr. 2004;92:521–526. doi: 10.1079/bjn20041225. [DOI] [PubMed] [Google Scholar]
- 20.Tuohy KM, Probert HM, Smejkal CW, Gibson GR. Using probiotics and prebiotics to improve gut health. Drug Discov Today. 2003;8:692–700. doi: 10.1016/s1359-6446(03)02746-6. [DOI] [PubMed] [Google Scholar]
- 21.Anderson GH, Moore SE. Dietary proteins in the regulation of food intake and body weight in humans. J Nutr. 2004;134:974S–979S. doi: 10.1093/jn/134.4.974S. [DOI] [PubMed] [Google Scholar]
- 22.Halton TL, Hu FB. The effects of high protein diets on thermogenesis, satiety and weight loss: a critical review. J Am Coll Nutr. 2004;23:373–385. doi: 10.1080/07315724.2004.10719381. [DOI] [PubMed] [Google Scholar]
- 23.Bowen J, Noakes M, Clifton PM. Appetite regulatory hormone responses to various dietary proteins differ by body mass index status despite similar reductions in ad libitum energy intake. J Clin Endocrinol Metab. 2006;91:2913–2919. doi: 10.1210/jc.2006-0609. [DOI] [PubMed] [Google Scholar]
- 24.Lejeune MP, Westererp KR, Adam TC, Luscombe-Marsh ND, Westererp-Plantenga RS. Ghrelin and glucagon-like peptide 1 concentrations, 24-h satiety, and energy and substrate metabolism during a high-protein diet and measured in a respiration chamber. Am J Clin Nutr. 2006;83:89–94. doi: 10.1093/ajcn/83.1.89. [DOI] [PubMed] [Google Scholar]
- 25.Blom WA, Lluch A, Stafleu A, et al. Effect of a high-protein breakfast on the postprandial ghrelin response. Am J Clin Nutr. 2006;83:211–220. doi: 10.1093/ajcn/83.2.211. [DOI] [PubMed] [Google Scholar]
- 26.Foster GD, Wyatt HR, Hill JO, et al. A randomized trial of a low-carbohydrate diet for obesity. N Engl J Med. 2003;348:2082–2090. doi: 10.1056/NEJMoa022207. [DOI] [PubMed] [Google Scholar]
- 27.Brehm BJ, Seeley RJ, Daniels SR, D’Alessio DA. A randomized trial comparing a very low carbohydrate diet and a calorie-restricted low fat diet on body weight and cardiovascular risk factors in healthy women. J Clin Endocrinol Metab. 2003;88:1617–1623. doi: 10.1210/jc.2002-021480. [DOI] [PubMed] [Google Scholar]
- 28.Samaha FF, Iqbal N, Seshadri P, et al. A low-carbohydrate as compared with a low-fat diet in severe obesity. N Engl J Med. 2003;348:2074–2081. doi: 10.1056/NEJMoa022637. [DOI] [PubMed] [Google Scholar]
- 29.Yancy WS, Jr, Olsen MK, Guyton JR, Bakst RP, Westman EC. A low-carbohydrate, ketogenic diet versus a low-fat diet to treat obesity and hyperlipidemia. Ann Intern Med. 2004;140:769–777. doi: 10.7326/0003-4819-140-10-200405180-00006. [DOI] [PubMed] [Google Scholar]
- 30.Reimer RA, Darimont C, Gremlich S, et al. A human cellular model for studying the regulation of glucagon-like peptide 1 secretion. Endocrinology. 2001;142:4522–4528. doi: 10.1210/endo.142.10.8415. [DOI] [PubMed] [Google Scholar]
- 31.Reimer RA. Meat hydrolysate and essential amino acid-induced glucagon like peptide-1 secretion in the human enteroendocrine NCI-H716 cell line is regulated by extracellular signal-regulated kinase 1/2 and p38 mitogen-activated protein kinases. J Endocrinol. 2006;190:1–13. doi: 10.1677/joe.1.06557. [DOI] [PMC free article] [PubMed] [Google Scholar]
- 32.Koletsky S. Pathologic findings and laboratory data in a new strain of obese hypertensive rats. Am J Pathol. 1975;80:129–142. [PMC free article] [PubMed] [Google Scholar]
- 33.Russell JC, Graham S, Hameed M. Abnormal insulin and glucose metabolism in the JCR:La-corpulent rat. Metabolism. 1994;43:538–543. doi: 10.1016/0026-0495(94)90192-9. [DOI] [PubMed] [Google Scholar]
- 34.Russell JC, Koeslag DG, Amy RM, Dolphin PJ. Plasma lipid secretion and clearance in hyperlipidemic JCR:La-corpulent rats. Arteriosclerosis. 1989;9:869–876. doi: 10.1161/01.atv.9.6.869. [DOI] [PubMed] [Google Scholar]
- 35.Amy RM, Dolphin PJ, Pederson RA, Russell JC. Atherogenesis in two strains of obese rats. The fatty Zucker and LA/N corpulent. Atherosclerosis. 1988;69:199–209. doi: 10.1016/0021-9150(88)90015-9. [DOI] [PubMed] [Google Scholar]
- 36.DeFronzo RA, Ferrannini E. Insulin resistance: a multifaceted syndrome responsible for NIDDM, obesity, hypertension, dyslipidemia and atherosclerotic cardiovascular disease. Diabetes Care. 1991;14:173–194. doi: 10.2337/diacare.14.3.173. [DOI] [PubMed] [Google Scholar]
- 37.Drucker DJ. Development of glucagon-like peptide-1-based pharmaceuticals as therapeutic agents for the treatments of diabetes. Curr Pharm Des. 2001;7:1399–1412. doi: 10.2174/1381612013397401. [DOI] [PubMed] [Google Scholar]
- 38.Massimino S, McBurney MI, Field CJ, et al. Fermentable dietary fiber increases GLP-1 secretion and improves glucose homeostasis despite intestinal glucose transport capacity in healthy dogs. J Nutr. 1998;128:1786–1793. doi: 10.1093/jn/128.10.1786. [DOI] [PubMed] [Google Scholar]
- 39.Deng MY, Wang H, Ward GB, Beckham TR, McKenna TS. Comparison of six RNA extraction methods for the detection of classical swine fever virus by real-time and conventional reverse transcriptase-PCR. J Vet Diagn Invest. 2005;17:574–578. doi: 10.1177/104063870501700609. [DOI] [PubMed] [Google Scholar]
- 40.Livak KJ, Schmittgen TD. Analysis of relative gene expression data using real-time quantitative PCR and the 2−ΔΔCT method. Methods. 2001;25:402–408. doi: 10.1006/meth.2001.1262. [DOI] [PubMed] [Google Scholar]
- 41.Russell JC, Ravel D, Pegorier JP, et al. Beneficial insulin-sensitizing and vascular effects of S15261 in the insulin-resistant JRC:LA-cp rat. J Pharmacol Exp Ther. 2000;295:753–760. [PubMed] [Google Scholar]
- 42.Russell JC, Graham SE, Dolphin PJ. Glucose tolerance and insulin resistance in the JCR:LA-corpulent rat: effect of miglitol (Bay m1099) Metabolism. 1999;48:701–706. doi: 10.1016/s0026-0495(99)90168-3. [DOI] [PubMed] [Google Scholar]
- 43.Russell JC, Kelly SE, Schafer S. Vasopeptidase inhibition improves insulin sensitivity and endothelial function in the JCR:LA-cp rat. J Cardiovasc Pharmacol. 2004;44:258–265. doi: 10.1097/00005344-200408000-00016. [DOI] [PubMed] [Google Scholar]
- 44.Moughan PJ, Butts CA, Rowan AM, Deglaire A. Dietary peptides increase endogenous amino acid losses from the gut in adults. Am J Clin Nutr. 2005;81:1359–1365. doi: 10.1093/ajcn/81.6.1359. [DOI] [PubMed] [Google Scholar]
- 45.Pannacciulli N, Bunt JC, Koska J, Bogardus C, Krakoff J. Higher fasting plasma concentrations of glucagon-like peptide 1 are associated with higher resting energy expenditure and fat oxidation rates in humans. Am J Clin Nutr. 2006;84:556–560. doi: 10.1093/ajcn/84.3.556. [DOI] [PubMed] [Google Scholar]
- 46.Holst JJ, Deacon CF. Glucagon-like peptide-1 mediates the therapeutic actions of DPP-IV inhibitors. Diabetologia. 2005;48:612–615. doi: 10.1007/s00125-005-1705-7. [DOI] [PubMed] [Google Scholar]
- 47.Kok NN, Roberfroid M, Delzenne NM. Dietary OFS modifies the impact of fructose on hepatic triacylglerol metabolism. Metabolism. 1996;45:1547–1550. doi: 10.1016/s0026-0495(96)90186-9. [DOI] [PubMed] [Google Scholar]
- 48.Delzenne NM, Kok NN. Biochemical basis of oligofructose-induced hypolipidemia in animal models. J Nutr. 1999;129:1467S–1470S. doi: 10.1093/jn/129.7.1467S. [DOI] [PubMed] [Google Scholar]
- 49.Deng X, Elam MB, Wilcox HG, et al. Dietary olive oil and menhaden oil mitigate induction of lipogenesis in hyperinsulinemic corpulent JCR:LA-cp rats: microarray analysis of lipid-related gene expression. Endocrinology. 2004;145:5847–5861. doi: 10.1210/en.2004-0371. [DOI] [PubMed] [Google Scholar]
- 50.Capell WH, Eckel RH. Treatment of hypertriglyceridemia. Curr Diab Rep. 2006;6:230–240. doi: 10.1007/s11892-006-0040-9. [DOI] [PubMed] [Google Scholar]
- 51.Rizzo M, Berneis K. Lipid triad or atherogenic lipoprotein phenotype: a role in cardiovascular prevention? J Atheroscler Thromb. 2005;12:237–239. doi: 10.5551/jat.12.237. [DOI] [PubMed] [Google Scholar]
- 52.Staels B, van Tol A, Andreu T, Auwerx J. Fibrates influence the expression of genes involved in lipoprotein metabolism in a tissue-selective manner in the rat. Arterioscler Thromb. 1992;12:286–294. doi: 10.1161/01.atv.12.3.286. [DOI] [PubMed] [Google Scholar]
- 53.Malmendier CL, Delecroix C. Effects of fenofibrate on high and low density lipoprotein metabolism in heterozygous familial hypercholesterolemia. Atherosclerosis. 1985;55:161–169. doi: 10.1016/0021-9150(85)90095-4. [DOI] [PubMed] [Google Scholar]
- 54.Sirtori CR, Franceshini G. Effects of fibrates on serum lipids and atherosclerosis. Pharmacol Ther. 1988;37:167–191. doi: 10.1016/0163-7258(88)90024-1. [DOI] [PubMed] [Google Scholar]
- 55.Beylot M. Effects of inulin-type fructans on lipid metabolism in man and in animal models. Br J Nutr. 2005;93(Suppl 1):S163–S168. doi: 10.1079/bjn20041339. [DOI] [PubMed] [Google Scholar]
- 56.Wong JM, de Souza R, Kendall CW, Emam A, Jenkins DJ. Colonic health: fermentation and short chain fatty acids. J Clin Gastroenterol. 2006;40:235–243. doi: 10.1097/00004836-200603000-00015. [DOI] [PubMed] [Google Scholar]
- 57.Nyman M. Fermentation and bulking capacity of indigestible carbohydrates: the case of inulin and oligofructose. Br J Nutr. 2002;87(Suppl 2):S163–S168. doi: 10.1079/BJNBJN/2002533. [DOI] [PubMed] [Google Scholar]
- 58.Van Loo J, Franck A, Roberfroid M. Functional food properties of non-digestible oligosaccharides—reply. Br J Nutr. 1999;82:329. [PubMed] [Google Scholar]
- 59.Mantha L, Russell JC, Brindley DN, Deshaies Y. Developmental changes in adipose and muscle lipoprotein lipase activity in the atherosclerosis-prone JCR:La-corpulent rat. Int J Obes Relat Metab disord. 2002;26:308–317. doi: 10.1038/sj.ijo.0801882. [DOI] [PubMed] [Google Scholar]