

Abstract
The results of studies exploring the long-term consequences of famine during foetal or infant development are inconsistent. We tested the hypothesis that selection forces occurring during a famine change the distribution of frailty in the affected cohorts, possibly hiding negative long-term effects. Using mortality data for Finland, gathered from the Human Mortality Database, we explored the effect of being born during the Great Finnish Famine of 1866–68 by comparing mortality at age 60 and over for the 1850–89 births, taking into account unobserved cohort heterogeneity. Contemporaneous Swedish cohorts, unexposed to the famine, were used as an additional control group. When cohort heterogeneity is accounted for, a lower life expectancy at age 60 for male cohorts in Finland born during the famine is observed. The results for females are less conclusive. No substantial changes are seen in the Swedish cohorts. In order to provide consistent estimates of the long-run effects of famines, selection forces need to be considered.
Keywords: old-age mortality, selection, debilitation, early life circumstances, frailty
Introduction
The effects of conditions in early life on health and mortality in later life have been repeatedly demonstrated. Historical studies have stressed the adverse long-term consequences of epidemics of childhood diseases (Fridlizius 1989; Bengtsson and Lindström 2003) and have studied the impact of other exogenous stresses, such as depressed macro-economic conditions at the time of birth (Van den Berg et al. 2009), the month of birth (Doblhammer and Vaupel 2001; Doblhammer 2004), infant mortality rate in the local community, and local food prices (Fridlizius 1989; Bengtsson and Lindström 2003). Similar research on contemporary populations has focused on the effects of nutritional imbalances on the human foetus (Barker 1994) leading to the development of the ‘thrifty phenotype’ hypothesis (Hales and Barker 2001; Leon 2004). Famine is an extreme form of environmental stress, and a number of studies have explored the long-term consequences of foetal or childhood environments where famine is present. The most widely studied famines are the Dutch famine of 1944–45, the Chinese famine of 1959–61, and the famine of the Siege of Leningrad in 1944.
Various indicators of long-term health have been used and a variety of associations have been found. For example, the available studies show a reproducible association between exposure to famine in utero and obesity—or at least excess weight—as well as diabetes and schizophrenia in adulthood. For other measures of adult health the findings are from single studies and are inconsistent between studies (for a review, see Lumey et al. 2011).
Conflicting evidence exists about the effects of famine on mortality and life expectancy. An analysis of the Dutch ‘Potato Famine’ in the mid-1840s found higher rates of late-life mortality amongst cohorts born during the famine (Lindeboom et al. 2010). In contrast, three further studies did not find differences in mortality and survival at older age for cohorts born during these famines. These were the pioneering national cohort study of the Great Finnish Famine by Kannisto et al. (1997), a study following those born during the Dutch Hunger Winter over the subsequent 57 years (Painter et al. 2005), and a regional study of the Chinese famine (Song 2009).
The study reported here addressed the concern that selection during famine hides long-run effects on old-age mortality. The question of whether selection effects need to be explicitly considered when studying famines is of great theoretical and practical interest, but difficult to evaluate. To our knowledge, no one to date has been able to address this question adequately. One possible explanation for the absence of any observable long-term effect on survival is that selection during the famine altered the distribution of frailty across the population. During a famine, selection could operate on each link of the chain stretching from conception to death: conceptions may be reduced and there could be effects on foetal survival, infant survival, as well as survival at older ages.
In our study we considered three possible selection effects. First, famines generally affect fertility patterns such that the number of births during a famine declines and then rises sharply shortly after the famine (Stein et al. 1975; Pitkänen 1993; Kannisto et al. 1997). The social and biological characteristics of women who conceive and give birth during a famine may be different from those of women who have children in ‘normal’ years. For example, Stein et al. (1975) show that during the Dutch Hunger Winter of 1944–45, the reduction in fertility was greater among manual workers than among those in other occupations. The manual workers' offspring may also have differed in the factors influencing their long-term health and survival. Second, mortality during famines is not random: frailer individuals die and the stronger survive. The population of survivors is therefore more homogeneous in frailty (Vaupel et al. 1979) than the population before the famine. Third, because the surviving population is more homogeneous, their offspring should also be more homogeneous and cohorts born after the famine should thus display less variability in their levels of frailty. Gørgens et al. (2012) provide an example of this by comparing the height of children of survivors of the Chinese famine with the height of children of other cohorts. We return to this study below.
We tested the effect of selection by analysing the Finnish cohort data used by Kannisto et al. (1997) in their seminal paper on the long-term effect of the Great Finnish Famine 1866–68. Their analysis showed no association between births during the famine and survival beyond age 17, and no long-run effects on mortality between ages 60 and 80.
We modelled the assumed frailty of a birth cohort using a stochastic distribution. From the ideas presented above it was predicted that two forces would affect the frailty distribution of those surviving the Great Finnish Famine, and famines in general. On the one hand, any long-term negative effect of a famine giving rise to debilitation, but not great mortality, should make individuals more heterogeneous in their health since, depending on their biological or social characteristics and their vulnerability to the famine, they would suffer different degrees of debilitation. Under this scenario, the variance of the population's frailty distribution should increase. On the other hand, if, during the famine, mortality selects out frailer individuals, this would result in a more homogeneous group of survivors and then the variance should decrease. These two forces may cancel each other out, in which case the cohorts born during the famine would face the same risks of mortality in later life as the cohorts born before or after the famine. If, however, the debilitation effect was larger than the selection effect, the variance of the frailty distribution would increase. If the opposite holds, and the selection effect was larger than the debilitation effect, the variance would decrease. Furthermore, each of these effects would apply to cohorts born before and during a famine in varying degrees, depending on the age-specific vulnerability of the population to that particular famine.
If the long-term debilitation effects of a famine were larger than the mortality selection during the famine, the distribution of frailty amongst the cohorts born after the famine would have a smaller variance than the frailty distribution of previous cohorts, because the post-famine cohorts would be the only ones not directly affected by the debilitating effects of the famine. In addition, they would have been selected by being the children of survivors of the famine, which should even further decrease the variance in their levels of frailty.
If negative long-term consequences of famines do exist and if the underlying cohort-specific frailty distribution can be accounted for, then it might be expected that cohorts born during a famine would have higher mortality and lower life expectancy in old age than cohorts born after the famine. It is more difficult to judge, however, whether they would have higher mortality than cohorts born before the famine, since this would depend on which age groups were most vulnerable to that particular famine.
In contrast to the study reported by Kannisto et al. (1997), which compared birth cohorts between 1861 and 1873, we explored a longer time period and used cohort data for those born from 1850 to 1889. We had two reasons for doing so. First, any long-term effects of the famine may have affected individuals of all ages living through it, and therefore the old-age mortality of all cohorts born before the famine may have been altered. Second, because selective fertility may extend well beyond the years of, and immediately after, the famine, the frailty distributions of the cohorts born after the famine may also have been altered. Only annual data are available on the Finnish cohort and therefore critical periods during pregnancy, such as particular trimesters or a child's first year of life, cannot be precisely identified. Some infants born after the famine would have been conceived during it. A child born during the famine could have been conceived during it, exposed to it while in utero, exposed to it as an infant, or subject to a combination of two or more of these scenarios.
Unlike previous famine studies, we used a control country, namely Sweden, to compare the mortality in old age of birth cohorts over time. Sweden's population data during the period being studied were of the highest quality, and the country had a mortality regime comparable to that of Finland. Both countries experienced a general decline in mortality during the nineteenth and twentieth centuries, interrupted only by short periodic mortality crises. As in other European countries, this decline started among the young but shifted into the higher age groups in the second half of the twentieth century (Christensen et al. 2009). Historically there were some differences in absolute mortality levels between Sweden and Finland. While Sweden at one point led the world in terms of high life expectancy (Oeppen and Vaupel 2002), Finland lagged behind, particularly in the 1960s and 1970s (http://www.mortality.org). Both countries were exposed to the Spanish 'flu pandemic in 1918, but only Finnish mortality was strongly elevated at the end of both the First and Second World Wars.
Like Finland, Sweden experienced repeated crop failures in the 1860s (Nelson 1988). Unlike Finland, however, it did not suffer from severe hunger crises or highly elevated mortality during that decade. Swedish death rates in the period 1866–68 ‘pale in comparison with the situation in Finland’ (Nelson 1988, p. 93). This also applies to the northern part of Sweden, where the population experienced greater hardships in the 1860s than the rest of their countrymen (Nelson 1988); although it should be noted that the northern part of the country contained only a small part of the Swedish population. Thus, it was expected that the frailty distributions of the different Swedish cohorts would fluctuate less than those of the equivalent Finnish cohorts; when accounting for cohort frailty, no increase in mortality was expected among the Swedish cohorts born during the years of the Finnish famine.
A number of studies of the effect of famine on the height of young adults have addressed the issue of mortality selection. Height is an indicator of health and has been frequently used to explore the long-term effects of income, nutrition, and disease early in life on health in later life. As Deaton (2007) pointed out in his worldwide comparison of height, health, and development, the selection effect brought about by infant mortality plays an important role in height outcomes, and may even explain the puzzle of why Africans, despite being more deprived on almost all counts, are taller than their Asian counterparts. Based on this observation Bozzoli et al. (2009) developed a simplified model of selection and stunted growth. In this model, poor nutrition and high disease load early in life are treated as responsible for mortality early in life but also as having negative long-term effects on health, measured by adult height, so that the population becomes stunted. The model predicts that when mortality levels early in life are sufficiently high, selection dominates over stunting: only the taller are left alive. At low mortality levels, however, the stunting effect predominates. We return to this model below. Another line of research studied the force of selection during the 1959–61 Chinese famine. Gørgens et al. (2012) used the height of the survivors of this famine and their children to distinguish between the inherited ‘genotype’, the entire set of genes, which shows the extent of the role played by selection during the famine, and the acquired physical appearance, the ‘phenotype’, which indicates the extent of the debilitating forces of the famine. The idea behind the study design was that if famine survivors had greater average potential height owing to selection, their children would inherit this trait and would be taller than the children of a control group less affected by famine. Comparing the children of the survivors of the Chinese famine with the control group, the authors found that rural people exposed to the famine in the first 5 years of life were stunted by between 1 and 2 cm, while conversely, the selection effect generated an increase in height of between 1 and 2 cm. A similar stunting effect was found by Huang et al. (2010) for rural Chinese women born in 1958 and 1959. In their study of the same Chinese famine, Meng and Quian (2009) adopted a quantile regression approach to argue that survivors typically come from the top of the height distribution whereas those from lower down in the distribution have a greater risk of dying. Another approach exploring the debilitation and selection effects of the Chinese famine was presented by Song (2010), who examined mortality crossovers in cohorts born before, during, and after the famine and followed up to the age of 22. Song's results showed that between ages 11 and 12 the level of mortality in the non-famine cohorts caught up with and exceeded the level of mortality in the famine cohort, thus suggesting that both debilitation and selection effects were at work.
Data and methods
Survival analysis accounting for unobserved heterogeneity
The current study analysed the death rates amongst a series of birth cohorts, accounting for unobserved heterogeneity in the distribution of deaths. We used data for eight cohorts: those born in 1850–54, 1855–59, 1860–65, 1866–68, 1869–74, 1875–79, 1880–84, and 1885–89. The 1860–65 birth cohort was considered to be the immediate pre-famine cohort, those born between 1866 and 1868 were taken to be the famine cohort, and the 1869–74 birth cohort formed the immediate post-famine cohort. All the analyses were performed separately for males and females.
For each cohort the force of mortality, µ(x), over age x followed a baseline hazard rate, µ0, modified by a measure of frailty, Z:
where α and γ denote the parameters of a Gompertz function and Yi denotes the n indicator variables for each single birth year within the eight birth cohorts and the indicator variables for the period effects of the First World War combined with the Spanish 'flu and Second World War, together with their parameter estimates, βi. The frailty distribution, Z, follows a Gamma distribution with a mean of 1 and variance σ2:
It is common and uncontroversial to assume a Gamma distribution when studying longevity. It allows ‘frailty’ to be analytically integrated out of the conditional likelihood of survival (Vaupel et al. 1979). More importantly, Abbring and Van den Berg (2007) have shown that, for a wide class of frailty distributions within a population, the Gamma distribution is the limiting frailty distribution among survivors at high ages. In the next section we report the sensitivity of our results with respect to the Gamma distribution assumption.
In equation (2), α is independent of age and determines the general level of mortality of a cohort. It changes between cohorts, which may counterbalance any trend across cohorts in the variance of the frailty distribution. Alternatively, the general level of mortality may be viewed as part of the frailty distribution, and the level of mortality for the various cohorts may be arbitrarily fixed at the value 1. Thus, equations (1)–(3) can be rewritten as
where α0 is fixed at 1 and
The variance σ2α2, which we will call ‘cohort variance’, was used to test the three selection hypotheses formulated above, and the hazard rates of the Gompertz function, µ0, were used to estimate remaining life expectancy at age 60 for a standard individual within a cohort. For the sake of brevity, we refer to the latter as the ‘standardized life expectancy’. The natural logarithm of the cohort variance, ln(σ2α2), or ‘log cohort variance’, was used as a scale-invariant measure of cohort heterogeneity.
If either dynamic selection before adulthood or selective fertility or both are ignored—by estimating a single Cox proportional hazard model in which famine exposure is a covariate, for example—an incorrect inference may be reached. As Deaton (2010) has pointed out, a candidate instrumental variable, such as famine, may be externally determined but this does not imply that it is exogenous. We deal with this by estimating separate models for each cohort, allowing for dynamic selection and permitting the frailty distribution to differ across cohorts.
Almond (2006) developed an alternative model of long-run causal effects of early life conditions, where these conditions also have short-term mortality effects which in turn give rise to dynamic selection effects. This model was designed as a tool to help illuminate the factors affecting non-mortality outcomes later in life, and was extended by Bozzoli et al. (2009). In the model, selection early in life involves the left-truncation of the underlying distribution of latent health. The truncation point is an external parameter of the model, which may vary across cohorts. In our analysis, the outcome of interest was the rate of mortality itself, which made it attractive to use a coherent framework for both the mortality selection between birth and adulthood and the outcome later in life. Notice also that in our model the dynamic selection is stochastic. All individuals have a chance to survive into adulthood, but their relative odds may vary across cohorts.
Data
The Human Mortality Database (http://www.mortality.org) contains deaths by Lexis triangles, cross-classified by year of birth, year of death, and age (Wilmoth et al. 2007). Because we were interested in the long-term effects of famine, our analysis focused on mortality at age 60 and above. To avoid the influence of extreme longevity on the variance of the frailty distribution, we right-censored all deaths at age 95. Because migration over the age of 60 may be assumed to have been negligible and all cohorts observed were extinct, we used the counts of death in the Lexis triangles to estimate the age-specific force of mortality for ages at single-year intervals.
For Finland, the number of deaths by year of age were available from 1878 onward. Lexis triangles were constructed by the team holding the Human Mortality Database, using the aggregate death counts published in various statistical publications by year of birth, year of death, and age. This implies that the cohorts born before 1878 were included from the age they had achieved in 1878. Thus, members of the cohort born in 1850 first appeared in the database aged 28, while data were available for age at death 0 onwards for members of the youngest cohort in this analysis, who were born from 1878 onwards.
For Sweden, Lexis triangles showing the number of deaths by year of age from age ‘0’ upwards are available from 1751, although the quality of the data improves tremendously after 1860, when the compilation of population and death counts based on all the parish registers sent to Statistics Sweden began. The reporting of ages is believed to have been extremely accurate after 1861, but before that date age exaggeration is thought to have been a problem (Wilmoth et al. 2007).
Two major period effects modified the hazard rates in our analysis. When considering Finland, we included one variable to capture the effect of the declaration of independence from Russia in 1917, which resulted in a short civil war between January and May in 1918. That same year Finland was hit by the Spanish influenza pandemic. The variable took the value 1 for the year 1918 and 0 otherwise. The second variable captured the two wars fought by Finland against the Soviet Union during the Second World War: the ‘Winter War’, which ran from November 1939 to March 1940, and the ‘Continuation War’, which lasted from June 1941 to September 1944. Both period factors had a significant impact on Finnish mortality. The Spanish influenza pandemic resulted in an estimated excess mortality of 33 per cent (Ansart et al. 2009); although this was a comparatively low mortality increase compared with other European countries. During the Second World War life expectancy at age 60 declined, dropping from 14.93 years for both sexes combined in 1938 to a minimum of 14.19 years in 1940 (http://www.mortality.org). Turning to Sweden, two period effects were again included as two separate variables: the Spanish influenza pandemic of 1918—which in Sweden had an estimated excess mortality of 78 per cent (Ansart et al. 2009)—and the years of the Second World War from 1939 to 1945. Because Sweden remained neutral during both world wars, the population was minimally affected compared with other European countries. In our model the variables indicating the period effects of the Second World War for Finland and Sweden differed by 1 year. Using identical period variables for both countries had only minor effects on the results.
The cohorts we observed experienced these period effects at various ages. The two oldest cohorts (those born in 1850–54 and 1855–59) experienced the events of 1918 when aged between 59 and 68, while, for the purposes of this analysis, the younger cohorts were not exposed to the war or the epidemic because these events happened before their 60th birthdays, 60 being the youngest age in our analysis. Members of the oldest Finnish cohort were aged between 85 and 94 during the Second World War, while those in the oldest Swedish cohort were aged 84–95. Members of the second oldest cohorts in the two countries experienced the war aged 80–89 and 80–90, respectively. Under the terms of the our analysis those born in 1885 in Finland or 1886 in Sweden and their younger peers did not experience the period effect of the Second World War, because at the relevant time they were under 60 years of age.
Results
Cohort variances
Table 1 shows the parameter estimates of the hazard models for Finland (the estimation was carried out using Stata software, Version 11.0). Both the variance of the frailty distribution, σ2, and the age-independent level of mortality, α, fluctuate considerably over the cohorts, revealing countercyclical trends. We do not want to over-interpret the separate parameters of the model caused by the fact that there is a trade-off between α and γ and their effects on the death rate (Thatcher 1999). For females the 1866–68 and 1869–74 cohorts have significantly higher mortality levels, a, and significantly smaller variances, σ2, than the adjacent cohorts; the reverse is true for the male cohorts of 1860–65 and 1866–68, for whom α is significantly lower and σ2 significantly larger. Treating the age-independent parameter, α, as part of the frailty distribution results in a greatly increased log cohort variance for the Finnish male birth cohorts of 1860–65 and 1866–68. For these two cohorts combined the log cohort variance is significantly larger than for earlier birth cohorts: ln(σ2α2) = −9.407; the 95 per cent confidence interval (CI) spans −9.625 to −9.189. The log cohort variance is smallest for the cohort born in the period 1869–74 immediately after the famine. Among Finnish females, differences in the log cohort variance are much smaller than among males. Females born in the period 1860–65 reveal the highest log cohort variance, while the famine cohort, together with the cohort born immediately after the famine, have the smallest log cohort variance. For the male cohorts born in the periods 1860–65 and 1866–68 the log cohort variances differ significantly between Sweden and Finland; for females this is true for the 1855–59 and 1860–65 birth cohorts (Figures 1 and 2).
Table 1.
Effects of famine on life expectancy: parameter estimates and 95 per cent confidence intervals of the hazard models for Finland and Sweden; female and male birth cohorts, 1850–89 (period effects are not shown)
| Finland |
Sweden |
|||||||
|---|---|---|---|---|---|---|---|---|
| Gompertz function |
Frailty distribution |
Gompertz function |
Frailty distribution |
|||||
| Cohorts | ln(α) | γ | σ2 | ln(σ2α2) | ln(α) | γ | σ2 | ln(σ2α2) |
| Females | ||||||||
| 1850–54 | −4.067 | 0.099 | 0.021 | −11.986 | −4.380 | 0.109 | 0.067 | −11.459 |
| −4.097 −4.037 | 0.097 0.102 | 0.007 0.063 | −13.053 −10.919 | −4.40 −4.357 | 0.107 0.111 | 0.053 0.058 | −11.671 −11.247 | |
| 1855–59 | −4.146 | 0.110 | 0.109 | −10.512 | −4.432 | 0.114 | 0.112 | −11.051 |
| −4.180 −4.112 | 0.107 0.114 | 0.087 0.136 | −10.703 −10.321 | −4.460 −4.410 | 0.112 0.116 | 0.097 0.130 | −11.177 −10.926 | |
| 1860–65 | −4.124 | 0.109 | 0.124 | −10.334 | −4.374 | 0.112 | 0.117 | −10.897 |
| −4.155 −4.093 | 0.106 0.112 | 0.101 0.153 | −10.515 −10.153 | −4.395 −4.354 | 0.110 0.113 | 0.101 0.135 | −11.024 −10.770 | |
| 1866–68 | −4.074 | 0.099 | 0.046 | −11.227 | −4.366 | 0.107 | 0.092 | −11.112 |
| −4.112 −4.037 | 0.095 0.102 | 0.021 0.102 | −11.980 −10.473 | −4.391 −4.340 | 0.105 0.109 | 0.072 0.119 | −11.340 −10.883 | |
| 1869–74 | −4.126 | 0.099 | 0.030 | −11.768 | −4.373 | 0.106 | 0.087 | −11.191 |
| −4.154 −4.099 | 0.097 0.101 | 0.016 0.056 | −12.377 −11.160 | −4.394 −4.351 | 0.104 0.107 | 0.073 0.103 | −11.347 −11.034 | |
| 1875–79 | −4.316 | 0.113 | 0.119 | −10.764 | −4.543 | 0.113 | 0.141 | −11.048 |
| −4.352 −4.280 | 0.111 0.116 | 0.098 0.143 | −10.920 −10.609 | −4.569 −4.518 | 0.111 0.115 | 0.124 0.159 | −11.148 −10.948 | |
| 1880–84 | −4.436 | 0.121 | 0.209 | −10.437 | −4.566 | 0.111 | 0.151 | −11.022 |
| −4.471 −4.401 | 0.119 0.124 | 0.186 0.234 | −10.526 −10.350 | −4.541 −4.542 | 0.109 0.113 | 0.134 0.171 | −11.119 −10.924 | |
| 1885–89 | −4.432 | 0.121 | 0.254 | −10.233 | −4.549 | 0.102 | 0.062 | −11.977 |
| −4.461 −4.404 | 0.118 0.123 | 0.233 0.278 | −10.309 −10.158 | −4.567 −4.530 | 0.100 0.103 | 0.042 0.075 | −12.240 −11.713 | |
| Males | ||||||||
| 1850–54 | −3.541 | 0.081 | 0.024 | −10.829 | −4.186 | 0.100 | 0.013 | −12.683 |
| −3.572 −3.510 | 0.077 0.084 | 0.006 0.096 | −12.129 −9.465 | −4.209 −4.162 | 0.098 0.102 | 0.004 0.044 | −13.855 −11.510 | |
| 1855–59 | −3.586 | 0.083 | 0.031 | −10.650 | −4.237 | 0.107 | 0.039 | −11.722 |
| −3.618 −3.553 | 0.079 0.086 | 0.011 0.084 | −11.617 −9.682 | −4.261 −4.214 | 0.102 0.106 | 0.025 0.059 | −12.121 −11.323 | |
| 1860–65 | −3.614 | 0.094 | 0.113 | −9.405 | −4.234 | 0.105 | 0.076 | −11.044 |
| −3.647 −3.582 | 0.090 0.098 | 0.087 0.148 | −9.641 −9.169 | −4.256 −4.213 | 0.104 0.107 | 0.060 0.096 | −11.252 −10.835 | |
| 1866–68 | −3.535 | 0.091 | 0.105 | −9.324 | −4.200 | 0.101 | 0.039 | −11.655 |
| −3.576 −3.494 | 0.084 0.097 | 0.061 0.181 | −9.822 −8.827 | −4.225 −4.174 | 0.098 0.103 | 0.021 0.071 | −12.233 −11.076 | |
| 1869–74 | −3.524 | 0.079 | 0.005 | −12.401 | −4.226 | 0.098 | 0.014 | −12.718 |
| −3.551 −3.498 | 0.076 0.081 | 0.000 0.891 | −17.641 −7.161 | −4.247 −4.205 | 0.097 0.099 | 0.005 0.038 | −13.703 −11.732 | |
| 1875–79 | −3.604 | 0.082 | 0.013 | −11.573 | −4.349 | 0.107 | 0.077 | −11.257 |
| −3.638 −3.571 | 0.079 0.085 | 0.002 0.106 | −i3.675 −9.471 | −4.375 −4.323 | 0.105 0.109 | 0.063 0.096 | −11.440 −11.074 | |
| 1880–84 | −3.682 | 0.088 | 0.057 | −10.238 | −4.417 | 0.111 | 0.126 | −10.904 |
| −3.718 −3.647 | 0.085 0.092 | 0.034 0.093 | −10.699 −9.777 | −4.441 −4.391 | 0.109 0.113 | 0.110 0.145 | −11.015 −10.792 | |
| 1885–89 | −3.648 | 0.087 | 0.079 | −9.833 | −4.339 | 0.104 | 0.077 | −11.239 |
| −3.675 3.621 | 0.084 0.09 | 0.057 0.109 | −10.130 −9.536 | −4.358 −4.321 | 0.102 0.105 | 0.064 0.094 | −11.413 −11.065 | |
Note: ln(α) is the natural logarithm of the age–independent level of mortality; γ is the increase in the force of mortality with age; σ2 is the variance of the Gamma frailty distribution; ln(σ2α2) is the natural logarithm of the cohort variance.
Source: Human Mortality Database.
Figure 1.
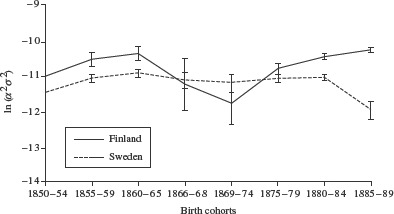
The log cohort variance, ln(σ2α2), and 95 per cent confidence intervals of female cohorts born 1850–89 in Finland and in Sweden
Source: Human Mortality Database.
Figure 2.
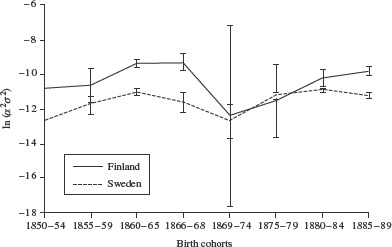
The log cohort variance, ln(σ2α2), and 95 per cent confidence intervals of male cohorts born 1850–89 in Finland and in Sweden
Source: Human Mortality Database.
Frailty distributions
Figures 3 and 4 show the estimated frailty distributions (equation (6) above) of the three adjacent Finnish birth cohorts of 1860–65, 1866–68, and 1869–74. For both sexes the pattern is similar for the pre-famine and post-famine cohorts: the 1860–65 cohort combines a low frailty level with a large cohort variance, while in contrast the 1869–74 cohort shows a high level of frailty together with a small cohort variance. For the famine cohort born 1866–68 the frailty distribution differs between the sexes. For males a low frailty level is combined with a large variance, resulting in a distribution similar to that of the 1860–65 cohort. For females, the frailty distribution is similar to that of the 1869–74, post-famine cohort. The frailty distributions of the Swedish cohorts are remarkably stable and show little variation in their means and variances, the only exception being the male cohort born 1869–74, which has a comparatively small variance.
Figure 3.
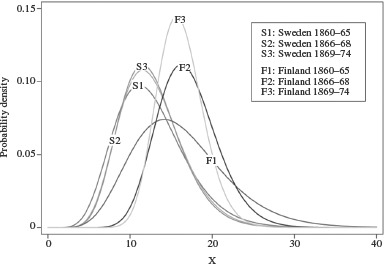
The frailty distribution of female cohorts born 1860–65, 1866–68, and 1869–74 in Finland and in Sweden
Source: Human Mortality Database.
Figure 4.
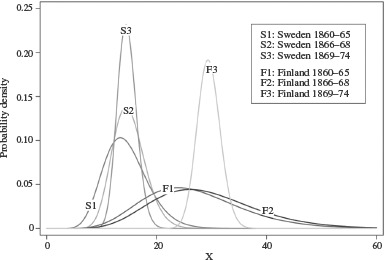
The frailty distribution of male cohorts born 1860–65, 1866–68, and 1869–74 in Finland
Source: Human Mortality Database.
Standardized life expectancy
In Figures 5 and 6 the standardized life expectancies for males and females in Finland and Sweden between 1850 and 1889 are compared. Amongst males (Figure 5), the 1866–68 birth cohort has the lowest standardized life expectancy and the 1860–65 cohort the second lowest. The difference in life expectancy between the 1869–74 cohort, born immediately after the famine, and the famine cohort is 0.81 years, whereas the difference between the famine cohort and the pre-famine cohort, born 1860–85, is only 0.32 years. Among Finnish females (Figure 6), standardized life expectancy is lowest for the cohort born before the famine in 1860–65. The difference in life expectancy between the latter cohort and the 1869–74 cohort born immediately after the famine is 0.87 years, while the difference between the 1866–68 famine cohort and the 1869–74 cohort is 0.33 years. Sweden does not show any large disturbances in standardized life expectancy for these cohorts. We bootstrapped 95 per cent confidence intervals for the standardized life expectancy, assuming that the parameters of the Gompertz function follow a bivariate normal distribution, and drawing 100,000 replications for each cohort. Since we were using population data, however, the confidence intervals are too small to include them in a visible way in the figures.
Figure 5.
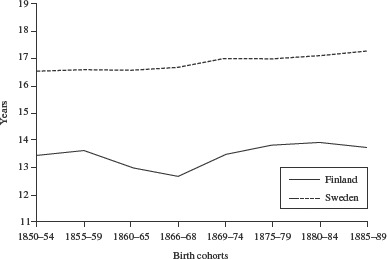
Standardized life expectancy at age 60 for male cohorts born 1850–89 in Finland and in Sweden
Source: Human Mortality Database.
Figure 6.
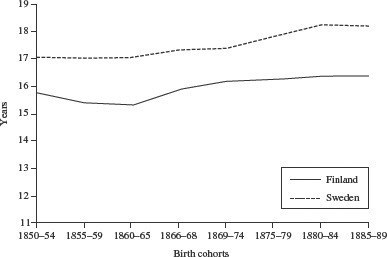
Standardized life expectancy at age 60 for female cohorts born 1850–89 in Finland and in Sweden
Source: Human Mortality Database.
Sensitivity analysis
In this subsection we address the sensitivity of the results to the assumption that the frailty distribution is a Gamma distribution. We have seen that the Gamma distribution can be justified as a good approximation at high ages. Moreover, our model included time-varying explanatory variables, Yi, in the individual hazard rate, and this made the estimation of results in the survival models relatively robust with respect to functional form assumptions such as the Gamma and Gompertz assumptions (see, e.g., Van den Berg 2001). Nevertheless, it is well known that incorrect modelling of the frailty distribution may have adverse consequences for parameter estimates (Heckman and Singer 1984). In a fixed frailty model the individual is assumed to be born with a particular frailty which then has a proportional effect on his or her force of mortality over the life course. While, in general, the causes of variations in frailty are poorly understood, there is some knowledge about genetically based determinants of mortality (Weiss 1990). Genetic factors have a modest role in determining life span, however (Vaupel 2010). We re-estimated our model assuming non-Gamma families of frailty distributions, notably Inverse Gaussian and lognormal distributions. Each of these families has a scale parameter, which is a practical advantage for our approach. To facilitate replication of our analysis, we used standard software commands in Stata (Version 11.0) for the Inverse Gaussian case and in SAS (Version 9.2) for the lognormal case.
The results of the sensitivity analysis show that the choice of the family of frailty distributions does not affect the estimates of the standardized life expectancy. For Sweden and Finland, Gamma frailty and lognormal frailty distributions gave virtually identical results; both distributions resulted in an estimated reduction in the standardized life expectancy of the male famine cohort of about 1 year, while there was little effect for females. Similar results applied when an Inverse Gaussian frailty distribution was used with the Swedish data, but when this distribution was used with the Finnish data very different estimates were obtained, with the estimated frailty variance being very large in many cases. This can be explained because, as those surviving to high ages have, on average, low frailty, the left-hand tail of the frailty distribution is an important determinant of the observed mortality rate at high ages. The Inverse Gaussian distribution has a thinner left-hand tail than the lognormal distribution, while the left-hand tail of the lognormal distribution is slightly thinner than the tail of the Gamma distribution. Abbring and Van den Berg (2001) show that, if appropriately scaled, the Inverse Gaussian frailty distribution among survivors converges to a single, positive mass point at high ages. Obtaining a good fit to the observed mortality rate at various ages may therefore be more difficult when an Inverse Gaussian frailty distribution is assumed.
Discussion and conclusions
Our study explicitly tackled the widely discussed problem of selection forces during famine and found that they alter the distribution of frailty within cohorts. This can result in the underestimation of the long-run effects of famines. By developing a new approach, we have taken a major step forward in the demographic (and associated economic and sociological) analysis of the long-run effects of exposure to famine early in life on mortality later in life. We simultaneously modelled the frailty distributions of cohorts when analysing old-age mortality and have shown that cohorts born during the Great Finnish Famine had a lowered life expectancy. By applying our new approach, we have reached conclusions which are the reverse of those reached by Kannisto et al. (1997) in their landmark study.
We found evidence for negative long-term effects of the famine, in the form of debilitation, which had previously been concealed by selection effects. We postulated that famines make the health of individuals within a population more heterogeneous, depending on both their biological and social characteristics and on their vulnerability to the famine. The variance of their cohort frailty should therefore increase. In contrast, selection effects should make individuals more homogenous, because the frail die, leaving only the strongest to survive and reproduce, thus decreasing the variance of their frailty distribution. If both debilitation and selection applied with equal force they would cancel each other out. We have shown that the cohorts born in Finland immediately before the Great Finnish Famine (1860–65) were highly heterogeneous in their distribution of deaths after age 60 and, thus, had a large cohort variance. The male cohort born during the Great Finnish Famine, 1866–68, also showed increased heterogeneity. By contrast, those born in the years immediately after the famine, 1869–74, were seen to be particularly homogeneous, with little cohort variance.
Almond (2006) argued in the report of his study of the influenza pandemic in the US population in 1918 that the debilitation effect influenced everybody more or less equally by simply shifting the population towards the negative end of the distribution without changing its shape. For the influenza pandemic this may have been true, since the spread of the virus seems to have been random and unrelated to economic development, climate, or geography. The impact of the pandemic also seems to have varied arbitrarily within states (Brainerd and Sieger 2003; Almond 2006). Such a pattern, however, differs from the spread of famines in general, and the Great Finnish Famine in particular. During the Great Famine, rural regions of Finland were harder hit than urban ones. In 1866, for example, notable mortality increases were detectable only in a few cities (Pitkänen 1993). One major effect of the Finnish famine was social dislocation (Pitkänen 1993, p. 96), resulting in increased itinerant migration. Unusually high excess mortality was experienced in those regions that received large numbers of itinerant migrants, where increased crowding in public relief institutions contributed to the excess mortality. Excess mortality was also high in economically deprived regions, but ‘even in the economically more fortunate areas the poorer people suffered from higher excess mortality than the wealthier segments of the populace’ (Pitkänen 1993, p. 111). Thus, the effect of the famine was socially stratified, predominantly harming the poor and sparing the wealthy. Such social stratification supports the notion that over the course of the famine the frailty of the surviving population had become more heterogeneous.
When changes in the frailty distribution are taken into account, the standardized life expectancy of the male cohort born during the Great Finnish Famine is estimated to fall by about 1 year. The cohort born immediately before the famine also displays a low standardized life expectancy. The absence of any reduction in life expectancy among the male cohort born in Sweden during the time of the Finnish famine further supports the assumption that it was the famine which engendered the long-term negative effects.
In this study we were particularly interested to explore the long-term effects of famine on mortality at old age. We therefore focused on life expectancy at age 60. We also investigated the effects at earlier ages, such as age 40, but found that the 1-year-difference remained unchanged. Here we should point out that existing studies of exposure to famine while in the womb indicate that any adverse effects taking place after birth but before adulthood occur in the first year of life (see in particular Stein et al. 1975). Unfortunately, we did not have access to mortality data at low ages; clearly, such data would be valuable. Modelling the frailty distribution of cohorts, as we did in this analysis, is one possible means of dealing with both selection and debilitation effects. Another option would be to treat the whole issue as a problem of missing data, where those not conceived or the dead had been omitted. This strategy would allow the contribution of the drop in fertility to the total selection effect of the famine to be differentiated from that of excess mortality. To date it is unclear which had the larger impact during the Great Finnish Famine: the 30 per cent drop in births at the peak of the famine—there were 62,780 births recorded in 1865, but just 45,757 in 1868—or the steep increase in infant and childhood mortality (Pitkänen 1993; Kannisto et al. 1997).
The foregoing discussion refers to males; for females the results were less clear. For this group heterogeneity in age at death was largest for the pre-famine cohorts. The cohorts born between 1855 and 1865 experienced the lowest life expectancy, having about 1 year of life less than the cohorts born immediately after the famine. Those born during the famine were only marginally affected. This is not the only study that finds that the long-term effects of early life circumstances differ by sex, and that the results for women are less conclusive than those for men. For example, a study of Danish twins found that the effect of the business cycle at birth on late-life mortality was stronger for men than for women (Van den Berg et al. 2009), and similar conclusions were reached using Dutch data (Van den Berg et al. 2006), including those of a study researching the effect of the Dutch Potato Famine on late-life mortality (Lindeboom et al. 2010). A medical study of the relationship between birth weight and mortality from heart disease again found that the effects identified were stronger for men (Leon et al. 1998). It is also known that men with certain health problems suspected to originate in early life are more likely to die than women with the same conditions (Case and Paxson 2005). For the Finnish famine, Pitkänen (1993) found large mortality differences by sex, with males being far more likely than females to die as a result of the famine. This sex differential was particularly large for those aged 10–40 in the high-impact areas of the famine, but it also existed amongst younger age groups. It has been hypothesized (Low 2001) that the smaller impact of famine on females may be explained by so-called male ‘vulnerability’: because males are the heterogametic sex and have an unprotected Y chromosome it is thought they may be more vulnerable to adverse environmental conditions in both the short and the long term.
Why did Kannisto et al. reach a conclusion different from ours about the presence of a causal famine effect? Most of the mortality observed in the Finnish cohort data takes place between ages 60 and 80. For this age interval, Kannisto et al. looked at just one particular outcome measure, namely, the probability that an individual, having reached the age of 60, would eventually achieve the age of 80. They estimated this probability non-parametrically as a single number, for men and women separately in each birth cohort. They found that the survival probability did not vary across birth cohorts, which is not inconsistent with our findings. However, we estimated hazard models of the force of mortality that exploited the timing of mortality beyond age 60, enabling us to identify and estimate richer models. In addition, we used three parameters to explain the data patterns between ages 60 and 80: α, σ2, and γ. Different combinations of values for these parameters may lead to the same aggregate survival probability within this age range. Note that if our parameter α changes, the mean frailty among those aged 60 also changes. Therefore, the mean frailty among those aged 60 may change across cohorts, even though the aggregate survival probability between age 60 and age 80 does not change (provided that σ2 or γ change as well). These mitigating effects on aggregate survival probabilities are a key finding of our research.
We did not apply widely used Cox-proportional-hazard models because we specifically wanted to model the age-specific force of mortality and to estimate its parameters. The hazard model used in our study assumes that mortality beyond age 60 follows a Gompertz function, which is the appropriate functional form for historical mortality patterns.
As a control country, we used Sweden, which experienced poor harvests in the 1860s but did not see famine develop. Famines are not simply the result of crop failures. As Ó'Gráda (2007b, p. 7) points out: ‘most famines in poor economies are associated with the impact of extreme weather […] on the harvest, although, […] dramatic crop failures are neither a necessary nor a sufficient condition for famine’. In the Finnish case the backwardness of the agricultural sector together with a lack of adequate policy response from the authorities were primarily responsible for turning a crop failure into a famine (Ó'Gráda 2001). Comparing Sweden and Finland, Nelson (1988) gives three reasons why the situation in Finland deteriorated into a crisis while that in Sweden did not: first, the Finnish harvest failure was more severe; second, the relief funds provided in Finland were not adequate, because the severity of the situation was underestimated and action was delayed until 1868; finally, while both countries were strongly agrarian at that time, the percentage of people in occupations other than farming was greater in Sweden.
When defining famine, it is insufficient just to take account of harvest patterns, although famine is characterized by a considerable shortfall in food intake by a sizable number of people and is often rooted in a preceding crop failure. Poorly functioning grain markets may have exacerbated the crisis in Finland in the mid-1860s but, in a study of the regional grain market in Sweden, Ó'Gráda (2001) refutes the claim that poorly functioning grain markets were primarily responsible for the Finnish famine. Many authors emphasize that the social disruption and economic chaos caused by a famine (Pitkänen 1993; Ó'Gráda 2007a, b) is as devastating—and sometimes even more so—than the food short-' ages themselves (Ó'Gráda 2007a, b). A number of factors contribute to the large number of deaths during a famine: large-scale migration; the separation and uprooting of families; an increase in crime; the loss of land, livestock, and other assets of production; mental disorientation; and the consumption of alternative subsistence foods and loss of body weight. Thus, the core period of a famine is often defined by the number of deaths which occur rather than by the occurrence of crop failures or by rising food prices alone (Pitkänen 1993; Ó'Gráda 2007a, b).
In both Finland and Sweden the 1860s was a period of repeated crop failures (Nelson 1988; Pitkänen 1993) but only in the years 1886–88 did famine, indicated by soaring death rates, come to Finland. Deaths were attributed more to infectious diseases than to starvation (Pitkänen 1993). While malnutrition and infectious disease are inevitably intertwined, one major reason for the high death rates was that relief efforts focused on providing alternative means of income, such as construction work. The large-scale migration which took place as destitute peasants sought work promoted the outbreak of diseases such as typhus (Nelson 1988). Pitkänen (1993) has shown that death rates in the Finnish famine were particularly high in those regions hosting large numbers of migrants; both the migrants and the local population were affected.
A noteworthy finding of this study is the reduction in the standardized life expectancy of both males born during the famine and of both sexes born before the famine. There may be two reasons for this: first, the duration of the Great Finnish Famine, which was identified by counts of deaths, may have been defined too narrowly and, second, the repeated outbreak of childhood diseases before the famine may have had negative long-term effects on the health of the relevant cohorts.
In the 1860s, deaths first peaked in Finland in 1863, mainly as a result of childhood diseases such as measles and whooping cough. The latter two causes of death accounted for twice as many deaths in 1863 as they did in the actual famine years (Pitkänen 1993). Mortality increased again in spring 1866 and reached a second peak in spring 1867. After a rapid increase from December 1867 onwards, mortality reached catastrophic levels between March and August 1868 and, despite a decrease in mortality from September 1868 onwards, mortality levels remained high until summer 1869.
From the observation of harvest patterns and the number of deaths, it is plausible to argue that the cohorts born from the beginning of the 1860s until the end of 1868 were repeatedly exposed to hazardous circumstances early in life: crop failures beginning in 1862, an epidemic of childhood disease in 1863, and the Great Famine between 1866 and 1868. Many of these years—and 1863 in particular—had high levels of infant mortality and childhood disease, a fact noted by Pitkänen when he compared mortality during the famine with mortality in the pre-famine years. He pointed out that if the mortality of the pre-famine years, including the year 1863, is used as a benchmark against which to compare the infant and child mortality of the famine years, then the full impact of the famine may be underestimated.
The study reported here had three major limitations. First, because only annual counts are available for cohort data based on Lexis triangles, critical periods during pregnancy or the first years of life could not be exactly defined. In order to identify the impact of the period effect on the variance of the frailty distribution, we had to combine several annual birth cohorts that lived through these events at various ages. It is important to note that while we identified a long-term detrimental effect of being born during the famine, dates of birth could not be classified precisely enough to allow the timing of critical periods around birth with respect to famine exposure to be identified.
Second, since the data used applied to the whole country, no regional variation in the timing and the severity of the famine could be explored. On the other hand, this limitation also lent strength to the study because selection effects caused by migration out of the study area, a problem usually encountered in historical studies based on parish data, did not play a role.
Third, since malnutrition and infectious disease are inevitably intertwined, our study was unable to separate the effects of hunger and malnutrition from the effects of disease in early childhood. In general, in the absence of additional information, famine studies are not able to shed much light on underlying causal pathways leading to mortality.
In conclusion, the long-term negative effects of famine on adult health and mortality may be hidden by mortality and fertility selection, and may only be identified after accounting for differences in the frailty distributions within observed cohorts. Future research needs to take possible selection effects into account by controlling for such differences. Future studies might also fruitfully consider the issue of selection as a missing-value problem and model the unobserved outcomes for those people who, in the absence of famine, would have been conceived and had different mortality outcomes. Such work would shed light on the extent to which selection resulting from famine is caused by excess mortality or the loss of fertility.
Notes
Gabriele Doblhammer is at the Institute for Sociology and Demography, University of Rostock; the German Center for Neurodegenerative Diseases (DZNE), Bonn; the Rostock Center for the Study of Demographic Change; and the Max Planck Institute for Demographic Research, Konrad-Zuse-Strasse 1, 18057 Rostock, Germany. E-mail: doblhammer@rostockerzentrum.de. Gerard J. van den Berg is at the Department of Economics, University of Mannheim; the Institute for Labor Market Policy Evaluation (IFAU0), Uppsala; VU University Amsterdam; and the Institute for the Study of Labor (IZA), Bonn. L. H. Lumey is at the Department of Epidemiology, Mailman School of Public Health, Columbia University, New York.
The authors thank James W. Vaupel for his critical review of the manuscript and his helpful comments, Andreas Wienke for his help with the SAS procedures, and the anonymous reviewers whose comments helped considerably to improve the paper. Gerard van den Berg is also grateful to the Humboldt Foundation for his Alexander von Humboldt Professorship Prize.
References
- Abbring J. H., Van den Berg G. J. The unobserved heterogeneity distribution in duration analysis. VU University Amsterdam; 2001. Working Paper. [Google Scholar]
- Abbring J. H., Van den Berg G. J. The unobserved heterogeneity distribution in duration analysis. Biometrika. 2007;94(1):87–99. [Google Scholar]
- Almond D. Is the 1918 influenza pandemic over? Long-term effects of in utero influenza exposure in the post-1940 U.S. population. Journal of Political Economy. 2006;114(4):672–711. [Google Scholar]
- Ansart S., Pelat C., Boelle P.-Y., Carrat F., Flahault A., Valleron A.-J. Mortality burden of the 1918–1919 influenza pandemic in Europe. Influenza and Other Respiratory Viruses. 2009;3(3):99–106. doi: 10.1111/j.1750-2659.2009.00080.x. doi:10.1111/j.1750-2659.2009.00080.x. [DOI] [PMC free article] [PubMed] [Google Scholar]
- Barker D. J. P. Mothers, Babies, and Disease in Later Life. London: British Medical Journal Publishing Group; 1994. [Google Scholar]
- Bengtsson T., Lindström M. Airborne infectious diseases during infancy and mortality in later life in southern Sweden, 1766–1894. International Journal of Epidemiology. 2003;32(2):286–294. doi: 10.1093/ije/dyg061. [DOI] [PubMed] [Google Scholar]
- Bozzoli C., Deaton A., Quintana-Domeque C. Adult health and childhood disease. Demography. 2009;46(4):647–669. doi: 10.1353/dem.0.0079. [DOI] [PMC free article] [PubMed] [Google Scholar]
- Brainerd E., Sieger M. V. The economic effects of the 1918 influenza epidemic. Paris: Centre for Economic Policy Research (CEPR); 2003. Discussion Paper 3791. [Google Scholar]
- Case A., Paxson C. Sex differences in morbidity and mortality. Demography. 2005;42(2):189–214. doi: 10.1353/dem.2005.0011. [DOI] [PubMed] [Google Scholar]
- Christensen K., Doblhammer G., Rau R., Vaupel J. W. Ageing populations: the challenges ahead. The Lancet. 2009;374(9696):1196–1208. doi: 10.1016/S0140-6736(09)61460-4. [DOI] [PMC free article] [PubMed] [Google Scholar]
- Deaton A. Height, health, and development. Proceedings of the National Academy of Sciences. 2007;104(33):13232–13237. doi: 10.1073/pnas.0611500104. [DOI] [PMC free article] [PubMed] [Google Scholar]
- Deaton A. Instruments, randomization, and learning about development. Journal of Economic Literature. 2010;48(2):424–455. [Google Scholar]
- Doblhammer G., Vaupel J. W. Life span depends on month of birth. Proceedings of the National Academy of Sciences. 2001;98(5):2934–2939. doi: 10.1073/pnas.041431898. [DOI] [PMC free article] [PubMed] [Google Scholar]
- Doblhammer G. The Late Life Legacy of Very Early Life. Berlin: Springer; 2004. [Google Scholar]
- Fridlizius G. The deformation of cohorts: nineteenth century mortality decline in a generational perspective. Scandinavian Economic History Review. 1989;37(3):3–17. [Google Scholar]
- Gørgens T., Meng X., Viathianathan R. Stunting and selection effects of famine: a case study of the Great Chinese Famine. Journal of Development Economics. 2012;97(1):99–111. [Google Scholar]
- Hales C. N., Barker D. J. P. The thrifty phenotype hypothesis. British Medical Bulletin. 2001;60:5–20. doi: 10.1093/bmb/60.1.5. [DOI] [PubMed] [Google Scholar]
- Heckman J., Singer B. A method for minimizing the impact of distributional assumptions in econometric models for duration data. Econometrica. 1984;52(2):271–320. [Google Scholar]
- Huang C., Li Z., Wang M., Martorell R. Early life exposure to the 1959–1961 Chinese famine has long-term health consequences. The Journal of Nutrition. 2010;140(10):1874–1878. doi: 10.3945/jn.110.121293. [DOI] [PubMed] [Google Scholar]
- Kannisto V., Christensen K., Vaupel J. W. No increased mortality in later life for cohorts born during famine. American Journal of Epidemiology. 1997;145(11):987–994. doi: 10.1093/oxfordjournals.aje.a009067. [DOI] [PubMed] [Google Scholar]
- Leon D. A., Lithell H. O., Vågerö D., Koupilová I., Mohsen R., Berglund L., Lithell U. B., McKeigue P. M. Reduced fetal growth rate and increased risk of death from ischaemic heart disease: cohort study of 15 000 Swedish men and women born 1915–29. British Medical Journal. 1998;317(7153):241–245. doi: 10.1136/bmj.317.7153.241. [DOI] [PMC free article] [PubMed] [Google Scholar]
- Leon D. A. Biological theories, evidence, and epidemiology. International Journal of Epidemiology. 2004;33(6):1167–1171. doi: 10.1093/ije/dyh389. [DOI] [PubMed] [Google Scholar]
- Lindeboom M., Portrait F., Van den Berg G. J. Long-run effects on longevity of a nutritional shock early in life: the Dutch Potato famine of 1846–1847. Journal of Health Economics. 2010;29(5):617–629. doi: 10.1016/j.jhealeco.2010.06.001. [DOI] [PubMed] [Google Scholar]
- Low B. S. Why Sex Matters: A Darwinian Look at Human Behavior. Princeton, NJ: Princeton University Press; 2001. [Google Scholar]
- Lumey L. H., Stein A. D., Susser E. Prenatal famine and adult health. Annual Review of Public Health. 2011;32:237–262. doi: 10.1146/annurev-publhealth-031210-101230. doi:10.1146/annurev-publhealth-031210-101230. [DOI] [PMC free article] [PubMed] [Google Scholar]
- Meng X., Quian N. The long run impact of exposure to famine on survivors: evidence from China's Great Famine. National Bureau of Economic Research (NBER); 2009. Working Paper w14917. [Google Scholar]
- Nelson M. C. Bitter bread: the famine in Norrbotten 1867–68. 1988. Dissertation, Acta Universitatis Upsaliensis, Uppsala.
- Oeppen J., Vaupel J. W. Broken limits to life expectancy. Science. 2002;296(5570):1029–1031. doi: 10.1126/science.1069675. [DOI] [PubMed] [Google Scholar]
- Ó'Gráda C. Markets and famines: evidence from nineteenth century Finland. Dublin: Open Access publications from University College; 2001. urn:hdl:10197/466. [PubMed] [Google Scholar]
- Ó'Gráda C. Famine demography. Centre for Economic Research, University College Dublin; 2007a. Working Paper WP07/21. [Google Scholar]
- Ó'Gráda C. Making famine history. Journal of Economic Literature. 2007b;XLV:5–38. [Google Scholar]
- Painter R. C., Roseboom T. J., Bossuyt P. M. M., Osmond C., Barker D. J. P., Bleker O. P. Adult mortality at age 57 after prenatal exposure to the Dutch famine. European Journal of Epidemiology. 2005;20(8):673–676. doi: 10.1007/s10654-005-7921-0. [DOI] [PubMed] [Google Scholar]
- Pitkänen K. J. Deprivation and Disease. Mortality during the Great Finnish Famine of the 1860s. Helsinki: Finnish Demographic Society; 1993. [Google Scholar]
- Song S. Does famine have a long-term effect on cohort mortality? Evidence from the 1959–1961 Great Leap Forward famine in China. Journal of Biosocial Sciences. 2009;41(4):469–491. doi: 10.1017/S0021932009003332. [DOI] [PubMed] [Google Scholar]
- Song S. Mortality consequences of the 1959–1961 Great Leap Forward famine in China: debilitation, selection, and mortality crossovers. Social Science & Medicine. 2010;71(3):551–558. doi: 10.1016/j.socscimed.2010.04.034. [DOI] [PubMed] [Google Scholar]
- Stein Z. A., Susser M., Saenger G., Marolla F. Famine and Human Development: The Dutch Hunger Winter of 1944–1945. New York: Oxford University Press; 1975. [Google Scholar]
- Thatcher A. R. The long-term pattern of adult mortality and the highest attained age. Journal of the Royal Statistical Society A. 1999;162(1):5–43. doi: 10.1111/1467-985x.00119. [DOI] [PubMed] [Google Scholar]
- Van den Berg G. J. Duration models: specification, identification and multiple durations. In: Heckman J. J., Leamer E., editors. Handbook of Econometrics. Vol. 5. Amsterdam: North-Holland; 2001. pp. 3381–3463. [Google Scholar]
- Van den Berg G. J., Lindeboom M., Portrait F. Economic conditions early in life and individual mortality. American Economic Review. 2006;96(1):290–302. doi: 10.1257/000282806776157740. [DOI] [PubMed] [Google Scholar]
- Van den Berg G. J., Doblhammer G., Christensen K. Exogenous determinants of early-life conditions, and mortality later in life. Social Science & Medicine. 2009;68(9):1591–1598. doi: 10.1016/j.socscimed.2009.02.007. [DOI] [PubMed] [Google Scholar]
- Vaupel J. W., Manton K. G., Stallard E. The impact of heterogeneity in individual frailty on the dynamics of mortality. Demography. 1979;16(3):439–454. [PubMed] [Google Scholar]
- Vaupel J. W. Biodemography of human aging. Nature. 2010;464:536–542. doi: 10.1038/nature08984. [DOI] [PMC free article] [PubMed] [Google Scholar]
- Weiss K. M. The biodemography of variation in human frailty. Demography. 1990;27(2):185–206. [PubMed] [Google Scholar]
- Wilmoth J. R., Andreev K., Jdanov D., Glei D. A., Boe C., Bubenheim M., Philipov D., Shkolnikov V., Vachon P. Methods protocol for the Human Mortality Database. 2007. Available: http://www.mortality.org/hmd/SWE/InputDB/MethodsProtocol.pdf.