

Abstract
The perception of a melody is invariant to the absolute properties of its constituting notes, but depends on the relation between them—the melody's relative pitch profile. In fact, a melody's “Gestalt” is recognized regardless of the instrument or key used to play it. Pitch processing in general is assumed to occur at the level of the auditory cortex. However, it is unknown whether early auditory regions are able to encode pitch sequences integrated over time (i.e., melodies) and whether the resulting representations are invariant to specific keys. Here, we presented participants different melodies composed of the same 4 harmonic pitches during functional magnetic resonance imaging recordings. Additionally, we played the same melodies transposed in different keys and on different instruments. We found that melodies were invariantly represented by their blood oxygen level–dependent activation patterns in primary and secondary auditory cortices across instruments, and also across keys. Our findings extend common hierarchical models of auditory processing by showing that melodies are encoded independent of absolute pitch and based on their relative pitch profile as early as the primary auditory cortex.
Keywords: auditory cortex, classifiers, fMRI, melody, relative pitch
Introduction
Most sounds we experience evolve over time. In accord with “Gestalt” psychology, we perceive more than just the sum of the individual tones that make up a melody. A temporal re-arrangement of the same tones will give rise to a new melody, but a given melodic “Gestalt” will remain the same even when all pitches are transposed to a different key (Ehrenfels 1890). The stable melodic percept therefore appears to emerge from the relationship between successive single notes, not from their absolute values. This relationship is known as relative pitch and is assumed to be processed via global melodic contour and local interval distances (Peretz 1990). Theoretical models of auditory object analysis suggest that the integration of single auditory events to higher-level entities may happen at the stage of the auditory cortex (Griffiths and Warren 2002, 2004). Moreover, it has been suggested that auditory object abstraction, that is, perceptual invariance with regard to physically varying input properties, may emerge at the level of the early auditory cortex (Rauschecker and Scott 2009). However, so far there is no direct experimental evidence on encoding of abstract melodic information at early auditory processing stages.
In the present study, we used functional magnetic resonance imaging (fMRI) and variations of 2 different melodies to investigate pitch-invariant encoding of melodic “Gestalt” in the auditory cortex. We expected neural response differences to the 2 melodies to be reflected in patterns of blood oxygen level–dependent (BOLD) activation rather than in mean signal as both melodies were matched in terms of low-level acoustic properties. For stimulation, we used a modified version of the Westminster Chimes, as this melody is easy to recognize and subject to general knowledge. By dividing the entire pitch sequence in half, we obtained 2 perceptually distinct melodies. Both were matched in rhythm and based on the exact same 4 harmonic pitches, but differed in temporal order, that is, in melodic Gestalt (Figs. 1 and 2). Playing both melodies on the same instrument and in the same key allowed us to test whether BOLD patterns represented a melody's “Gestalt”, that is, its relative pitch profile. In addition, to test whether relative pitch-encoding was invariant with regard to absolute pitch, we played both melodies in a different key, transposed by 6 semitones. Data were analyzed using multivariate pattern classification, as this method can be used to determine statistics of activation differences but also of commonalities (Seymour et al. 2009), which would be needed to test whether activity patterns of both melodies generalized across different keys and instruments.
Figure 1.

Melodies in piano-roll notation. Both stimuli are shown in the original key as well as in the transposed version, 6 semitones lower. Note that in the transposed condition all 4 pitches comprise different chromae as compared with the original key. A behavioral experiment prior to fMRI scanning assured that all participants were able to distinguish between both melodies.
Figure 2.
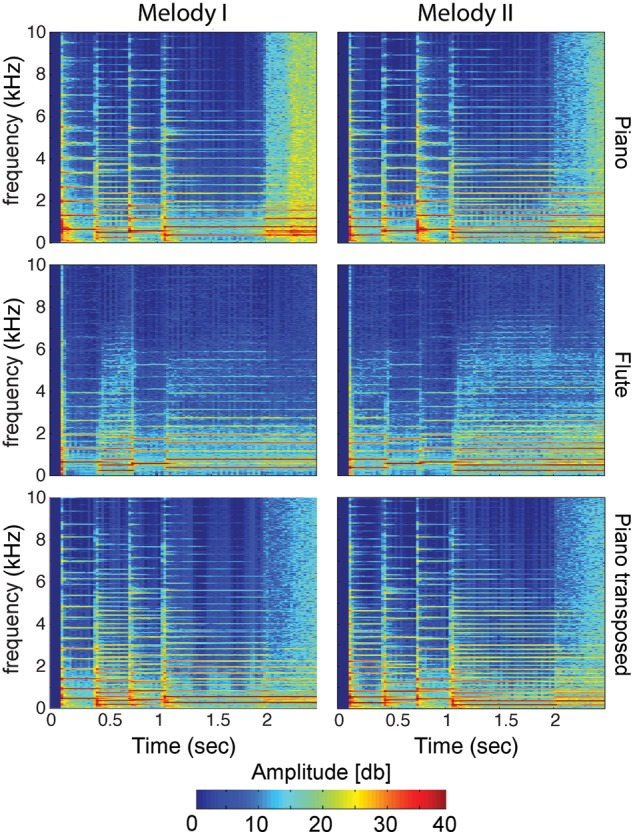
Time-frequency spectrograms of melodic stimuli. As expected, after transposition to a different key systematic frequency shifts between original and transposed melodies exist. Moreover, different distributions of harmonic power between piano and flute reflect their difference in timbre.
Materials and Methods
Participants
Eight volunteers (all non-musicians, 7 males, 1 female) aged between 24 and 37 years with no history of hearing impairment participated in this study. All were given detailed instructions about the procedures and provided written informed consent prior to the experiments. The study was approved by the ethics committee of the University Hospital Tübingen.
Auditory Stimuli
Stimuli were generated using Apple's Garageband and post-processed using Adobe Audition. We employed 2 melodies, both comprising the same 4 pitches (E4, C3, D4, and G3). Both melodies were played on piano and flute. Additionally, for the piano we also transposed both melodies by 6 semitones downwards resulting in 2 additional melodies comprising 4 different pitches (A#3, F#2, G#3, and C#3). Thus, altogether our experiment involved 6 melodic conditions. We chose a transposition distance of 6 semitones as this assured that chromae of all 4 pitches composing the transposed melodies were different from those played in the original key. Melodies were sampled at 44.1 kHz, matched in root-mean-square power and in duration (2 s, first 3 tones: 312 ms, last tone: 937 ms; preceding silence period of 127 ms). Both auditory channels were combined and presented centrally via headphones. Melodies were played using a tempo of 240 bpm.
We performed a control experiment to rule out that any effect observed in the main experiment could be accounted for by the duration of the last tone that was longer than the preceding 3 in all melodic sequences (c.f. Fig. 1). In the control experiment the durations of all tones were matched, with the same duration as the first 3 (312 ms) of the initial experiment.
Training Prior to Scanning
To ensure that all participants were able to recognize both melodies regardless of key and instrument we conducted a simple 2-alternatives forced-choice melody discrimination task prior to scanning. Each participant listened to a randomly ordered sequence containing all 6 melodic stimuli and pressed 1 of 2 buttons to classify the melody as melody I or II. Participants spent 10–25 min performing this task until they felt comfortable in recognizing the 2 melodies.
fMRI Measurements
For each participant 6 experimental runs containing 343 volumes were acquired, plus 1 run for a separate sound localizer comprising 226 volumes. Functional data were recorded on a Siemens 3T TIM Trio scanner using a T2*-weighted gradient echo-planar imaging (EPI) sequence. Functional images were acquired using a low-impact-noise acquisition fMRI sequence, which increases the dynamic range of the BOLD signal in response to acoustic stimuli (Seifritz et al. 2006). In short, this sequence elicits a quasi-continuous acoustic gradient noise that induces less scanner-related BOLD activity compared with conventional EPI sequences (which induce increased levels of auditory baseline activity due to their pulsed scanner noise). Functional volumes were acquired using the following parameters: Gradient recalled echo-planar acquisition sequence with 18-image slices, 3-mm slice thickness, 2100 ms volume time of repetition, 20 × 20 cm field of view, 96 × 96 matrix size, 48 ms echo time, 80° flip angle, 1157 Hz bandwidth, resulting in-plane resolution 2.1 × 2.1 mm2. Slices were positioned such that the temporal cortex including Heschl's gyrus (HG), superior temporal sulcus (STS), and superior temporal gyrus (STG) was fully covered. For each participant, a structural scan was also acquired with a T1-weighted 1 × 1 × 1 mm3 sequence.
Experimental Paradigm
During data acquisition, stimuli were delivered binaurally at a comfortable volume level using MRI compatible headphones. For each participant, 6 runs of data were acquired, each comprising 36 stimulus blocks. Each stimulus block consisted of randomly either 5 or 6 identical melodic stimuli (each melody lasted 2 s, followed by 500 ms silence). The order of stimulus blocks was pseudo randomized and counterbalanced such that each of the 6 stimulus conditions was equally often preceded by all stimulus conditions. Thus, each run comprised 6 repetitions of all 6 melodic conditions. Blocks were separated by silence periods of 5 s. Preceding each run, 4 dummy volumes were acquired, and 1 randomly selected additional melodic block was included to ensure a stable brain state after the onset of each run. Dummies and the initial dummy block were removed prior to analysis. The functional localizer consisted of 16 randomly selected melody blocks of the main experiment, each separated by silence periods of 12.5 s. Participants were instructed to report how often a given melody was played within a stimulation block by pressing 1 of 2 buttons of a MR compatible button box during the silence periods after each block (in main experiment and localizer). In the main experiment as well as in the functional localizer stimulation blocks were presented in a jittered fashion.
fMRI Preprocessing and Univariate Analysis
All neuroimaging data was preprocessed using SPM5 (http://www.fil.ion.ucl.ac.uk/spm/). Functional images were corrected for slice acquisition time, realigned to the first image using an affine transformation to correct for small head movements and EPI distortions were unwarped, and spatially smoothed using an isotropic kernel of 3-mm full width at half-maximum. Preprocessed images of each run were scaled globally, high pass filtered with a cutoff of 128 s, and convolved with the hemodynamic response function before entering a general linear model with one regressor of interest for each stimulus block. Additionally, regressors for SPM realignment parameters and the mean signal amplitude of each volume obtained prior to global scaling were added to the model. For the sound localizer a general linear model was fitted involving one regressor for the melody blocks and one regressor for the silence periods. Used as a univariate feature selection for further multivariate analysis, the t-contrast “sound versus silence” allowed us to independently rank voxels according to their response sensitivity to melodic stimuli [see Recursive Feature Elimination (RFE) methods].
Multivariate Pattern Analysis
Preprocessed functional data were further analyzed using custom software based on the MATLAB version of the Princeton MVPA toolbox (http://code.google.com/p/princeton-mvpa-toolbox/). Regressor beta-values (one per stimulus block) from each run were z-score normalized and outliers exceeding a value of 2 standard deviations were set back to that value. Data were then used for multivariate pattern analysis employing a method that combines machine learning with an iterative, multivariate voxel selection algorithm. This method was recently introduced as “RFE” (De Martino et al. 2008) and allows the estimation of maximally discriminative response patterns without an a priori definition of regions of interest. Starting from a given set of voxels a training algorithm (in our case a support vector machine algorithm with a linear kernel as implemented by LIBSVM (http://www.csie.ntu.edu.tw/~cjlin/libsvm/) discards iteratively irrelevant voxels to reveal the informative spatial patterns. The procedure performs voxel selection on the training set only, yet increases classification performance of the test data. The method has proved to be particularly useful in processing data of the auditory system (Formisano et al. 2008; Staeren et al. 2009). Our implementation was the following: In a first step, beta estimates of each run (one beta estimate per stimulus block/trial) were labeled according to their melodic condition (e.g., melody I played by flute). Within each participant and across all runs, this yielded a total of 36 trials for each melodic condition. Subsequently, BOLD activation patterns were analyzed using the LIBSVM-based RFE. For each pair of melodic conditions (e.g., both melodies played by flute), trials were divided into a training set (30 trials per condition) and a test set (6 trials per condition), with training and test sets originating from different fMRI runs. The training set was used for estimating the maximally discriminative patterns with the iterative algorithm; the test set was only used to assess classification performance of unknown trials (i.e., not used in the training).
All analyses started from the intersection of voxels defined by an anatomically delineated mask involving both hemispheres (including temporal pole, STG, STS, and insula, Supplementary Material) and sound responsive voxels identified in the separate localizer experiment (t-contrast sound vs. silence). Voxels falling into the anatomical mask were ranked according to their t-values and the most responsive 2000 were selected. Compared with recent studies employing RFE in combination with auditory fMRI data, a starting set of 2000 voxels is still the upper limit for this type of analysis (De Martino et al. 2008; Formisano et al. 2008; Staeren et al. 2009). Due to noise, in large voxel sets the RFE method is prone to incorrectly labeling potentially informative voxels with too low weights, thus discarding them early in the iteration cycle, which ultimately leads to suboptimal classification of the test-set. To minimize this problem, we needed to further preselect the voxel set prior to RFE, which we wanted to do on the basis of classifier performance (within the training set) rather than on t-values alone. To this end, we stepwise carried out cross-validated (leave-one-run-out) classifications and removed each time the 4% voxels with the lowest t-values obtained in the sound-localizer. Similar to the RFE approach, we subsequently selected the voxel set with the peak classification accuracy for further analysis. In contrast to RFE; however, we still used each voxel's sound-responsiveness (assessed by the functional sound localizer) as its discard criterion and thus avoided the rejection of potentially informative data by noise-driven low SVM weights. This initial feature selection procedure did not involve any testing data used for the subsequent RFE but exclusively independent data. We set the stop criterion of the initial feature selection method at 1000 voxels to get a lower voxel limit for the RFE analysis as employed previously (Staeren et al. 2009). The final voxel population on which the RFE analysis started ranged therefore from 2000 to 1000 voxels. We employed 6 cross-validation cycles, each involving different runs for training and testing. For each of these cross-validations, 10 RFE steps were carried out, each discarding 40% of voxels. Crucially, classification performance of the current set of voxels was assessed using the external test set. The reported correctness for each binary comparison was computed as an average across the 6 cross-validations. Single-participant discriminative maps corresponded to the voxel-selection level that gave the highest average correctness. These maps were sampled on the reconstructed cortex of each individual participant and binarized.
To compare classification performances between left and right hemispheres, we additionally ran the same RFE analysis on each hemisphere separately. To match the number of starting voxels with those of the analysis involving both hemispheres, we separately defined the anatomical region of interest (ROI) for each hemisphere and also ranked voxels separately for a given hemisphere according to its statistical t-values in the sound localizer map. Thus, also within each hemisphere, the final voxel population on which further analysis started ranged from 2000 to 1000 voxels.
Discriminative Group Maps
To examine the spatial consistency of the discriminative patterns across participants, group-level discriminative maps were generated after cortex-based alignment of single-participant discriminative maps (Fischl et al. 1999). For a given experiment, the binary single-participant maps were summed up, and the result was thresholded such that only vertices present in the individual discriminative maps of at least 5 of the 8 participants survived. A heat-scale indicates consistency of the voxel patterns distinguishing a given experimental condition pair in that the highest values correspond to vertices selected by all participants. As each individual discriminative map only contributes voxels that survived the recursive feature elimination, this group map can be interpreted as a spatial consistency measure across participants.
Tests for Lateralization Biases
To detect possible lateralization biases we tested classification performances from left and right hemispheres against each other on the group level using a one sample t-test. Additionally, we tested for a possible hemispheric bias during selection of discriminative voxels by the RFE analysis that involved data of both hemispheres. To this end, we compared the numbers of discriminative voxels within each hemisphere across the group. For each participant and classification, we calculated the lateralization index as the difference between the number of voxels of left and right hemisphere divided by the number of voxels selected in both hemispheres. A lateralization index of 1 or −1 thus means that all voxels selected by the RFE fell into 1 hemisphere. An index of 0 indicates that there was no lateralization at all. We then tested for systematic lateralization biases across the group. For generalization across keys and instruments voxel counts of both classification cycles (see RFE methods) were combined.
Results
De-coding Melodies From Voxel Patterns
Initially, we examined whether both melodies, played in the same key and on the same instrument could be distinguished by their corresponding BOLD patterns. We trained the classifier separately on piano or flute trials, respectively, and applied a leave-one-out cross-validation approach across runs to test the classifier on independent runs (see Materials and Methods). Within both instruments melodies were classified significantly above chance (piano: 0.65, P = 1.22 × 10−05; and flute: 0.63 P = 4.08 × 10−05; 1-tailed t-test, n = 8), indicating that the BOLD patterns were melody-specific for these stimuli (see Fig. 3A). To illustrate the anatomical consistency of discriminative voxel populations across participants we generated a group-level map showing only voxels that coincided anatomically in at least 5 out of 8 participants. Figure 4A and Supplementary Figure S1 show that the most consistent discriminative voxel patterns span bilaterally from lateral HG into the Planum Temporale (PT).
Figure 3.

De-coding results based on fMRI voxel patterns of early auditory cortex. (A) Performance of classification between melodies, tested separately on 2 instruments. (B) Classification performance between melodies played on different instruments and different keys. All results were confirmed using a sub-sample of 5 participants and adapted versions of our melodic stimuli where all pitches were of matched duration (Supplementary Table S2). *P < 0.05, Bonferroni corrected for 4 comparisons.
Figure 4.
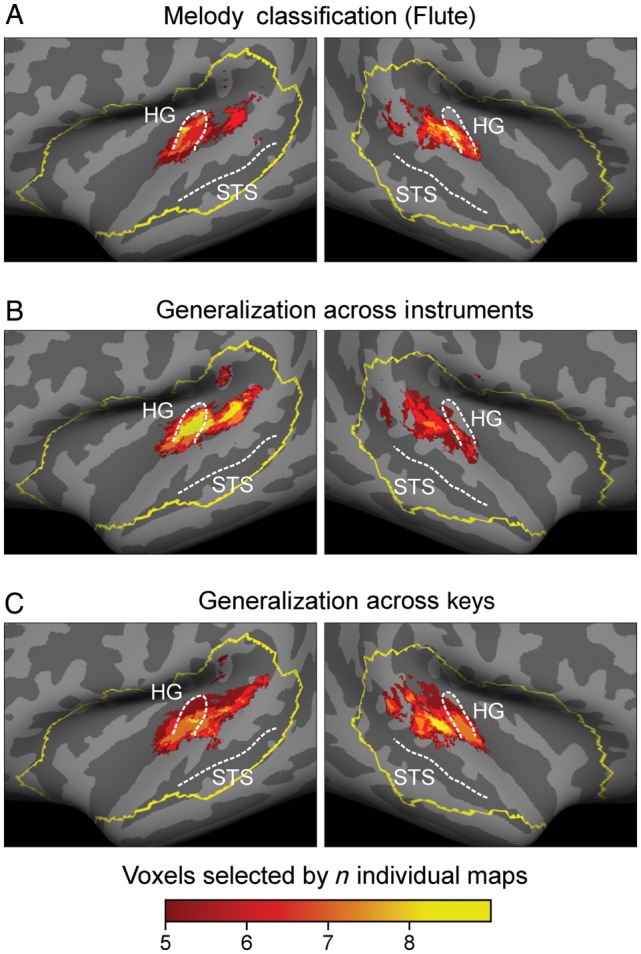
Multiparticipant consistency maps of discriminative voxels shown on a standard brain surface of the temporal lobes. The yellow outline illustrates the anatomically defined region of interest from which all analyses started from. All group maps were created by summation of the individual discriminative voxel maps of all 8 participants. Each map was thresholded such that a voxel had to be selected in at least 5 individuals to appear on the group map. Color coding indicates consistency across participants. Across all classifications no lateralization bias was found (c.f. Supplementary Table S1). For group map of melody classification on piano see Supplemental Figure S1.
Invariance to Instrument and Key
To examine the influence of timbre on melody classification, in a next step, we trained the classifier to distinguish both melodies played on one instrument and tested it using the melodies played on the other instrument. To assure that each instrument was once used for training and once for testing, classification was conducted twice and accuracies of both turns were averaged. Figure 3B shows classification results across instruments. Despite substantial differences in energy distribution and frequency spectra between both instruments, this classification also succeeded significantly above chance (0.58, P = 6.28 × 10−05; 1-tailed t-test, n = 8). Again, the inspection of the corresponding discriminative group maps revealed a distribution of discriminative voxels that is consistent with our previous results, spanning bilaterally in HG and PT (Fig. 4B).
Subsequently, we examined whether BOLD activation patterns preserved melody-specific information across different keys. Note that after transposition, the only common property that characterized the 2 melodies as identical was their relative change in pitch height evolving over time, that is, its melodic “Gestalt”. We trained the classifier on both melodies played in one key and tested it on the same melodies transposed by 6 semitones to a different key (see Materials Methods). To use both keys once for testing and once for training we again conducted this classification twice and averaged both performances. Figure 3B shows that classification across keys (0.58, P = 2.60 × 10−04; 1-tailed t-test, n = 8) succeeded significantly above chance. This implies that BOLD patterns do not only represent differences in absolute pitch but that they also code for relative pitch, that is, information that is necessary for the concept of melodic “Gestalt”. The inspection of the corresponding discriminative group maps revealed a distribution of discriminative voxels spanning bilaterally in HG and PT (Fig. 4C).
Tests for Lateralization Effects Between Left and Right Hemispheres
To examine potential lateralization effects in coding of melodic “Gestalt”, we compared the classification performances obtained during separate analysis of left and right hemispheric ROIs. This however did not reveal any systematic differences between hemispheres [2-tailed t-test; Melody Classification t(15) = 0.52, P = 0.61; Instruments t(7) = 0.04, P = 0.97; Keys t(7) = 0.81, P = 0.45; c.f. Supplementary Figure S2]. Moreover, we tested for a potential selection bias during RFE analysis on the joint ROI with voxels of both hemispheres. However, this analysis also did not reveal any systematic preference towards either hemisphere; that is, voxels of both hemispheres were equally likely to be selected during RFE (2-tailed t-test; Melody Classification t(15) = −0.09, P = 0.93; Instruments t(7) = 0.89, P = 0.40; Keys t(7) = −0.89, P = 0.40; c.f. Supplementary Table S1).
In a last step, using a subset of 5 of our 8 participants, we examined whether the duration of the last tone (which was longer than the remaining 3) could have affected our results. Note that this would have been relevant only for distinguishing non-transposed melodies, as for the transposed ones low-level pitch information could not have provided discriminative cues. In any case, we were able to replicate all results with similar de-coding performances using adapted melodies with matched duration of all pitches (Supplementary Table S2).
Localizing Human Primary Auditory Cortex
To provide an objective measure for the extent of overlap between discriminative voxels and the anatomical location of primary auditory cortex (PAC), we related our results to the histologically defined areas Te1.0, Te1.1, and Te1.2 (Morosan et al. 2001). Figure 5A shows all 3 of these areas (at a probability threshold of 30%) on the standard surface used for all group analyses in this study. There was a close overlap between all cytoarchitectonically defined primary regions and the anatomical landmarks of HG. To directly compare the 3 anatomically defined core regions with our results, we show their common outline on top of an average of all group maps obtained by all classifications of the 2 melody conditions (Fig. 5B). Even though substantial parts of this map extend to PT, there is a high degree of agreement between the histologically defined PAC and the average discriminative voxel-maps.
Figure 5.
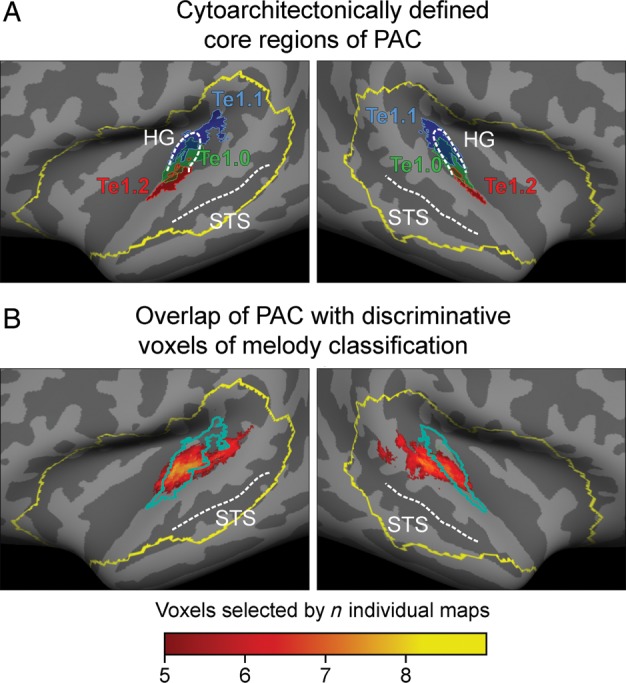
(A) Spatial overlap between the cytoarchitectonically defined PAC (areas Te 1.0, 1.1, and 1.2, probabilistic threshold: 30%) and an average group map of discriminative voxels for all melody classifications (B). Substantial overlap exists between our results and areas Te.
Discussion
We examined neural representations of melodic sequences in the human auditory cortex. Our results show that melodies can be distinguished by their BOLD signal patterns as early as in HG and PT. As our melodies differed only in the sequence, but not identity of pitches, these findings indicate that the temporal order of the pitches drove discriminative pattern formation. Importantly, our results show that the voxel patterns were diagnostic for melodies also when they were played on different instruments, and even when they were transposed by 6 semitones into a different key. Our findings therefore suggest that melodic information is represented as relative pitch contour, invariant to low-level pitch or timbre information, in early auditory cortex.
By definition, a melody consists of several pitches, integrated across time. Previous evidence points towards a role of a region anterior to HG in the processing of pitch changes. Activity in this area was found to correlate with the amount of frequency change over time (Zatorre and Belin 2001). Equally, univariate contrasts between melodic stimuli (simply defined as variations of pitch over time) and frequency matched noise, fixed pitch (Patterson et al. 2002) or silence (Brown et al. 2004) did activate this area. However, univariate contrasts between different melodic excerpts (i.e., random vs. diatonic melodies), did not lead to differential activation there or in any other brain area (Patterson et al. 2002). Thus, the role of regions anterior to HG in differential melody encoding remains elusive. Since some voxels anterior to HG were also active in our sound localizer contrast “sound versus silence”, they were included in the RFE analysis (c.f. representative participant in Supplementary Figure S3). However, voxels of this region turned out to be non-discriminative during melody classification. Even though this null finding does not necessarily imply a general lack of melody-specific information in this area (Bartels et al. 2008), we found that among all auditory regions examined, only BOLD patterns of PAC and PT held sufficient information to distinguish the 2 highly controlled melodies that consisted of permutations of 4 identical pitches. When played on the same instrument the only feature that differed between our melodies was their relative pitch profile, that is, their melodic “Gestalt”. Importantly, melodic information in HG and PT was not bound to a specific key but, like perceptual melodic “Gestalt”, also generalized across different keys. Relative pitch information in HG and PT thus appears to be independent of absolute frequency.
Another important question concerns hemispheric asymmetry. Our results did not show any hemispheric bias in melodic processing. Neither were we able to detect systematic differences in classification performances between left and right hemispheres (Supplementary Figure S2) nor did the RFE analysis preferably recruit voxels from one hemisphere when employed on a joint ROI including voxels of both hemispheres (Supplementary Table S1). The lack of lateralization found here stands in contrast to previous evidence that points towards a hemispheric specialization regarding specific aspects of melody processing. Patient studies suggest a differential specialization for processing of melodic contour and interval distance in right and left hemispheres, respectively (Peretz 1990). This principle of lateralization was also found by a recent fMRI study, however with reversed roles for left and right hemispheres (Stewart et al. 2008). Additionally, lateralization effects regarding differences in spectral resolution in the pitch domain were reported (Hyde et al. 2008).
We should point out that our evidence is nevertheless in no conflict with that of prior literature, firstly as our stimuli differ, and secondly as we used an entirely distinct approach to analyze data. In the present study, the 2 melodies varied both in their melodic contours and in their interval profiles. Hemispheric specialization regarding these 2 dimensions would therefore predict the involvement of both auditory cortices (Peretz 1990). The same idea applies to spectral lateralization. The smallest interval distance used in the present study was 2 semitones. Activation biases toward the right auditory cortex were however only reported when stimuli involved smaller pitch distances and both sides responded to a similar extent when stimuli involved an interval distance of 2 semitones (Hyde et al. 2008). The general lack of lateralization biases in pitch processing is moreover compatible with recent findings of another group (Hall and Plack 2009) but contradicts former studies reporting musical pitch processing being lateralized to the right PT (Patterson et al. 2002; Zatorre et al. 2002). In the context of voxel pattern classification, it should also be kept in mind that callosal connections can transfer information from one hemisphere to the other. In the visual cortex, for example, it has been shown that voxel patterns of the un-stimulated hemisphere can encode the attended motion-direction of the stimulated hemifield (Serences and Boynton 2007).
Pitch processing is generally associated with lateral HG. For example, based on iterated rippled noise (IRN) stimuli several studies have shown increased activation in this region associated with pitch (Griffiths et al. 1998; Patterson et al. 2002; Hall et al. 2005). However, recent evidence suggests that not pitch saliency per se but spectro-temporal modulations correlated with pitch saliency may be the feature of IRN stimuli that activates lateral HG (Hall and Plack 2009; Barker et al. 2012). It is moreover still unclear whether binaural pitch or pure tones in noise do activate lateral HG or not (Hall et al. 2005; Hall and Plack 2009). Thus, the role of lateral HG in pitch processing is at present still under debate. As we aimed to examine the processing of melodic patterns rather than that of pitch per se, in the present study we exclusively composed our melodies using harmonic pitches. Additionally, to examine melodic “Gestalt” independently of absolute pitch, we composed both melodies based on permutations of identical pitches and generalized relative pitch information across different keys. Our results are thus not directly comparable with studies of pitch processing that typically contrast a given pitch stimulus with control stimuli that do not generate a pitch percept, or different pitch eliciting stimuli associated with varying pitch salience. Yet our findings are generally compatible with evidence for pitch representations in early auditory cortex including lateral HG as all discriminative voxel maps of melodic representations (i.e., a variation of pitch over time) involved patterns spanning from HG to PT (Fig. 4).
The representation of melodic “Gestalt” in early auditory cortex is compatible with patient studies pointing towards a role for HG in processing of musical intervals (Stewart et al. 2006). For example, one study reported deficits in sensitivity to relative pitch in a patient with a unilateral lesion of HG, while another patient with intact HG but lesions in rostral auditory association cortex did not show these deficits (Peretz et al. 1994). Nevertheless, there is also good clinical evidence that regions beyond HG play a role in melody processing (Liegeois-Chauvel et al. 1998; Stewart et al. 2006). Deficits in melody perception and the analysis of musical intervals are thus not only associated with lesions posterior to HG and PT but also with those of the parieto-temporal junction or lesions in STG, lying anterior to HG (Stewart et al. 2006). Moreover, a recent neuroimaging study suggested a role for intra-parietal sulcus in active melody transposition (Foster and Zatorre 2010).
As the present study was exclusively focused on early auditory areas we only scanned the temporal lobe and examined sound-responsive voxels therein (see methods). Thus, to fully understand the cortical network underpinning the processing of relative pitch, further experiments are desirable. In particular, future data might also help clarify whether the melodic information we observed in BOLD patterns of HG originated in HG was conveyed to it by sensory ascending activity, or whether it was fed back to HG from higher-level brain areas. In the visual cortex, for example, it is known that the primary visual cortex is modulated by high-level object or motion information and that its patterns can encode high-level object information (Williams et al. 2008).
Nevertheless, our findings challenge a recent study that attributes the extraction of melodic contour exclusively to higher areas (Lee et al. 2011). In fact, a major part of auditory feature selection is assumed to be completed at subcortical stages already (Nelken 2004). As PAC lies between inferior colliculus and secondary auditory areas, it has been proposed to be a likely locus where representations of physical low-level sound properties may be transformed to behaviorally relevant representations (Nelken 2008). Growing evidence from animal models suggests that the responses in PAC depend on rather long time windows of integration that span from seconds to tens of seconds, a time frame that appears too long for processing of simple acoustic features (Chait et al. 2007). According to that, in the human early auditory cortex frequency specific short-term memory has been demonstrated (Linke et al. 2011). These findings provide a crucial prerequisite for melodic representations in the auditory cortex, as any mechanism for relative pitch extraction, by nature, has to rely on the temporal integration of at least 2 pitches.
Taken together, even though potentially influenced by input from higher-level areas, our results extend common hierarchical models of pitch sequence processing that attribute the extraction of relative pitch exclusively to higher-levels areas along the auditory neuraxis (Zatorre et al. 1994; Schiavetto et al. 1999; Patterson et al. 2002). We do not know whether relative pitch information in the early auditory cortex is of implicit quality, that is, read out by higher cognitive areas to give rise to the percept of melodic “Gestalt”, similar to the way that periodicity information in the cochlear nucleus is assumed to be read out by higher areas to give rise to the percept of pitch. Nevertheless, the present study provided for the first time direct evidence that relative pitch information, corresponding to the concept of melodic “Gestalt”, is represented at the level of the early auditory cortex.
Supplementary Material
Supplementary material can be found at: http://www.cercor.oxfordjournals.org/.
Funding
This work was supported by the Swiss National Science Foundation and the “Schweizerische Stiftung für medizinisch-biologische Stipendien” (grant PASMP3-123222, M. H.), and the Max-Planck-Society. Funding to pay the Open Access publication charges for this article was provided by the Centre for Integrative Neuroscience, University of Tübingen, Germany.
Supplementary Material
Notes
Conflict of Interest: None declared.
References
- Barker D, Plack CJ, Hall DA. Reexamining the evidence for a pitch-sensitive region: A human fMRI study using iterated ripple noise. Cereb Cortex. 2012;22:745–753. doi: 10.1093/cercor/bhr065. [DOI] [PubMed] [Google Scholar]
- Bartels A, Logothetis NK, Moutoussis K. fMRI and its interpretations: An illustration on directional selectivity in area V5/MT. Trends Neurosci. 2008;31:444–453. doi: 10.1016/j.tins.2008.06.004. [DOI] [PubMed] [Google Scholar]
- Brown S, Martinez MJ, Parsons LM. Passive music listening spontaneously engages limbic and paralimbic systems. Neuroreport. 2004;15:2033–2037. doi: 10.1097/00001756-200409150-00008. [DOI] [PubMed] [Google Scholar]
- Chait M, Poeppel D, de Cheveigne A, Simon JZ. Processing asymmetry of transitions between order and disorder in human auditory cortex. J Neurosci. 2007;27:5207–5214. doi: 10.1523/JNEUROSCI.0318-07.2007. [DOI] [PMC free article] [PubMed] [Google Scholar]
- De Martino F, Valente G, Staeren Nl, Ashburner J, Goebel R, Formisano E. Combining multivariate voxel selection and support vector machines for mapping and classification of fMRI spatial patterns. NeuroImage. 2008;43:44–58. doi: 10.1016/j.neuroimage.2008.06.037. [DOI] [PubMed] [Google Scholar]
- Ehrenfels C. ‘Ueber Gestaltsqualitaeten. Vierteljahrsschrift für wissenschaftliche Philosophie. 1890;14:249–292. [Google Scholar]
- Fischl B, Sereno MI, Tootell RB, Dale AM. High-resolution intersubject averaging and a coordinate system for the cortical surface. Hum Brain Mapp. 1999;8:272–284. doi: 10.1002/(SICI)1097-0193(1999)8:4<272::AID-HBM10>3.0.CO;2-4. [DOI] [PMC free article] [PubMed] [Google Scholar]
- Formisano E, De Martino F, Bonte M, Goebel R. “Who” is saying “what”? Brain-based decoding of human voice and speech. Science. 2008;322:970–973. doi: 10.1126/science.1164318. [DOI] [PubMed] [Google Scholar]
- Foster NE, Zatorre RJ. A role for the intraparietal sulcus in transforming musical pitch information. Cereb Cortex. 2010;20:1350–1359. doi: 10.1093/cercor/bhp199. [DOI] [PubMed] [Google Scholar]
- Griffiths TD, Buchel C, Frackowiak RS, Patterson RD. Analysis of temporal structure in sound by the human brain. Nat Neurosci. 1998;1:422–427. doi: 10.1038/1637. [DOI] [PubMed] [Google Scholar]
- Griffiths TD, Warren JD. The planum temporale as a computational hub. Trends Neurosci. 2002;25:348–353. doi: 10.1016/s0166-2236(02)02191-4. [DOI] [PubMed] [Google Scholar]
- Griffiths TD, Warren JD. What is an auditory object? Nat Rev Neurosci. 2004;5:887–892. doi: 10.1038/nrn1538. [DOI] [PubMed] [Google Scholar]
- Hall DA, Barrett DJ, Akeroyd MA, Summerfield AQ. Cortical representations of temporal structure in sound. J Neurophysiol. 2005;94:3181–3191. doi: 10.1152/jn.00271.2005. [DOI] [PubMed] [Google Scholar]
- Hall DA, Plack CJ. Pitch processing sites in the human auditory brain. 2009;19:576–585. doi: 10.1093/cercor/bhn108. [DOI] [PMC free article] [PubMed] [Google Scholar]
- Hyde KL, Peretz I, Zatorre RJ. Evidence for the role of the right auditory cortex in fine pitch resolution. Neuropsychologia. 2008;46:632–639. doi: 10.1016/j.neuropsychologia.2007.09.004. [DOI] [PubMed] [Google Scholar]
- Lee Y-S, Janata P, Frost C, Hanke M, Granger R. Investigation of melodic contour processing in the brain using multivariate pattern-based fMRI. NeuroImage. 2011;57:293–300. doi: 10.1016/j.neuroimage.2011.02.006. [DOI] [PubMed] [Google Scholar]
- Liegeois-Chauvel C, Peretz I, Babai M, Laguitton V, Chauvel P. Contribution of different cortical areas in the temporal lobes to music processing. Brain J Neurol. 1998;121(Pt 10):1853–1867. doi: 10.1093/brain/121.10.1853. [DOI] [PubMed] [Google Scholar]
- Linke AC, Vicente-Grabovetsky A, Cusack R. Stimulus-specific suppression preserves information in auditory short-term memory. Proc Natl Acad Sci USA. 2011;108:12961–12966. doi: 10.1073/pnas.1102118108. [DOI] [PMC free article] [PubMed] [Google Scholar]
- Morosan P, Rademacher J, Schleicher A, Amunts K, Schormann T, Zilles K. Human primary auditory cortex: Cytoarchitectonic subdivisions and mapping into a spatial reference system. NeuroImage. 2001;13:684–701. doi: 10.1006/nimg.2000.0715. [DOI] [PubMed] [Google Scholar]
- Nelken I. Processing of complex stimuli and natural scenes in the auditory cortex. Curr Opin Neurobiol. 2004;14:474–480. doi: 10.1016/j.conb.2004.06.005. [DOI] [PubMed] [Google Scholar]
- Nelken I. Processing of complex sounds in the auditory system. Curr Opin Neurobiol. 2008;18:413–417. doi: 10.1016/j.conb.2008.08.014. [DOI] [PubMed] [Google Scholar]
- Patterson RD, Uppenkamp S, Johnsrude IS, Griffiths TD. The processing of temporal pitch and melody information in auditory cortex. Neuron. 2002;36:767–776. doi: 10.1016/s0896-6273(02)01060-7. [DOI] [PubMed] [Google Scholar]
- Peretz I. Processing of local and global musical information by unilateral brain-damaged patients. Brain. 1990;113(Pt 4):1185–1205. doi: 10.1093/brain/113.4.1185. [DOI] [PubMed] [Google Scholar]
- Peretz I, Kolinsky R, Tramo M, Labrecque R, Hublet C, Demeurisse G, Belleville S. Functional dissociations following bilateral lesions of auditory cortex. Brain. 1994;117(Pt 6):1283–1301. doi: 10.1093/brain/117.6.1283. [DOI] [PubMed] [Google Scholar]
- Rauschecker JP, Scott SK. Maps and streams in the auditory cortex: Nonhuman primates illuminate human speech processing. Nat Neurosci. 2009;12:718–724. doi: 10.1038/nn.2331. [DOI] [PMC free article] [PubMed] [Google Scholar]
- Schiavetto A, Cortese F, Alain C. Global and local processing of musical sequences: An event-related brain potential study. Neuroreport. 1999;10:2467–2472. doi: 10.1097/00001756-199908200-00006. [DOI] [PubMed] [Google Scholar]
- Seifritz E, Di Salle F, Esposito F, Herdener M, Neuhoff JG, Scheffler K. Enhancing BOLD response in the auditory system by neurophysiologically tuned fMRI sequence. NeuroImage. 2006;29:1013–1022. doi: 10.1016/j.neuroimage.2005.08.029. [DOI] [PubMed] [Google Scholar]
- Serences JT, Boynton GM. Feature-based attentional modulations in the absence of direct visual stimulation. Neuron. 2007;55:301–312. doi: 10.1016/j.neuron.2007.06.015. [DOI] [PubMed] [Google Scholar]
- Seymour K, Clifford CWG, Logothetis NK, Bartels A. The coding of color, motion, and their conjunction in the human visual cortex. Curr Biol. 2009;19:177–183. doi: 10.1016/j.cub.2008.12.050. [DOI] [PubMed] [Google Scholar]
- Staeren Nl, Renvall H, De Martino F, Goebel R, Formisano E. Sound categories are represented as distributed patterns in the human auditory cortex. Curr Biol. 2009;19:498–502. doi: 10.1016/j.cub.2009.01.066. [DOI] [PubMed] [Google Scholar]
- Stewart L, Overath T, Warren JD, Foxton JM, Griffiths TD. fMRI evidence for a cortical hierarchy of pitch pattern processing. PLoS ONE. 2008;3:e1470–e1470. doi: 10.1371/journal.pone.0001470. [DOI] [PMC free article] [PubMed] [Google Scholar]
- Stewart L, von Kriegstein K, Warren JD, Griffiths TD. Music and the brain: Disorders of musical listening. Brain J Neurol. 2006;129:2533–2553. doi: 10.1093/brain/awl171. [DOI] [PubMed] [Google Scholar]
- Williams MA, Baker CI, Op de Beeck HP, Shim WM, Dang S, Triantafyllou C, Kanwisher N. Feedback of visual object information to foveal retinotopic cortex. Nat Neurosci. 2008;11:1439–1445. doi: 10.1038/nn.2218. [DOI] [PMC free article] [PubMed] [Google Scholar]
- Zatorre RJ, Belin P. Spectral and temporal processing in human auditory cortex. Cereb Cortex. 2001;11:946–953. doi: 10.1093/cercor/11.10.946. [DOI] [PubMed] [Google Scholar]
- Zatorre RJ, Belin P, Penhune VB. Structure and function of auditory cortex: Music and speech. Trends Cogn Sci. 2002;6:37–46. doi: 10.1016/s1364-6613(00)01816-7. [DOI] [PubMed] [Google Scholar]
- Zatorre RJ, Evans AC, Meyer E. Neural mechanisms underlying melodic perception and memory for pitch. J Neurosci. 1994;14:1908–1919. doi: 10.1523/JNEUROSCI.14-04-01908.1994. [DOI] [PMC free article] [PubMed] [Google Scholar]
Associated Data
This section collects any data citations, data availability statements, or supplementary materials included in this article.