Abstract
Background
The original 20-item Upper Extremity Functional Index (UEFI) has not undergone Rasch validation.
Objective
The purpose of this study was to determine whether Rasch analysis supports the UEFI as a measure of a single construct (ie, upper extremity function) and whether a Rasch-validated UEFI has adequate reproducibility for individual-level patient evaluation.
Design
This was a secondary analysis of data from a repeated-measures study designed to evaluate the measurement properties of the UEFI over a 3-week period.
Methods
Patients (n=239) with musculoskeletal upper extremity disorders were recruited from 17 physical therapy clinics across 4 Canadian provinces. Rasch analysis of the UEFI measurement properties was performed. If the UEFI did not fit the Rasch model, misfitting patients were deleted, items with poor response structure were corrected, and misfitting items and redundant items were deleted. The impact of differential item functioning on the ability estimate of patients was investigated.
Results
A 15-item modified UEFI was derived to achieve fit to the Rasch model where the total score was supported as a measure of upper extremity function only. The resultant UEFI-15 interval-level scale (0–100, worst to best state) demonstrated excellent internal consistency (person separation index=0.94) and test-retest reliability (intraclass correlation coefficient [2,1]=.95). The minimal detectable change at the 90% confidence interval was 8.1.
Limitations
Patients who were ambidextrous or bilaterally affected were excluded to allow for the analysis of differential item functioning due to limb involvement and arm dominance.
Conclusion
Rasch analysis did not support the validity of the 20-item UEFI. However, the UEFI-15 was a valid and reliable interval-level measure of a single dimension: upper extremity function. Rasch analysis supports using the UEFI-15 in physical therapist practice to quantify upper extremity function in patients with musculoskeletal disorders of the upper extremity.
Musculoskeletal upper extremity disorders are clinically important conditions.1 In 2006, their prevalence was published for several countries, including Australia, Canada, Great Britain, Italy, and the United States, with 12-month and point prevalence values as high as 41% and 53%, respectively.2 Consistent with these findings, musculoskeletal upper extremity disorders impose a large financial burden on society due to lost wages and the cost incurred for therapy. Most often, these conditions present as numbness or tingling, pain, or functional impairment.3
There is no gold standard for the assessment of upper extremity function in patients with these disorders. Assessment of patients' upper extremity function using standardized patient-reported outcome measures (PROMs) is supported by numerous research studies and is mainstream in physical therapist practice. Currently, there are several PROMs of upper extremity function. Most of these measures are site-specific for the shoulder,4–6 elbow,7 wrist,8 or hand.9 We identified 6 PROMs used to evaluate the functional status of the entire upper extremity region of a patient: the Disabilities of the Arm, Shoulder and Hand (DASH)10 and its shortened version the 11-item QuickDASH,11 the Upper Extremity Functional Scale (UEFS),12 the Upper Extremity Functional Limitation Scale (UEFL),13 the Upper Limb Functional Index (ULFI),14 and the Upper Extremity Functional Index (UEFI).15 We found no published review on the region-specific measures for upper extremity function. However, Gabel et al14 pointed out several deficiencies in the upper extremity PROMs. These region-specific PROMs all incorporate questions covering other concepts such as pain or quality of life in addition to upper extremity function.
Stratford et al15 developed the 20-item UEFI as a PROM for assessing upper extremity function in patients with musculoskeletal upper extremity disorders. The UEFI has demonstrated acceptable convergent, discriminant, and longitudinal validity; test-retest reliability; and sensitivity to change using classical test theory methods.15–17 There has been limited availability of the initial published work on the UEFI, which might explain why it is not more frequently cited in the peer-reviewed literature since its development in 2001. However, Kolmus et al18 used the UEFI as the primary outcome in a randomized controlled trial, and Hefford et al16 and Razmjou et al17 used the UEFI as a reference standard in validation studies. Lehman et al19 compared the ability of the DASH and the UEFI to measure clinical change and found neither measure to be better than the other. Other studies that applied Rasch analysis to the DASH and the QuickDASH have brought into question their validity.20,21 Until now, the UEFI has not been evaluated using Rasch analysis,22 an emerging gold standard for evaluating the internal construct validity of PROMs.23–25
Rasch analysis is a modern analytic technique for assessing the validity and reliability of PROMs. Within the last 2 decades, its use has drastically increased as a preferred method in the development, assessment, and refinement of PROMs.23,25 In Rasch analysis, observed response patterns are tested against what is expected by the Rasch measurement model.26 This model posits that for a questionnaire with a unidimensional trait (eg, the questionnaire measures only upper extremity function), patients with more of the attribute should have a greater probability of affirming item response categories that capture more of that attribute.26 Affirming an item involves the decision to select 1 of 2 adjacent response categories. For polytomous items such as those in the UEFI, this decision is conceptualized as ordered transition points between response categories. Transition points have a threshold, which specifies an equal probability of affirming either adjacent category. Each threshold is separated by a distance measured on a logit scale. Using the Rasch model offers advantages over traditional psychometric approaches. First, it estimates the ability of patients and the difficulty of items independently of each other, a measurement property called “specific objectivity” that is unique to the Rasch model. Second, it provides a method for converting ordinal response scales to an interval-level scale.24
The objectives of this study were: (1) to determine whether Rasch analysis supports the UEFI as a valid interval-level measure of only upper extremity function and no other constructs and (2) to determine whether a Rasch-validated UEFI has adequate reproducibility for individual patient evaluation.
Method
Design
Using a repeated-measures study design, patients undergoing physical therapy for a musculoskeletal upper extremity disorder were recruited and followed at 1 of 17 clinics in 4 Canadian provinces between October 2007 and March 2010. Patients were eligible for the study if they were seen for physical therapy treatment and, in the opinion of the treating physical therapist, the upper extremity dysfunction was musculoskeletal in origin. Patients were excluded if they were unable to read or speak English fluently. Practicing physical therapists collected data on 3 occasions: initial assessment (time 1), 24 to 48 hours later when no change was expected (time 2), and following 3 weeks of physical therapy treatment or at discharge, whichever came first (time 3). All participants gave written informed consent before data collection began.
Participants
A total of 298 patients (aged 14–83 years) qualified to participate in the primary study. We considered 23 patients with ambidextrosity, bilateral symptoms, or missing data for these variables as ineligible for Rasch analysis because their small group size would generate imprecise estimates when evaluating item bias due to limb dominance or limb involvement. From the remaining 275 participants, we excluded 36 patients who had an incomplete UEFI. The final sample of 239 patients (ie, our Rasch sample) was sufficient for robust and precise estimation of item parameters within ±0.5 logits with 99% confidence.27
Outcome Measures
Descriptive data included age, sex, education, limb dominance, affected limb, location of symptoms, duration of symptoms, surgery status (did or did not have surgery leading to physical therapy treatment), and impact on work (work not affected, work affected but continuing to work, off work because of problems). Patients completed the UEFI,15 the UEFS,12 and 2 numeric pain rating scales: the pain limitation scale and the pain intensity scale.28
The UEFI consists of 20 items; each has a 5-point scale (0–4, extreme difficulty/unable to perform activity to no difficulty) that captures a patient's rating of difficulty when performing specific activities. Summing the items gives total scores that vary from 0 to 80 (worst to best functional status). In 2007, the UEFI developer acted on feedback from clinicians to change the original wording of 2 items (Paul W. Stratford, 2007, personal communication). Because most patients do not normally lift their groceries in the manner described in item D (“Lifting a bag of groceries above your head”), it was changed to “Placing an object onto, or removing it from, an overhead shelf.” Item E was changed from “Grooming your hair” to “Washing your hair or scalp” because patients could have age-related hair loss or hair loss associated with aggressive medical therapies such as chemotherapy. This study evaluated the updated version of the 20-item UEFI.
Data Analysis
Descriptive statistics.
Descriptive statistics summarized baseline characteristics of the Rasch sample (n=239), the group of patients who subsequently fitted the Rasch model, and the group of patients who were not entered into the Rasch sample because of incomplete UEFI data. To evaluate the generalizability of the Rasch sample (n=239), one-sample tests (sign, t, and chi-square tests, as appropriate) were used to compare the baseline characteristics of this sample with the summary statistics obtained from the total eligible sample (N=275). One-sample tests also were used to compare the baseline characteristics of the patients in the Rasch sample who subsequently fit the Rasch model (n=212) with the summary statistics obtained from the total eligible sample. In addition, independent group comparisons were used to compare the baseline characteristics of the fitting sample (n=212) and patients not entered into the Rasch sample because of incomplete UEFI data (n=36).
Rasch analysis criteria.
We used Tennant and Conaghan's29 criteria for evaluating data fit to the Rasch model. Briefly, these criteria are: selecting the appropriate version of the Rasch model, evaluating the data summary fit, evaluating appropriateness of ordering of each item's response categories, individual person and item fit, item local independence, formally assessing unidimensionality (that is, whether the questionnaire has only one primary latent trait), evaluating internal consistency, and assessing targeting. Statistical significance was tested at P<.05 (with Bonferroni adjustment for the number of items in the run where appropriate). Rasch analysis was conducted using RUMM2030 software (RUMM Laboratories, Perth, Australia).30
Rasch model selection.
Four class intervals, defined by quartiles of the overall patient ability distribution, were used during the test-of-fit analyses. Polytomous items are evaluated with 1 of 2 different Rasch models. The rating scale model31 specifies that thresholds are equidistant across items, whereas the partial credit model32 allows the distance between threshold estimates to vary across items. The partial credit model was supported as appropriate if the Fisher likelihood ratio test was statistically significant.
Summary fit.
Next, the overall fit of the data to the Rasch model was investigated with 3 summary statistics: the item-trait interaction (overall) chi-square value and the mean person-fit and item-fit residual values. A significant overall chi-square value indicated substantial disparity between the obtained and expected data structure of the UEFI. Residuals are the z score standardized person-item differences between the obtained and expected data of each patient. Adequate fit to the model was achieved if the mean item-fit and person-fit residual values were not above 1.5 and approximated a normal distribution as demonstrated by a mean of approximately 0 and a standard deviation of approximately 1.29 If the data did not fit the Rasch Model, we performed planned modifications and reanalyzed the data in subsequent runs in the order described below. Briefly, our planned modifications included deletion of misfitting persons, rescoring of an item's response categories when it had disordered thresholds, deletion of each misfitting item on a one-by-one basis starting with the most misfitting item, and deletion of 1 item when a pair of items lacked local independence.
Individual person fit.
Patients with person residual values outside ±2.5 (ie, a 99% confidence level [CI]) were defined as misfitting patients. The data of all misfitting patients were excluded from the analysis to prevent incorrectly invalidating the UEFI scale.26
Ordering of item response categories.
To obtain an accurate estimate of a patient's ability level, the Rasch model expects each response category of an item to represent a different ability level. The response categories in each item work as expected when each response category has the highest probability of being selected by patients in a logical order along the continuum of the trait that is collectively being captured by the questionnaire items. Ordering of each item's response categories was assessed by inspecting the threshold order in the category probability curve output and threshold map output of each item. The proper order of thresholds parallels the response categories of the item (eg, thresholds 1-2-3-4 should parallel response categories 0-1-2-3-4). Disordered thresholds indicated misfit of an item. Misfit was corrected by combining adjacent categories using clinical judgment to guide these decisions.
Individual item fit.
Misfitting items were defined by fit residual values outside ±2.5 and significant chi-square statistics. They were deleted one at a time in separate runs, starting with the most misfitting item (highest significant chi-square value or highest residual value above +2.5). Each time, the data fit was reassessed before any subsequent modification of the questionnaire.
Item local independence.
This property is an important component of Rasch analysis, which helps to ensure that a scale provides interval-level measurement. Items were expected to have no important associations outside of the primary trait (upper extremity function) captured by the questionnaire.33 Local independence was confirmed if the residual correlation between pairs of items was less than +0.3.
Differential item functioning.
The Rasch model expects that individual items provide a similar score estimate for patients with the same overall ability, regardless of which clinically relevant patient characteristic they have (eg, male versus female). Differential item functioning (DIF) is a form of item bias that occurs when this expectation is not met.34 Support for the UEFI measuring only upper extremity function in an interval level manner may be violated when DIF is present. Each item was examined for DIF across the factors of 3 clinically relevant patient characteristics: sex (ie, male/female), whether surgery preceded physical therapy treatment (ie, yes/no), and whether the dominant limb was the affected limb (ie, yes/no) by performing separate 2-way analysis of variance (ANOVA) calculations. In each 2-way ANOVA, the overall patient ability was divided into 4 class intervals, and each patient characteristic served as the 2 independent variables. The dependent variable was the item mean score obtained for each of the 4 class intervals.
Statistical significance was indicative of 1 of 2 forms of DIF: uniform (a main effect by a patient characteristic across the 4 class intervals) and nonuniform (statistical interaction of a patient characteristic and class intervals). When DIF occurred, if there was appropriate summary fit to the model, 2 ability logit estimates were generated for each patient: 1 from the DIF item set that included all the fitting items and the other from a pure item set that did not include DIF items. The ability estimates of individual patients were not considered to be affected by DIF if less than 5% of patients had a difference of ≥0.5 logits.35
Unidimensionality.
This property represents formal support that a questionnaire has only one primary latent trait, which adequately accounts for the non-random variance in the data. In the UEFI, that trait was upper extremity function. Smith's method36 was used to evaluate the dimensionality of the Rasch-refined UEFI. Each patient had their ability estimates generated for two exclusive sets of items, by performing principal component analysis of the residuals of the items. Those items with negative loading on the first principal component formed one set while those with positive loading formed the other set. The 2 ability estimates that were generated for each patient were then compared using an independent t test. Unidimensionality was confirmed when less than 5% of patients had significant t-test scores, as estimated by the lower bound of the binomial 95% CI.
Internal consistency.
This property was assessed using the person separation index (PSI), which is conceptually equivalent to the Cronbach alpha. The PSI gives a practical indication of how well study participants spread out along the measurement construct as defined by the items. A higher value indicates more reliable estimates of each patient's ability and each item's difficulty. A PSI value >0.85 was considered to be the minimum acceptable reliability for individual-level patient evaluation.29
Targeting.
This property deals with the spread of the patients' ability estimates along the scale relative to the items' difficulty estimates. After a Rasch-refined version of the UEFI was determined, this scale's targeting of the sample was evaluated. If the difficulty thresholds of the items were adequately spread to capture the ability of all patients, the scale's targeting of the sample was judged as adequate. A floor or ceiling effect was present if >15% of the study participants reported a total score that was the minimum or maximum value of the scale, respectively.37
Item stability and reproducibility.
The Rasch-refined UEFI was assessed for summary fit at time 2 and time 3, followed by an assessment of hierarchical stability of the items over time. Using the fitting patients, item stability was evaluated with a 2-way ANOVA to detect DIF by assessment time point. This analysis was facilitated by “stacking” data from pairs of assessment points to create 2 separate datasets: (1) time 1 combined with time 2 and (2) time 1 combined with time 3.
Total scores were converted from ordinal to interval-level values using the following formula:
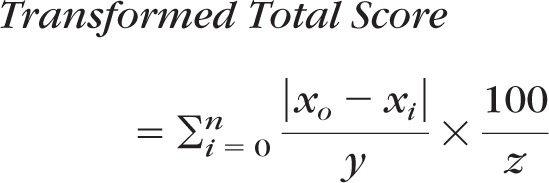 |
where n is the range of the ordinal scale, x0 is the logit score at an ordinal score of zero, xi is the logit score for each ordinal total score, y is the smallest logit change represented by a 1-unit change in the ordinal score, z is the largest |x0−xi|/y value where xi is the maximum ordinal-level total score, and 100 is the transformation constant.
Using the transformed interval-level total scores, reproducibility of the Rasch-refined UEFI was evaluated by quantifying the test-retest reliability across time 1 and time 2 using the intraclass correlation coefficient (ICC) 2-way random effects model ICCagreement (2,1), the standard error of measurement (SEM), and the minimal detectable change at the 90% CI (MDC90).37 Calculation of the SEM CIs followed the method of Stratford and Goldsmith.38
Results
Fit to Rasch Model
Table 1 presents the baseline characteristics of the full sample of patients used during Rasch analysis (n=239), the patients who subsequently fitted the Rasch model (n=212), and the group of patients with incomplete UEFI data who were not entered into the Rasch analysis (n=36). One-sample test results confirmed that excluding 36 patients with incomplete UEFI data did not significantly change the characteristics of the sample used in the Rasch analysis. In addition, independent group comparisons revealed the patients with incomplete UEFI data reported significantly worse pain limitation scores compared with those in the fitting patients sample.
Table 1.
Baseline Characteristics of the Rasch Analysis for the Full Sample, Subsequent Fitting Patients, and Patients Excluded for Incomplete Upper Extremity Functional Index (UEFI) Data
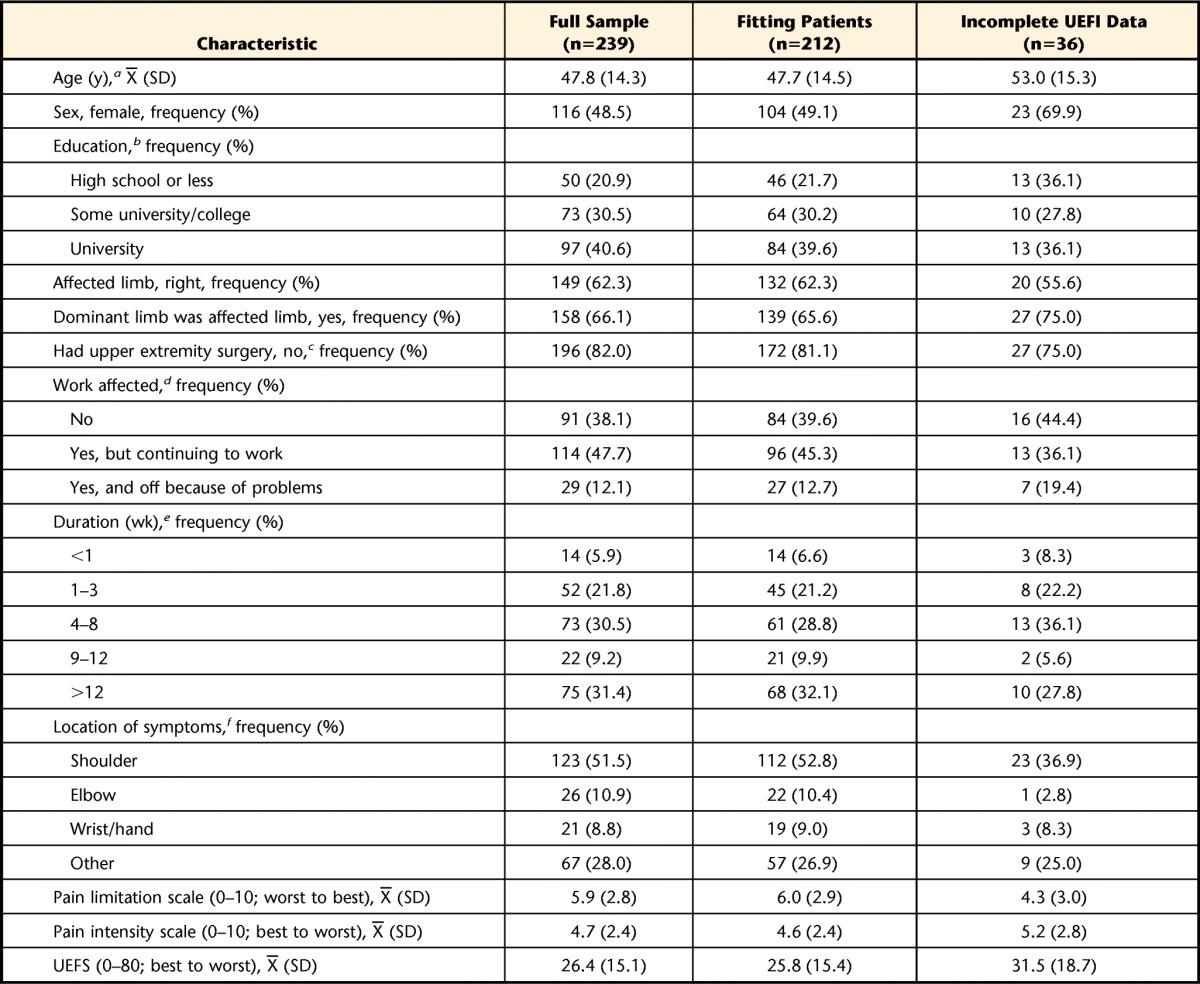
Number of missing values (full sample, fitting patients, excluded for incomplete UEFI data): a (7, 6, 2), b (19, 18, 0), c (3, 3, 0), d (5, 5, 0), e (8, 8, 0), f (2, 2, 0).
A significant Fisher likelihood ratio test (χ2=162.37, df=56, P<.00001) demonstrated the data should be tested against the expectations of the partial credit model. The initial run showed the UEFI data did not fit the Rasch model (χ2=214.93, df=60, P<.00001). As presented in Table 2, a total of 14 runs were performed to achieve fit to the Rasch model and correct for any measurement inadequacies in the UEFI for measuring only upper extremity function. To correct the disparity between the data and the Rasch model, 19 misfitting patients from the initial run were deleted. Additional misfitting patients were deleted as they appeared in subsequent runs. A total of 27 patients (11%) were removed from the analysis. One-sample comparisons revealed no differences (P<.05) between the fitting patients (n=212) and full Rasch sample (n=239) and the total eligible sample (N=275) (Tab. 1). Three items (K [“Doing up buttons”], O [“Tying and lacing shoes”], and S [“Throwing a ball”]) had disordered thresholds and were rescored from 5 to 4 numeric response categories (Tab. 2). Subsequently, 3 items were a misfit. These misfitting items were deleted during separate runs starting with the most misfitting item: P (“Sleeping”) (χ2=40.953, df=3, P<.00001; fit residual=7.668), then item B (“Usual hobbies, recreational or sporting activities”) (χ2=41.321, df=3, P<.00001; fit residual=3.856), and then item S (“Throwing a ball”) (χ2=70.560, df=3, P<.00001; fit residual value=4.392). Then item J (“Dressing”) (χ2=5.181, df=3, P=.159; fit residual=3.514) emerged as having misfit and was deleted.
Table 2.
Rasch Analysis Summary Fit Statisticsa
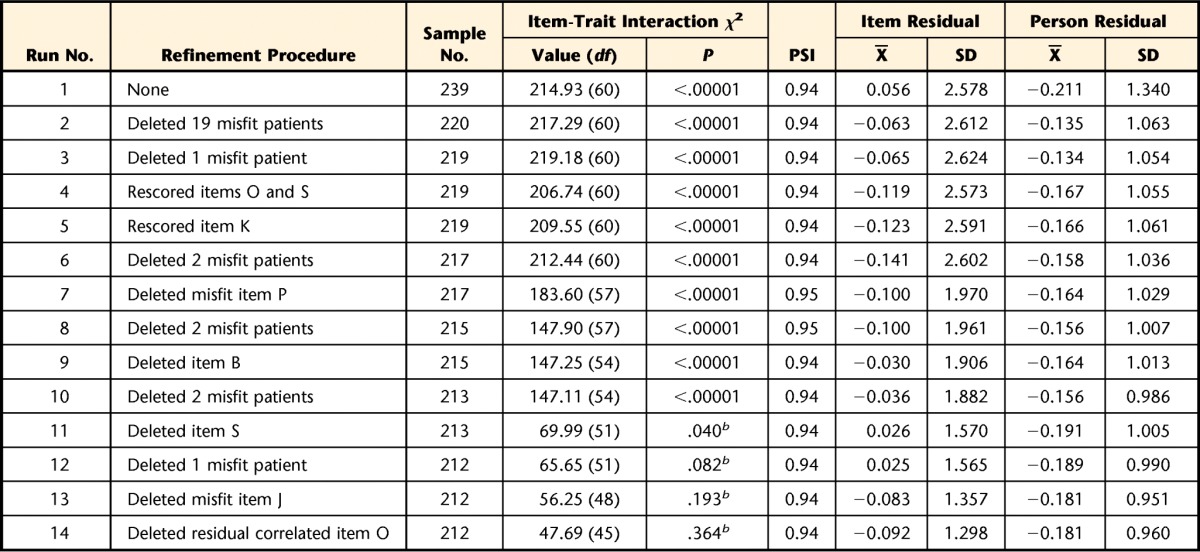
Criteria for data fit to Rasch model: PSI (person separation index) >0.85, χ2 P value >.05 (Bonferroni adjusted), item- and person-fit residual X̅∼ 0 and SD∼1.
b Not significant after Bonferroni correction
At this point, 16 items remained. Items K (“Doing up buttons”) and O (“Tying and lacing shoes”) lacked local independence, as demonstrated by a residual correlation of .425. Both items capture fine motor function and had similar fit statistics. This local dependency was resolved by deleting item O (χ2=5.867, df=3, P=.118; fit residual=−1.306), which was considered to be the less common activity. Table 3 presents a description of the 15 UEFI items that fit the Rasch model, including item K, which was the only retained item with a rescored response structure (response format of 0-1-1-2-3). At this point, the data met the Rasch model criteria for summary fit, as demonstrated by a nonsignificant overall chi-square value (χ2=47.69, df=45, P=.364), the item-fit residual value (X=−0.09, SD=1.20), and the person-fit residual value (X=−0.18, SD=0.96).
Table 3.
Individual Item Fit Statistics and Differential Item Functioning (DIF) for Rasch-Refined Upper Extremity Functional Indexa
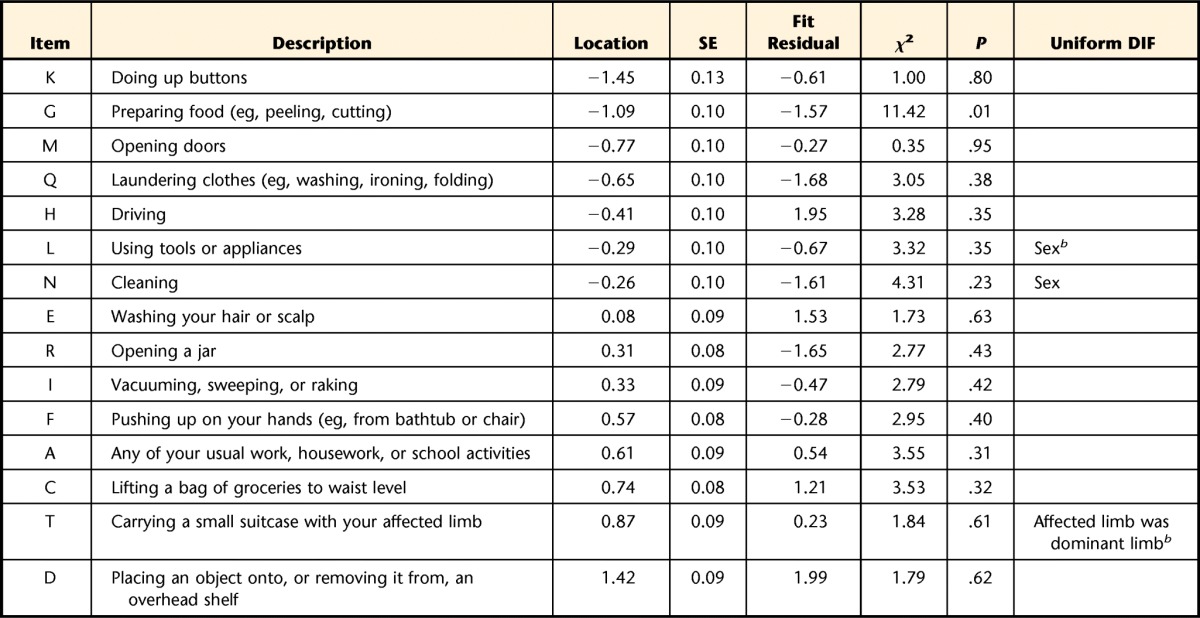
Items are arranged most to least difficult, top to bottom. Items deleted in the following order of most to least misfit: (P) sleeping, (B) usual hobbies/recreational or sporting activities, (S) throwing a ball, (J) dressing, (O) tying or lacing shoes. SE=standard error.
b Significant at P<.05 (Bonferroni adjusted).
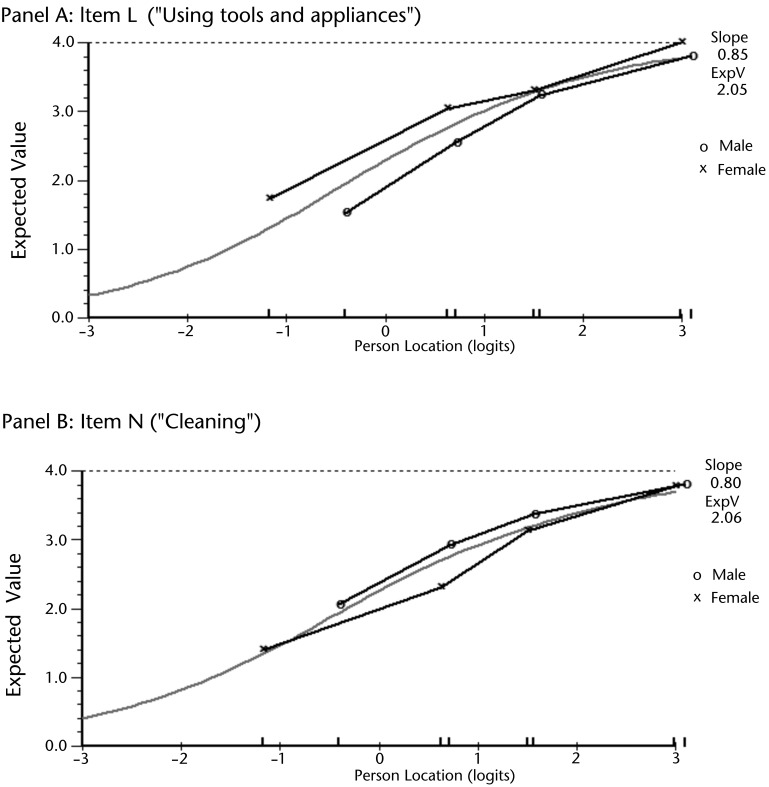
The 2-way ANOVA demonstrated that 3 items had uniform DIF. Item L (“Using tools and appliances”) and item N (“Cleaning”) had DIF by sex, as highlighted in Figure 1. For item L, male patients reported more difficulty than female patients across the levels of overall ability (F=11.850; df=1,201; P<.001). The reverse was found for item N, where female patients reported more difficulty than male patients across the levels of overall ability (F=10.873, df=1,201; P=.001). Item T (“Carrying a small suitcase with their affected limb”) had DIF as determined by whether the dominant limb was the affected limb. For this item, patients whose nondominant limb was affected reported more difficulty across the levels of overall ability (F=11.807, df=1,201; P<.001). All 3 of these items were kept in the refined version of the UEFI after their collective removal did not result in a substantial change of each patient's estimated overall ability. Only 2 patients (1%) had an estimated overall ability that differed by >0.5 logits between the dataset with and without the items in which DIF occurred. Six items had negative loading, and 9 items had positive loading on the first residual principal component. Independent t tests showed 17 patients had a significant t score between these 2 subsets of items, with a lower bound on the CI=4.7%. This finding confirmed unidimensionality for the 15 fitting items (hereafter referred to as UEFI-15).
Figure 1.
Differential item functioning (DIF) of item L (panel A) and item N (panel B) by sex. Panel A shows female patients consistently reported higher scores across 4 levels of overall ability. Panel B shows male patients consistently reported higher scores across 4 levels of overall ability.
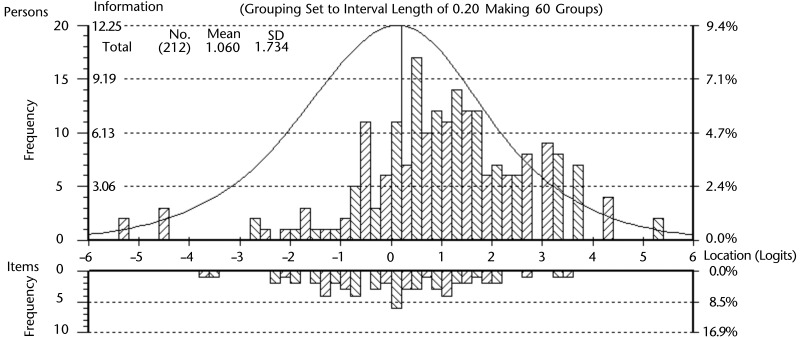
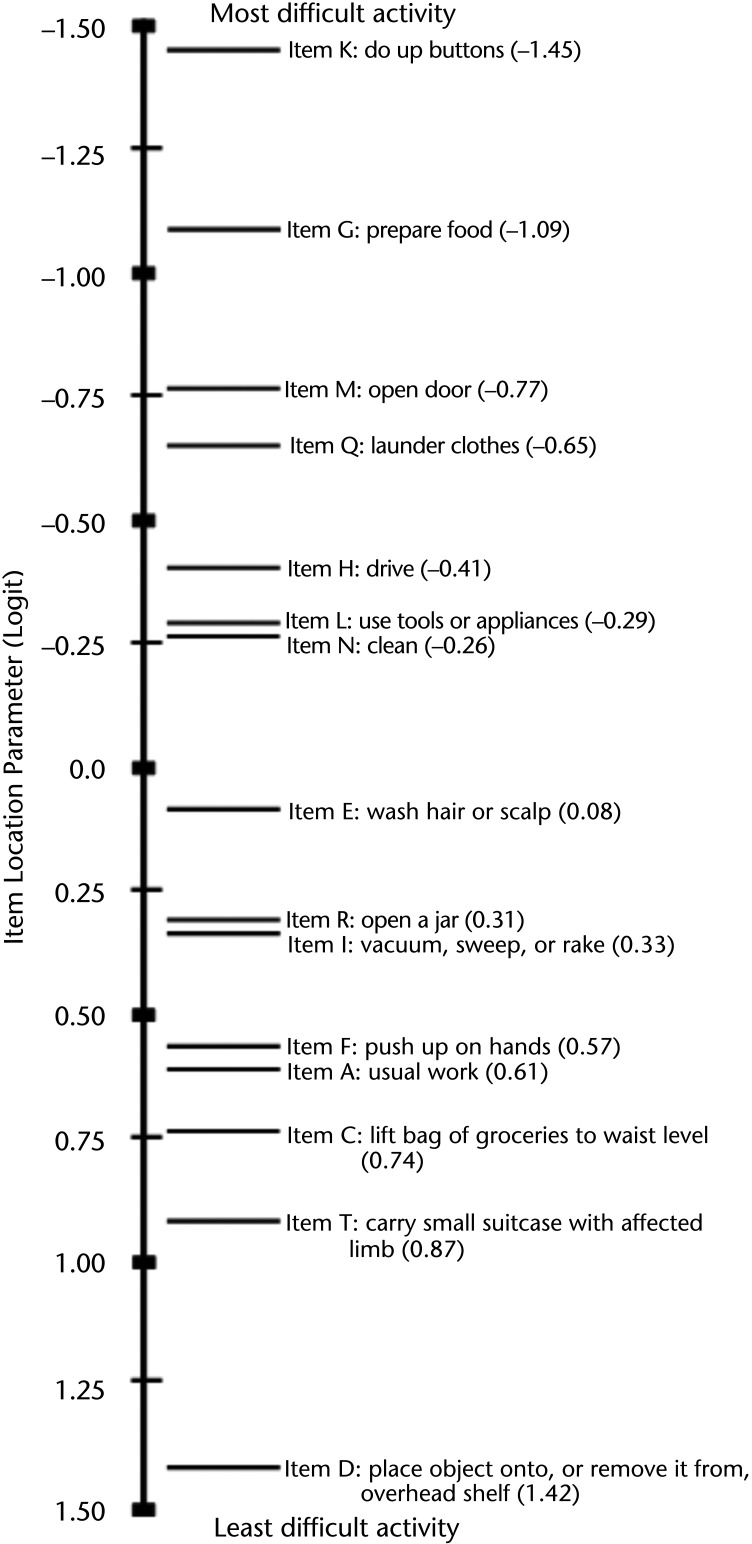
Figure 2 highlights the targeting of the sample, where the distribution of each patient's estimated ability (X=1.06, SD=1.73) was lower, on average, than the mean item threshold difficulty. However, the information function curve of the person-item threshold distribution demonstrated that the 15 items were suitable for accurately estimating each patient's upper extremity function. In addition, Figure 2 highlights the coverage of the UEFI-15 items at the level of their response categories. The data of fitting patients showed no floor or ceiling effect. Internal consistency reliability was demonstrated with a PSI of 0.94. A value of this magnitude indicates that a minimum of 5 levels of ability (upper extremity function status) can be consistently identified by the UEFI-15 (eg, no function, minimal, moderate, good, and excellent).39 Figure 3 illustrates the hierarchical structure of the UEFI-15 items by mapping each item's difficulty estimate in logits onto the interval-level scale of upper extremity function that was collectively captured by the retained 15 items. Qualitatively, the ordering of the resultant 15 items suggests that, in general, the fine motor activities (eg, item K [“Doing up buttons”] and item G [“Preparing food”]) are more difficult tasks than gross motor activities (eg, item T [“Carrying a small suitcase with your affected limb”] and item D [“Place object onto, or remove it from, overhead shelf”]). Quantitatively, the scale in Figure 3 represents the relative magnitude of difficulty for each item on the latent trait of upper extremity function, where 0 logits represents an item of about average difficulty. For example, item K, with a value of −1.45 logits, is a more difficult upper extremity function compared with item G, with a value of −1.09 logits.
Figure 2.
Fitting person-item threshold distribution. The fitting patients estimate distribution is the upper histogram, with increasing to decreasing ability on the x-axis (left to right). The items threshold estimate distribution is the lower histogram, with increasing to decreasing difficulty on the x-axis (left to right).
Figure 3.
The 15-item Upper Extremity Functional Index (UEFI-15) hierarchical structure, depicting the arrangement of the UEFI-15 on an interval-level measure of upper extremity function as captured by the UEFI-15. The scale is in logits. The items are arranged from most to least difficult, top to bottom.
Item Stability and Scale Reliability
Using the fitting patients from the Rasch analysis, the UEFI-15 had an overall fit to the Rasch model at the time 2 and time 3 assessments, with excellent internal consistency reliability (time 2: χ2=64.589, df=45, P=.029, PSI=0.93; time 3: χ2=50.571, df=45, P<.263, PSI=0.91). There was no significant DIF by assessment time point. The UEFI-15 items were stable in their difficulty level through all 3 time points.
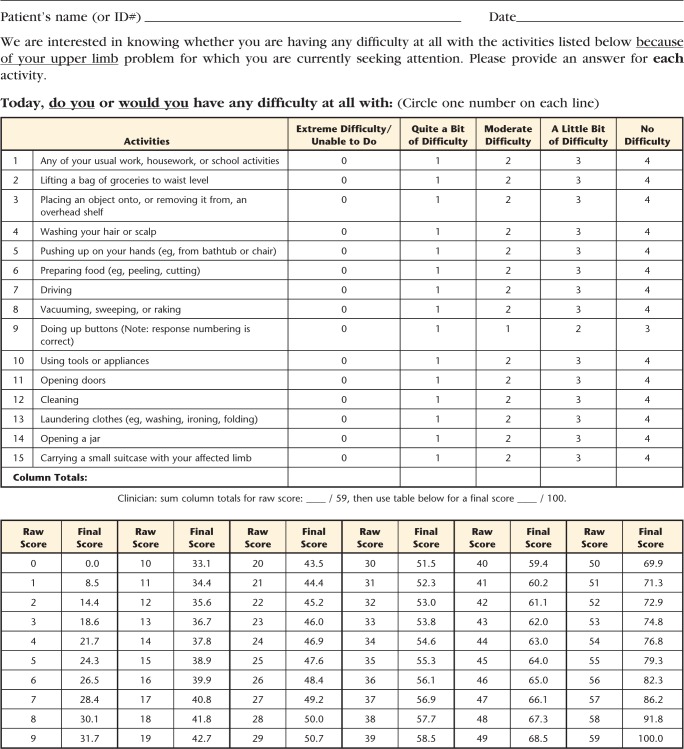
With 14 items that have a 0 to 4 scale and item K (“Doing up buttons”) rescaled to 0 to 3, the raw total score of the UEFI-15 varied from 0 to 59. The Appendix presents the raw ordinal total scores converted to interval-level scores on a 0 to 100 scale (worst to best functional status). A 1-unit change in the ordinal-level total score varied from 0.8 to 8.5 units on the interval-level scale. Using the interval-level total scores, test-retest reliability findings were: ICCagreement (2,1)=.954 (95% CI=0.939, 0.965), SEM=3.5 (95% CI=3.2, 3.9), and MDC90=8.1.
Discussion
When the original UEFI did not meet the Rasch criteria of validity, its refinement was informed by further Rasch analysis, which resulted in the 15-item version. During the current study, priority was placed on the internal validity of the scale, allowing misfitting patients to be deleted so the scale was correctly interpreted as measuring only upper extremity function.26 The similarity between the total eligible sample in this study and the Rasch sample, and the subsequent similarity between the total eligible sample and the patients who fitted the Rasch model, suggests that generalizability of the results was not affected by the removal of misfitting patients. However, the group of patients with incomplete UEFI data had more pain-related limitation with upper extremity activities compared with the sample of fitting patients. This finding could reflect a bias in this study sample that might affect the generalizability of the results. Although the response pattern of each patient is irrelevant for ability estimation, it is essential for determining fit to the Rasch model.40 A patient misfitted the Rasch model when his or her observed response to the UEFI items was significantly different from that expected by the Rasch model, as detected by a large magnitude of their standardized difference (residual).40 This disparity could have been due to a number of reasons, including incorrect recall, error when completing the questionnaire, some patients may differ from the rest of the sample in important ways not measured in this study, or a patient erred in his or her interpretation of some of the items. A subsequent qualitative or mixed-methods study could look into the patient's interpretation of each UEFI item using cognitive interviewing.
Five items (P, B, J, S, and O) were deleted from the UEFI. We believe this deletion was justified because it eliminated ambiguity and created a more unified questionnaire for assessing only upper extremity function. For example, item P (“Sleeping”) and item B (“Usual hobbies, recreational or sporting activities”) may have misfit the model because they measure broader constructs than are definitive of upper extremity function. Our decision to remove item P is supported by Franchignoni and colleagues'21 Rasch analysis of the QuickDASH, which had similar implications for the DASH. As in the current study, they also found the item “Difficulty with sleep” misfit the Rasch model, necessitating its removal to avoid violating the assumption of unidimensionality. Furthermore, item J (“Dressing”) may have misfit the model because in addition to the upper extremities it also involves the trunk and lower extremities. Its association with function in multiple parts of the body may be one reason it did not fit with the primary trait of the UEFI.
Item S (“Throwing a ball”) may have misfit the model because some patients rated underhand throwing, others rated overhand throwing, or others had not thrown a ball in years. In addition, overhand throwing requires a highly specific combination of limb and trunk movements that may constitute more than upper extremity function, or it may not be a regular activity. Finally, item O (“Tying and lacing shoes”) was deleted because of its residual correlation with item K (“Doing up buttons”) demonstrated that it provided no additional measurement information. This strong relationship may have been present because both items capture fine motor function, which may have caused the responses on 1 item to be too predictive of the score on the other item. Item O was deleted because, with the availability of Velcro (Velcro USA Inc, Manchester, New Hampshire) straps and slip-on footwear, tying and lacing shoes was considered to be a less common activity than doing up buttons, and so would be less valuable in terms of content validity. The deletion of item O might have reduced nonrandom variance in the data, but was a worthwhile compromise to remove redundancy from the scale.
We allowed 3 items with DIF to remain in the UEFI-15 because they did not have a negative impact on the overall person ability estimate of individual patients.35 It was important to retain these items because they capture important components of upper extremity function not covered by the other items, thereby contributing to the content validity of the UEFI-1537 without preventing the measure from being unidimensional. Retaining items with DIF is based on the idea of “cancellation of DIF,” where some items favor 1 group and other items favor another group within the same patient characteristic, thus compensating for the effect of DIF.35 A good example of this idea was the reversed DIF by sex between item L (“Using tools and appliances”) and item N (“Cleaning”). Specifically, male and female patients had different estimates of their difficulty when using item L compared with when using item N. This finding may be an expression of a compensatory effect where the cancellation of DIF allowed the estimated overall ability of patients to be maintained in each sex group. The DIF in item L and item N might have occurred because the group that performs the activity the most consistently reported it as more difficult because they did the activity more frequently.41 Although DIF by sex should not affect repeated measurement on individual patients, clinicians comparing groups of their patients should control for any sex differences.
The shortened length of the Rasch-refined questionnaire should translate to being less burdensome on patients to complete. From a reproducibility perspective, the UEFI-15 demonstrated excellent internal consistency and test-retest reliability. These properties can be interpreted as the UEFI-15 having high consistency when capturing patients' upper extremity functional status across the entire study population. For clinicians, the MDC90 value means that 90% of their patients whose upper extremity functional status is truly stable across 2 measurement occasions will exhibit random variation of ≤8.1 units on the UEFI-15 interval-level scale.42
We recommend using these interval-level scores in clinical practice. Using the UEFI-15 questionnaire form provided in the Appendix, a physical therapist would first calculate the raw total score by simply adding the patient's response to the items. Then, using the conversion table at the bottom of the form (see Appendix), the corresponding interval-level score for each possible raw total score can be obtained as the patient's final score. Thus, clinicians and researchers do not need to do their own calculation of each patient's interval-level score. Also, with the increase in electronic data collection, if a computerized UEFI-15 form were created, it would automatically generate the final interval-level score with a behind-the-scenes algorithm.
The literature supports several benefits of using interval-level scores.43 Difference scores and group means are interpretable because a specific amount of change (eg, 8.1 UEFI-15 units) represents an equivalent magnitude of the underlying trait (ie, upper extremity function), regardless of where on the scale this change takes place. Interval-level scores are considered appropriate for use with parametric statistics. This is not necessarily the case with raw total scores of ordinal-level data from PROMs. For example, a study that performed parametric and nonparametric versions of an analysis on raw total scores of a PROM found conflicting results and differences in the interpretations of the findings.43 The UEFI-15 interval-level scores can be used in future research to combat any criticism of calculating the measure's change score from an ordinal scale.43 Also, we believe the main advantage that the UEFI-15 offers in terms of measurement over the original UEFI and other commonly used PROMs of upper extremity function is its unidimensionality. More specifically, it is the only PROM that does not incorporate any other constructs than upper extremity function (eg, pain) directly into the calculation of a patient's functional ability. Therefore, a patient's UEFI-15 score will be attributable only to his or her rating of upper extremity function.43,44 For clinicians, this means their patient's final score will not be biased because other constructs (such as pain from sleeping on the affected shoulder) are measured by the questionnaire. However, it also must be recognized that other factors, such as pain, could influence upper extremity function and thus indirectly affect the UEFI-15 score.
Study Limitations and Future Research
A limitation of this study may be that patients who were ambidextrous or had bilateral symptoms were excluded. Another limitation may be that the misfitting patients differed from fitting patients in important ways. Furthermore, although the removed items do not fit the construct of upper extremity function only, they may have clinical utility in the target population. Therefore, consideration of their value as single questions should be evaluated. No external anchor was used for the assessment of test-retest reliability. However, the excellent ICCagreement (2,1) of .954 demonstrated a high level of consistency of patient total scores between time 1 and time 2. Future research should be conducted with an independent sample of patients who have completed the UEFI-15 to confirm its reliability and to evaluate its criterion and predictive validity and its responsiveness. A future study could hypothesize key decision-making cutpoints about upper extremity functionality along the scale and evaluate the sensitivity and responsiveness of the scale within those ranges of interval-level scores.
Conclusion
This Rasch analysis does not support the validity of the original 20-item UEFI as an interval-level measure of only upper extremity function. The results do support the UEFI-15 as a valid and reliable interval-level measure of upper extremity function in individual patients with musculoskeletal upper extremity disorders. The stability of item difficulty across 3 time points supports its construct validity for repeated measurements, providing additional support for the use of the UEFI-15 in clinical settings.
Appendix.
Appendix.
Upper Extremity Functional Index-15a
a © 2013 B. Chesworth, P. Stratford, C. Hamilton, reprinted with permission.
Footnotes
Both authors provided concept/idea/research, writing, and data analysis. Dr Chesworth provided data collection, project management, facilities/equipment, institutional liaisons, and consultation (including review of manuscript before submission).
The authors thank Professor Paul Stratford for allowing them to use and modify the original UEFI questionnaire, the study participants, Dr David Walton for feedback on manuscript drafts, and the physical therapists of the UEFI Study Group who collected the data: Melissa Benoit, Tracy Blake, Heather Bredy, Cameron Burns, Lianne Chan, Elizabeth Frey, Graham Gillies, Teresa Gravelle, Rick Ho, Robert Holmes, Alishah (Jamal) Merchant, Roland LJ Lavallée, Melanie MacKinnon, Tammy Sherman, Kelly Spears, and Darryl Yardley.
The Western University Health Sciences Research Ethics Board approved this study.
Podium presentations of some of the material contained in this report were given at Rasch Measurement Conference 2012; January 23–25, 2012; Perth, Australia, and at the Canadian Physical Therapy Association's National Congress; May 24–27, 2012; Saskatchewan, Canada.
Mr Hamilton is supported, in part, by the Joint Motion Program–A Canadian Institutes of Health Research (CIHR) Training Program in Musculoskeletal Health Research and Leadership and by a CIHR Doctoral Research Award.
References
- 1. Kilbom S, Armstrong T, Buckle P, et al. Musculoskeletal disorders: work-related risk factors and prevention. Int J Occup Environ Health. 1996;2:239–246 [DOI] [PubMed] [Google Scholar]
- 2. Huisstede BM, Bierma-Zeinstra SM, Koes BW, Verhaar JA. Incidence and prevalence of upper-extremity musculoskeletal disorders: a systematic appraisal of the literature. BMC Musculoskelet Disord. 2006;7:7. [DOI] [PMC free article] [PubMed] [Google Scholar]
- 3. Buckle PW, Devereux JJ. The nature of work-related neck and upper limb musculoskeletal disorders. Appl Ergon. 2002;33:207–217 [DOI] [PubMed] [Google Scholar]
- 4. Angst F, Schwyzer HK, Aeschlimann A, et al. Measures of adult shoulder function: Disabilities of the Arm, Shoulder and Hand Questionnaire (DASH) and its short version (QuickDASH), Shoulder Pain and Disability Index (SPADI), American Shoulder and Elbow Surgeons (ASES) Society standardized shoulder assessment form, Constant (Murley) Score (CS), Simple Shoulder Test (SST), Oxford Shoulder Score (OSS), Shoulder Disability Questionnaire (SDQ), and Western Ontario Shoulder Instability Index (WOSI). Arthritis Care Res (Hoboken). 2011;63(suppl 11):S174–S188 [DOI] [PubMed] [Google Scholar]
- 5. Bot SD, Terwee CB, van der Windt DA, et al. Clinimetric evaluation of shoulder disability questionnaires: a systematic review of the literature. Ann Rheum Dis. 2004;63:335–341 [DOI] [PMC free article] [PubMed] [Google Scholar]
- 6. Roy JS, MacDermid JC, Woodhouse LJ. Measuring shoulder function: a systematic review of four questionnaires. Arthritis Rheum. 2009;61:623–632 [DOI] [PubMed] [Google Scholar]
- 7. MacDermid JC. Outcome evaluation in patients with elbow pathology: issues in instrument development and evaluation. J Hand Ther. 2001;14:105–114 [DOI] [PubMed] [Google Scholar]
- 8. Hoang-Kim A, Pegreffi F, Moroni A, Ladd A. Measuring wrist and hand function: common scales and checklists. Injury. 2011;42:253–258 [DOI] [PubMed] [Google Scholar]
- 9. van de Ven-Stevens LA, Munneke M, Terwee CB, et al. Clinimetric properties of instruments to assess activities in patients with hand injury: a systematic review of the literature. Arch Phys Med Rehabil. 2009;90:151–169 [DOI] [PubMed] [Google Scholar]
- 10. Hudak PL, Amadio PC, Bombardier C. Development of an upper extremity outcome measure: the DASH (Disabilities of the Arm, Shoulder and Hand) [corrected]; The Upper Extremity Collaborative Group (UECG) [erratum in: Am J Ind Med. 1996;30:372]. Am J Ind Med. 1996;29:602–608 [DOI] [PubMed] [Google Scholar]
- 11. Beaton DE, Wright JG, Katz JN; Upper Extremity Collaborative Group Development of the QuickDASH: comparison of three item-reduction approaches. J Bone Joint Surg Am. 2005;87:1038–1046 [DOI] [PubMed] [Google Scholar]
- 12. Pransky G, Feuerstein M, Himmelstein J, et al. Measuring functional outcomes in work-related upper extremity disorders: development and validation of the Upper Extremity Function Scale. J Occup Environ Med. 1997;39:1195–1202 [DOI] [PubMed] [Google Scholar]
- 13. Simonsick EM, Kasper JD, Guralnik JM, et al. ; WHAS Research Group Severity of upper and lower extremity functional limitation: scale development and validation with self-report and performance-based measures of physical function. Women's Health and Aging Study. J Gerontol B Psychol Sci Soc Sci. 2001;56:S10–S19 [DOI] [PubMed] [Google Scholar]
- 14. Gabel CP, Michener LA, Burkett B, Neller A. The Upper Limb Functional Index: development and determination of reliability, validity, and responsiveness. J Hand Ther. 2006;19:328–348 [DOI] [PubMed] [Google Scholar]
- 15. Stratford PW, Binkley JM, Stratford DM. Development and initial validation of the Upper Extremity Functional Index. Physiother Can. 2001;53:259–267 [Google Scholar]
- 16. Hefford C, Abbott JH, Arnold R, Baxter GD. The Patient-Specific Functional Scale: validity, reliability, and responsiveness in patients with upper extremity musculoskeletal problems. J Orthop Sports Phys Ther. 2012;42:56–65 [DOI] [PubMed] [Google Scholar]
- 17. Razmjou H, Davis AM, Jaglal SB, et al. Cross-sectional analysis of baseline differences of candidates for rotator cuff surgery: a sex and gender perspective. BMC Musculoskelet Disord. 2009;10:26. [DOI] [PMC free article] [PubMed] [Google Scholar]
- 18. Kolmus AM, Holland AE, Byrne MJ, Cleland HJ. The effects of splinting on shoulder function in adult burns. Burns. 2012;5:638–644 [DOI] [PubMed] [Google Scholar]
- 19. Lehman LA, Sindhu BS, Shechtman O, et al. A comparison of the ability of two upper extremity assessments to measure change in function. J Hand Ther. 2010;23:31–39 [DOI] [PubMed] [Google Scholar]
- 20. Cano SJ, Barrett LE, Zajicek JP, Hobart JC. Beyond the reach of traditional analyses: using Rasch to evaluate the DASH in people with multiple sclerosis. Mult Scler. 2011;17:214–222 [DOI] [PubMed] [Google Scholar]
- 21. Franchignoni F, Ferriero G, Giordano A, et al. Psychometric properties of QuickDASH: a classical test theory and Rasch analysis study. Man Ther. 2011;16:177–182 [DOI] [PubMed] [Google Scholar]
- 22. Rasch G. Probabilistic Models for Some Intelligence and Attainment Tests. Chicago, IL: University of Chicago Press; 1960 [Google Scholar]
- 23. Belvedere SL, de Morton NA. Application of Rasch analysis in health care is increasing and is applied for variable reasons in mobility instruments. J Clin Epidemiol. 2010;63:1287–1297 [DOI] [PubMed] [Google Scholar]
- 24. Tennant A, McKenna SP, Hagell P. Application of Rasch analysis in the development and application of quality of life instruments. Value Health. 2004;7(suppl 1):S22–S26 [DOI] [PubMed] [Google Scholar]
- 25. Tesio L, Simone A, Bernardinello M. Rehabilitation and outcome measurement: where is Rasch analysis going? Eura Medicophys. 2007;43:417–426 [PubMed] [Google Scholar]
- 26. Pallant JF, Tennant A. An introduction to the Rasch measurement model: an example using the Hospital Anxiety and Depression Scale (HADS). Br J Clin Psychol. 2007;46(pt 1):1–18 [DOI] [PubMed] [Google Scholar]
- 27. Linacre JM. Sample size and item calibration stability. Rasch Meas Trans.1994;7:328 [Google Scholar]
- 28. Westaway MD, Stratford PW, Binkley JM. The Patient Specific Functional Scale: validation of its use in persons with neck dysfunction. J Orthop Sports Phys Ther. 1998;27:331–338 [DOI] [PubMed] [Google Scholar]
- 29. Tennant A, Conaghan PG. The Rasch measurement model in rheumatology: what is it and why use it, when should it be applied, and what should one look for in a Rasch paper? Arthritis Rheum. 2007;57:1358–1362 [DOI] [PubMed] [Google Scholar]
- 30. Andrich D, Lyne A, Sheridan B, Luo G. RUMM 2030. Perth, Australia: RUMM Laboratories Pty Ltd; 2011 [Google Scholar]
- 31. Andrich D. A rating formulation for orders response categories. Psychometrika. 1978;43:561–573 [Google Scholar]
- 32. Masters GN. A Rasch model for partial credit scoring. Psychometrika. 1982;47:149–174 [Google Scholar]
- 33. Wright BD. Local dependency, correlations and principal components. Rasch Meas Trans. 1996;10:509–511 [Google Scholar]
- 34. Holland PW, Wainer H. Differential Item Functioning. Hillsdale, NJ: Lawrence Erlbaum Associates; 1993 [Google Scholar]
- 35. Tennant A, Pallant JF. Undimensionality matters: a practical approach to test if differential item functioning makes a difference. Rasch Meas Trans. 2006;20:1048–1051 [Google Scholar]
- 36. Smith EV., Jr Detecting and evaluating the impact of multidimensionality using item fit statistics and principal component analysis of residuals. J Appl Meas. 2002;3:205–231 [PubMed] [Google Scholar]
- 37. Terwee CB, Bot SD, de Boer MR, et al. Quality criteria were proposed for measurement properties of health status questionnaires. J Clin Epidemiol. 2007;60:34–42 [DOI] [PubMed] [Google Scholar]
- 38. Stratford PW, Goldsmith CH. Use of the standard error as a reliability index of interest: an applied example using elbow flexor strength data. Phys Ther. 1997;77:745–750 [DOI] [PubMed] [Google Scholar]
- 39. Fisher WP., Jr Reliability, separation, strata statistics. Rasch Meas Trans. 1992:6;238 [Google Scholar]
- 40. Andrich D. Rasch Models for Measurement. Newbury Park, CA: Sage Publications; 1988 [Google Scholar]
- 41. Granger C. Rasch analysis is important to understand and use for measurement. Rasch Meas Trans. 2008;21:1122–1123 [Google Scholar]
- 42. Stratford PW, Riddle DL. When minimal detectable change exceeds a diagnostic test-based threshold change value for an outcome measure: resolving the conflict. Phys Ther. 2012;92:1338–1347 [DOI] [PubMed] [Google Scholar]
- 43. Kahler E, Rogausch A, Brunner E, Himmel W. A parametric analysis of ordinal quality-of-life data can lead to erroneous results. J Clin Epidemiol. 2008;61:475–480 [DOI] [PubMed] [Google Scholar]
- 44. Grimby G, Tennant A, Tesio L. The use of raw scores from ordinal scales: time to end malpractice? J Rehabil Med. 2012;44:97–98 [DOI] [PubMed] [Google Scholar]


