

Abstract
Here we present a novel, end-point method using the dead-end-elimination and A* algorithms to efficiently and accurately calculate the change in free energy, enthalpy, and configurational entropy of binding for ligand–receptor association reactions. We apply the new approach to the binding of a series of human immunodeficiency virus (HIV-1) protease inhibitors to examine the effect ensemble reranking has on relative accuracy as well as to evaluate the role of the absolute and relative ligand configurational entropy losses upon binding in affinity differences for structurally related inhibitors. Our results suggest that most thermodynamic parameters can be estimated using only a small fraction of the full configurational space, and we see significant improvement in relative accuracy when using an ensemble versus single-conformer approach to ligand ranking. We also find that using approximate metrics based on the single-conformation enthalpy differences between the global minimum energy configuration in the bound as well as unbound states also correlates well with experiment. Using a novel, additive entropy expansion based on conditional mutual information, we also analyze the source of ligand configurational entropy loss upon binding in terms of both uncoupled per degree of freedom losses as well as changes in coupling between inhibitor degrees of freedom. We estimate entropic free energy losses of approximately +24 kcal/mol, 12 kcal/mol of which stems from loss of translational and rotational entropy. Coupling effects contribute only a small fraction to the overall entropy change (1–2 kcal/mol) but suggest differences in how inhibitor dihedral angles couple to each other in the bound versus unbound states. The importance of accounting for flexibility in drug optimization and design is also discussed.
1. Introduction
One of the goals of rational, structure-based drug design is to understand the thermodynamics of small-molecule-receptor binding in order to design effective, high-affinity therapeutics. Lead compound development is expensive and requires a great deal of experimental effort to explore the large combinatorial space of chemical functionality. To expedite the process, computational methods are often used to optimize the search and examine the binding thermodynamics of lead compounds. It is difficult, however, to compute accurately both the enthalpy (ΔHbind) and entropy changes (ΔSbind) upon binding and to rank compounds based on a true free energy of binding (ΔG = ΔH – TΔS). Most approaches based on physical force-fields include enthalpic binding contributions and perhaps solvent entropy contributions, but both are estimated from single bound and unbound conformations. The neglect of configurational entropy changes for binding partners is a clear omission in common applications. Nonetheless, such calculations are valuable as they can provide a more accurate and detailed breakdown of the thermodynamic changes. Experimental methods such as isothermal titration calorimetry (ITC)1 can only report on ensemble averaged binding enthalpies and entropies, and they cannot determine the source of the change (e.g., ligand, receptor, or solvent).
Computational approaches, in principle, account for the contributions to the free energy of binding from ligand, receptor, and solvent degrees of freedom. Standard molecular mechanical treatments of ligand binding separate the enthalpic changes into separate terms for internal, van der Waals, Coulombic, and solvation interactions.2,3 Similarly, binding entropies are often decomposed into conformational entropy terms for the ligand, receptor, and solvent, but compared to the enthalpic terms, they are much more time-consuming to calculate. To accurately compute an ensemble free energy or entropy change upon binding, one must fully explore and integrate over the conformational space of the solvent, the ligand, its receptor, and the complex,4 which is a formidable task even for small systems. Given this difficulty, the configurational entropy change is often assumed to be the same for different ligands in a series or is approximated with an empirical term that assumes a constant change in entropy per frozen rotatable bond.5−9 However, these approaches often fail to account for both ligand and receptor topology and lack theoretical support. Chang et al. calculated the change in configurational entropy of the clinically approved inhibitor amprenavir binding to HIV-1 protease (as −TΔS) and found it to oppose binding by ∼25 kcal/mol.10 It is still unknown, however, whether the configurational binding entropy change is similar for different, related protease inhibitors.
Modern computational methods that are used to compute free energies of binding, and their component enthalpies and entropies generally fall into one of two categories, perturbation and end-point methods. The former includes free energy perturbation (FEP)11,12 and thermodynamic integration (TI),13−15 which often rely on molecular dynamics (MD) or Monte Carlo (MC) simulations to perturb a system from one state to another (e.g., wild type to mutant, one ligand to another, or even unbound to bound). The total free energy change can then be computed as a function of the perturbation coordinate. These methods provide a well-defined thermodynamic path between each state but can be slow to converge, as there are significant challenges.16 End-point methods determine free energy changes by calculating absolute free energies of the final and initial states of the system and taking the difference.4 These absolute free energies can also be found via MD or MC simulations and have been successfully used to study ligand binding in a variety of molecular systems.17,18 Recent, alternative formulations make use of the single- or predominant-state approximation, in which a single or multiple low-energy structures are identified, and the local configurational space about each initial structure is sampled.10,19,20 Implicit in these methods is the assumption that high-energy conformations contribute negligibly to the ensemble entropy and enthalpy averages and that the potential energy surface is well described using a single or set of local minima. Further approximations are often made to analytically integrate over local minima using the harmonic or quasiharmonic approximation.17,21,22 The former assumes the potential energy surface about the initial structure can be modeled using a multidimensional harmonic potential, while the latter also assumes that conformational fluctuations are governed by a multivariate Gaussian probability distribution. While these methods are efficient, they are not guaranteed to search all of phase space and exaggerate favorable free energy changes.23
This study seeks to evaluate a number of these assumptions using an ensemble, configurational free energy of binding to accurately rank computationally designed human immunodeficiency virus (HIV-1) protease inhibitors. Previous studies of the examined inhibitors have shown that using a single, low-energy configuration to evaluate each inhibitor can successfully predict binding geometries but often fails to correctly rank inhibitors with binding free energies within 2–3 kcal/mol of each other.24 We sought to improve upon this static, predominantly enthalpic treatment by accounting for ensemble effects of the ligand both in the bound and the unbound state. To this end, we developed a novel, deterministic, end-point method for computing the free energy of binding of ligand–receptor complexes that uniformly searches conformational space and explicitly accounts for both enthalpic and configurational entropic effects. This approach fundamentally differs from the aforementioned methods in that it does not sample from a Boltzmann distribution of configurations to collect an average but instead uses uniform, rotameric enumeration25 of ligand torsional degrees of freedom to map out and explicitly integrate over the potential energy landscape. While normally an intractable problem, searching through this high-dimensional space is enabled through the use of the dead-end elimination (DEE)26−29 and the A* algorithms.30,31 DEE is used to prune high-energy rotamers, which excludes low probability configurations from the search space, while A* is used to rapidly enumerate the accessible configurational states of the structure. Both of these algorithms are global optimizers and, when used in conjunction, are guaranteed to both find the global minimum energy configuration (GMEC) and eliminate all those configurations with energies greater than a user supplied energy cutoff above the GME. Using this method, we were able to generate an energy-ranked, gapless list of low-energy ligand configurations in a computationally tractable amount of time, and evaluate the bound and unbound state partition functions to compute the free energy, enthalpy, and configurational entropy of binding in the context of a rigid receptor.
The configurational entropy changes of all the protease inhibitors explored in this study were further analyzed using a novel, additive entropy expansion. By decomposing the entropy into a series of marginal entropy and mutual information (coupling) terms, we were able to extract the entropic contribution of each degree of freedom as well as the contributions from entropic coupling between pairs, triplets, and higher-order combinations. Similar entropy expansions have been described in the literature to examine the configurational entropies of liquids,32,33 spin frustrated systems,34 as well as biological systems.35,36 However, given the aforementioned difficulty associated with effectively sampling the potential energy landscape of complex biological systems, previous applications to such systems have been limited to approximating the full entropy of the system. These methods assume that only a low-order subset of the entropy terms contribute significantly, as they are unable to accurately evaluate the remaining high-dimensional terms. Additionally, while these approximations have been reasonably successful at describing the larger distribution, the individual terms are often difficult to physically interpret as they contain overlapping entropic contributions that are successively added and removed as the level of approximation improves.35 The expansion used in this study is similar to that used in the MIST expansion,37,38 as well as those presented by Killian et al. and Matsuda.34,35 It is based on the generalized Kirkwood superposition approximation,35,39,40 which approximates a high-order probability distribution using a series of successively lower-order distributions. It differs, however, in that each entropy term in the expansion is conditioned on the remaining degrees of freedom of the system, which aids in the physical interpretation of these terms by separating their contributions into nonoverlapping pieces. Each term describes either the conditional marginal entropy of each degree of freedom or the conditional mutual information (coupling) between sets of degrees of freedom. By appropriately conditioning each term, these conditional couplings are measures of the coupling between degrees of freedom that are not mediated by another degree of freedom of the system, which avoids the layered, compensating additions and subtractions of the same physical effect present in other methods.
Applying this novel, conditional mutual information expansion (CMIE) and DEE/A* enumeration method to a series of protease inhibitors, we have been able to interpret configurational variation both within a given ensemble as well as between equilibrium ensembles in terms of specific thermodynamic changes. We can accurately evaluate the contribution of each marginal and coupling term to the full entropy as well as provide some insight into how physical coupling of degrees of freedom affects configurational entropy of binding. Our results analyze the efficacy of our approach by exploring thermodynamic convergence, comparisons with experimental measurements of binding affinity, and the role configurational entropy plays in binding. We find that our computed free energies correlate strongly with experiment and that most thermodynamic averages are well-defined by only a small portion of configurational space. Compared to previous computational studies of the inhibitors examined here,24 the enhanced sampling methods employed in this study provide better single-conformation and ensemble estimates that correlate with experimental free energy measurements. We also observe that each inhibitor loses a significant amount of configurational entropy upon binding, and that relative entropy differences among related inhibitors are significant (1–3 kcal/mol). Analysis using the CMIE entropy expansion shows that the majority of both the absolute and relative entropic losses can be traced to changes in marginal conditional entropy and that changes in entropic coupling play a more subtle role in the thermodynamics of inhibitor binding.
2. Methods
2.1. Binding Theory
The theoretical framework for binding thermodynamics has been presented in recent literature;4,41 here, we summarize the relevant portions to place our work in context. The standard free energy of binding for a ligand (L) and receptor (R) in solution can be evaluated using the standard chemical potential for each species,
| 1 |
The standard chemical potential for a dilute solution of ligand is defined as42
| 2 |
Here, VN,L is the volume of the system containing N solvent molecules and one ligand molecule. C° is the standard state concentration, taken as 1 M, which is equivalent to 1000 NA m–3, where NA is Avogadro’s constant. QN,L and QN are the partition functions for systems containing N solvent molecules and one ligand molecule, and only N solvent molecules, respectively. The last term, P°VL, corresponds to the work associated with moving the ligand from the gas phase to a solvated state at constant pressure, where VL is the volume of a single ligand and P° is the standard state pressure. This last term will be very small except at very high pressure, and in the present analysis, it is assumed that binding occurs at 1 atm where this pressure–volume term will be negligible. The ratio of partition functions is expanded as follows,
| 3 |
where β = 1/(kBT), σL is the symmetry number of the ligand, qS/L and pS/L refer to the set of all position and momentum degrees of freedom of the solvent and ligand, respectively, and MS and ML define the total number of solvent and ligand atoms, respectively. U is the internal energy, T is the absolute temperature, h is Planck’s constant, and kB is Boltzmann’s constant. This expression can be simplified by analytically integrating over the momentum portion of phase space (from −∞ to +∞) for each atom i of both the solvent and ligand (pS, pL) and canceling the resulting expressions for the solvent momentum.
| 4 |
Further simplification is possible by defining a potential of mean force W(qL) to make use of an implicit solvent treatment and avoid explicit integration over solvent degrees of freedom. This is done by defining the interaction potential between the ligand and the solvent for a fixed configuration of the system and averaging the Boltzmann factor of this potential over all solvent degrees of freedom.
| 5 |
| 6 |
Substituting eq 6 into eq 4 yields a reduced expression in which the energy of the ligand no longer depends upon the exact configuration of the solvent,
| 7 |
The integral over the coordinates of the ligand (qL) can also be simplified by defining an internal reference frame that does not depend on absolute external coordinates (i.e., translational and rotational coordinates) of the ligand. This coordinate frame is defined using a set of three bonded atoms in the ligand to specify the six external degrees of freedom and a set of 3N–6 bond length (rL), bond angle (θL), and torsional angle (ϕL) (BAT) coordinates to recursively specify the position of each subsequent atom relative to the position of the first three atoms. This coordinate change allows the integral over ligand configurational space to be separated into external and internal pieces, where the potential of the solvated ligand (U(qL)) is now independent of the external degrees of freedom. Analytically integrating over these external degrees of freedom of the ligand yields a constant factor of 8π2VN,L.4 The remaining integral over internal degrees of freedom can be computed numerically (often approximately and on a coarse grid due to size), and doing so in a BAT coordinate system often results in improved accuracy, as BAT sampling corresponds to natural motions of the molecule and a smoother exploration of the potential energy surface compared to a Cartesian coordinate system.43 After simplification, the resulting expression for μsol,L° is
| 8 |
| 9 |
where ZL is a configurational integral
over the solvated ligand, internal degrees of freedom, and JL =  rL2 sin θL is the Jacobian weight for sampling
in a BAT space.44,45 Note that in this study only
torsional degrees of freedom of the ligand were explored. Bond lengths
and bond angles were held fixed at their equilibrium values, as it
has been suggested that these degrees of freedom experience only small
changes in configurational freedom upon binding and contribute negligibly
to the free energy change.10 Receptor degrees
of freedom were held fixed due to issues of computational tractability
and the large number of receptor degrees of freedom.
rL2 sin θL is the Jacobian weight for sampling
in a BAT space.44,45 Note that in this study only
torsional degrees of freedom of the ligand were explored. Bond lengths
and bond angles were held fixed at their equilibrium values, as it
has been suggested that these degrees of freedom experience only small
changes in configurational freedom upon binding and contribute negligibly
to the free energy change.10 Receptor degrees
of freedom were held fixed due to issues of computational tractability
and the large number of receptor degrees of freedom.
The derivations for the standard chemical potential of the receptor and complex are similar and will not be repeated here. It should be noted, however, that in the complex the six external (i.e., translational and rotational) degrees of freedom of the bound ligand become internal degrees of freedom of the complex and integration over these new internal degrees of freedom is limited to only those conformations in which the ligand is actually bound and contained entirely within the receptor’s active site cavity. Combining eq 1 with eq 8 for the ligand, receptor, and complex, the following expression for the standard free energy change is obtained
| 10 |
Note that this expression is only dependent upon the configurational degrees of freedom of the complex, unbound receptor, and unbound ligand; all factors resulting from integration over the momentum portion of phase space exactly cancel when taking the difference between the bound and unbound states.
Once the partition functions in the bound and unbound states have been found, the enthalpy change (excluding negligible pressure–volume terms) can be found by calculating the appropriate averages over solute configurational space
| 11 |
where ⟨⟩qR/L defines the configurational ensemble average over ligand and receptor degrees of freedom, respectively. The configurational entropy change upon binding can be found through the canonical equation46
| 12 |
which results in the following expression
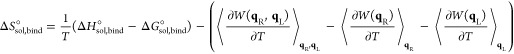 |
13 |
The final three terms that appear in the above expression for the entropy change result from the introduction of a potential of mean force (eq 6) to implicitly deal with solvent degrees of freedom. This formulation partitions the entropy change into additive solute and conditional solvent components in a mathematically and thermodynamically rigorous fashion.41,47 The first two terms in eq 13 correspond to the configurational entropy change of the solute, while the remaining terms correspond to the change in solvent entropy conditioned on the configurational state of the solute, averaged over all solute configurational degrees of freedom.
| 14 |
In the present study, all reported free energy differences include enthalpic and entropic contributions from both solute and solvent degrees of freedom, while all reported entropic free energies include only contributions from the solute degrees of freedom.
2.2. Conditional Mutual Information Expansion
The configurational entropy of each ligand was decomposed into individual, per degree of freedom entropy and higher-order coupling terms using a conditional mutual information expansion (CMIE). Similar to the mutual information expansion presented by Matsuda34 and Killian et al.,35 this expansion divides the full entropy into a sum of sequentially higher-order mutual information terms. However, rather than partition the total entropy into a set of overlapping entropic contributions that are added and subtracted with successive terms, we partition the space into a set of mutually exclusive terms, each of which captures the entropy content of either a single degree of freedom or the coupling between a group of degrees of freedom. This is done by adding up the mutual information of all possible combinations of degrees of freedom, given that the distributions of the remaining variables are known. This can be expressed as
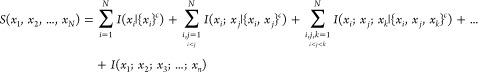 |
15 |
where N is the total number of degrees of freedom of the system, {x}c is the complement of {x}, and I({x}|{x}c) is the mutual information of a set of variables {x} conditioned on the complementary set {x}c or simply the conditional entropy when |{x}| = 1. The semicolon used here denotes mutual information between degrees of freedom (e.g., I(xi;xj;xk) denotes the mutual information shared between the three probability distributions xi, xj, and xk). This decomposition follows from the set measure-theoretic definition of multivariate mutual information,48,49 where each conditional information term corresponds to a nonoverlapping subset of an information diagram.
As an example, consider a system with three degrees of freedom {x,y,z}. The CMIE for this system is
| 16 |
where the first three terms are of first order, the second three terms are of second order, and the last term is of third order. As illustrated in Figure 1, the first-order terms define the conditional entropy due solely to each individual degree of freedom; this corresponds to the average entropy due to a single degree of freedom, given that the remaining degrees of freedom are known. That is, first-order measures define the entropy due to each degree of freedom that is not mediated by any other degrees of freedom through coupling. Similarly, the second-order terms define the conditional mutual information between each pair of degrees of freedom, which correspond to measures of the coupling present between pairs of variables that is not mediated by higher-order coupling. The third-order term defines the higher-order coupling present among all variables. It is important to note that while this expansion partitions the entropy into nonoverlapping pieces, only first- and second-order terms are guaranteed to be positive.47 As such, higher-order mutual information terms can either increase or decrease the total entropy of the system. Additionally, as with any entropy expansion, all of these terms are fundamentally dependent upon the choice of the reference frame and thus represent a potentially nonunique but still useful interpretation.4,41
Figure 1.
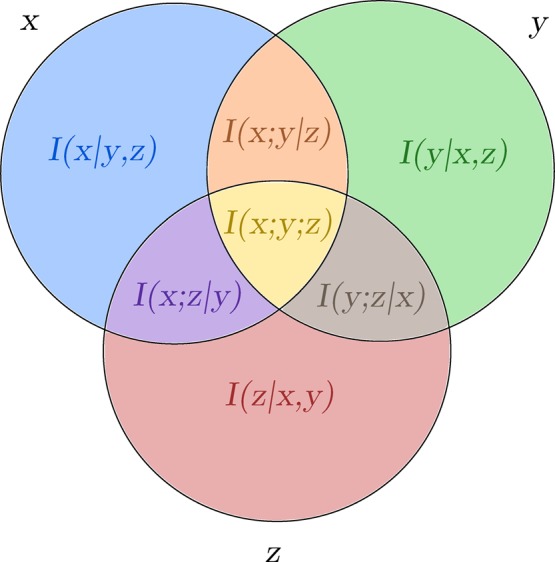
Three body conditional mutual information expansion. The entropy of a three body system with degrees of freedom x, y, and z corresponds to the union of all three circles. This total entropy is decomposed according to eq 16 into marginal entropies (blue, green, and red areas), pairwise coupling entropies (purple, orange, and brown areas), and a single three-body or third-order entropy (yellow area).
2.3. Ensemble Enumeration and Partition Function Determination
The bound and unbound state configurational integrals (eq 9) for five HIV-1 protease inhibitors (Figure 2) were evaluated via a three-step, rotamer based, enumerative configurational search. All internal torsions as well as the six ligand–receptor intermolecular BAT degrees of freedom were rotamerized using uniform step sizes to exhaustively explore configurational space at different levels of discretization. All examined ligands were comprised of a common chemical scaffold with potentially variable functional groups at five positions (R1-R5). The first step of the search involved generating separate discretized libraries of scaffold positions and orientations as well as rotamer libraries of all possible functional group configurations relative to the scaffold. The second step employed the guaranteed DEE/A* search algorithms to explore all possible combinations of the rotamer libraries found in the first step and generate an energy-ordered list of all possible low-energy configurations using a pairwise additive energy function (termed low-resolution). The third phase of the calculation used a tiered energy function strategy to re-evaluate the energies of the collected low-energy configurations using a high-resolution energy function and numerically integrate over the explored configurational space.
Figure 2.

Selected HIV-1 protease inhibitor structures. These five inhibitors were originally designed by Altman et al. to test the substrate envelope hypothesis.24 They are derived from the darunavir/amprenavir scaffold and all exhibit nanomolar binding affinity.
The ensemble of low-energy scaffold conformations was generated using an enumerative, Metropolis Monte Carlo (MC) search.50 The goal of this step was not to collect a Boltzmann ensemble via sampling, as is traditionally done using MC, but to mine for an ensemble of low-energy scaffold configurations whose relative probabilities will be explicitly computed after exploring the remaining configurational space. For all simulations, a thermodynamic temperature of 298 K was used, as was a continuous move set of all torsional rotations, excluding methyl and amide bond rotations, and overall translations and rotations in the bound state. The upper bounds on step sizes for overall translations and rotations were set to 0.5 Å and 30°, and individual torsional moves were capped at 15° and 180° in the bound and unbound state, respectively, with an equal weight applied to all moves. Ten independent simulations of 50 000 steps each were performed for each ligand in both the bound and unbound states, and the scaffold pose and internal, torsional degrees of freedom of all collected configurations were snapped to a uniform rotamer grid. In the bound state, the six atoms used to define the scaffold pose reference frame in BAT coordinates were receptor atoms Cβ, Cγ, and Oδ2 of residue D25 (chain B) and atoms C1, C2, and C3 of the scaffold (Figure 2). The six ligand–receptor BAT degrees of freedom were bond length Oδ2–C1, pseudotorsions Cβ–Cγ–Oδ2–C1, Cγ–Oδ2–C1–C2, and Oδ2–C1–C2–C3, and pseudobond angles Cγ–Oδ2–C1 and Oδ2–C1–C2.
The bound-state grid for the scaffold pose and internal, torsional degrees of freedom was defined using a resolution of 0.1 Å and 10° for all bond lengths and bond angles and torsions. The unbound state grid was defined only for internal, torsional degrees of freedom using a resolution of 20°. All simulations were performed using the CHARMM computer program2,51 with the CHARMm22 force field52 and a distance-dependent dielectric constant of 4.
The remaining internal torsional degrees of freedom (i.e., functional group torsions) were explored using an in-house implementation of the DEE and A* algorithms.24 Using uniformly sampled, complete scaffold and functional group rotamer libraries, these algorithms are guaranteed to find the GMEC as well as all other near-optimal structures up to a user supplied energy cutoff. Using the list of collected energies produced by this guaranteed search, Boltzmann factors (e–βUi) were calculated for each configuration i and used to compute a low-resolution estimate of the configurational integral (eq 9) by numerical quadrature. Multiple functional group rotamer libraries were used in this study, including those that contained all possible combinations of internal torsional degrees of freedom sampled uniformly every 120°, 60°, 30°, and 15° in the bound state, and every 120°, 60°, and 30° in the unbound state. For all high-throughput energy evaluations, a pairwise decomposable energy function was used that included all pairwise van der Waals and Coulombic, intra- and intermolecular interactions, computed with the CHARMm22 parameter set52 but ignored internal energy differences for computational efficiency. The energy cutoff used in this low-resolution estimate was always ≤10 kcal/mol, as this provided enough coverage of the potential energy landscape to guarantee partition function convergence (vide infra).
The final step of the search included the energetic re-evaluation of the collected ensemble using a higher resolution (more detailed) energy function to account for solvation effects and to obtain a more accurate measure of the free energy change upon binding. The improved energy function included all pairwise van der Waals interactions, continuum electrostatic solvation energies collected from a converged linearized Poisson–Boltzmann calculation using the DelPhi computer program,53,54 as well as solvent accessible surface area energies to model the hydrophobic effect.55 Solvation energies were calculated using an internal dielectric of 4 and a solvent dielectric of 80. A grid resolution of 129 × 129 × 129 with focusing boundary conditions56 was used, along with a Stern layer of 2.0 Å and an ionic strength of 0.145 M.
The high-resolution (HRes) free energy was computed by reassessing the 50 000 lowest energy configurations using the HRes energy function and re-evaluating the configurational integral. This truncated integral was then corrected using an approximate term that accounted for the contributions of the remaining low-energy configurational ensemble. This correction corresponds to integrating over the HRes energy levels of the unaccounted portion of the ensemble using a probabilistic formalism similar to those hierarchical evaluation methods used in molecular design.57 Formally, this method breaks up the ligand low-energy configurational space into two regions: one described in terms of explicit configurational states evaluated using the HRes energy function, and the other in terms of distributions of HRes energy levels (EHR) inferred from the low resolution (LRes) energy level (ELR) distribution:
| 17 |
Here, g(EHR) is the degeneracy of the HRes energy levels, and A and B define complementary regions of configurational space that together cover the entire space. Note that this approximation of the HRes energy space was made for computational efficiency, as it is currently computationally intractable to explicitly re-evaluate a sufficiently large number of the millions of configurations collected from the LRes DEE/A* search necessary to ensure convergence. As outlined above, the first term of eq 17 corresponds to the HRes partition function defined by some fraction of the total number of low-energy configurations, and it is calculated by explicitly re-evaluating the energies of the top 50 000 configurations and integrating over these states. The second term estimates the contributions made by the remaining, higher-energy members of the full ensemble to the HRes partition function and can be viewed as a correction to the first term. It was computed using an approximate distribution of HRes energy levels, inferred from the known LRes energy-level distribution, to estimate the degeneracy (i.e., number density of configurations) at a given HRes energy level. Specifically, the collected LRes energy space (minus the top 50 000 structures) was divided into 0.1 kcal/mol bins, and a randomly selected set of 1000 configurations was re-evaluated in each bin. Each 1000-configuration sample was used to approximate the distribution of HRes energy levels observed in each LRes bin i. The resulting set of normalized high-resolution energy-level probability distributions, P(EHR)i, was fit to either single- or double-skew normal distributions,58 as the HRes energy distributions bore a strong resemblance to these functional forms, to determine the approximate shape of the distribution. Each was then weighted by the number of configurations in that particular bin ρi, which yielded the HRes energy level degeneracy in each bin, g(EHR)i.
| 18 |
The total contribution of all bins to the high-resolution partition function was then calculated by integrating over the HRes energy levels in each bin via numerical quadrature and then summing over each LRes bin
| 19 |
2.4. Structure Preparation
The receptor structure used in this study was a darunavir bound X-ray crystal structure obtained from the Protein Data Bank (PDB; Accession code 1T3R),59,60 prepared using methods and structural modifications described by Altman et al.24 Partial atomic charges for each inhibitor were determined by fitting to the electrostatic potential of an optimized ground-state structure using the restrained fitting method of Bayly et al.61 Geometry optimizations as well as electrostatic potential calculations were performed with the GAUSSIAN 03 computer program62 using the Restricted Hartree–Fock method with the 3-21G and 6-31G* basis sets, respectively.
2.5. Experimental Determination of Inhibitor Dissociation Constants
HIV-1 protease inhibitor activities were determined by a fluorescence resonance energy transfer (FRET) method. Protease substrate 1 [Arg-Glu(EDANS)-Ser-Gln-Asn-Tyr-Pro-Ile-Val-Gln-Lys(DABCYL)-Arg] was labeled with the energy transfer donor, 5-((2-Aminoethyl)amino)naphthalene-1-sulfonic acid (EDANS), and acceptor, 4-((4-(dimethylamino)phenyl)azo)benzoic acid (DABCYL), dyes at its two ends to perform FRET.63 Fluorescence measurements were carried out on Victor2V plate reader (PerkinElmer). Excitation and emission filters were 340 and 490 nm, respectively. All inhibitors were dissolved in dimethyl sulfoxide (DMSO) and each of them was diluted to 12 appropriate concentrations. Protease (2 μL) and inhibitor or DMSO (2 μL) were added into a 96-well assay plate containing 76 μL of HIV-1 protease substrate buffer. All pipettings were performed by a liquid handling system (Tecan Genesis). 80 μL of protease substrate (2 μM) was quickly added into the well with an injector to initiate the cleavage reaction. Each reaction was recorded for 5 min. Inhibitor dissociation constants (Ki) were obtained by nonlinear regression fitting (GraFit 5) of the plot of the initial velocity as a function of inhibitor concentrations based on the Morrison equation.64,65 The reported Ki values were an average of at least 3 individual measurements.
3. Results and Discussion
Using the enumerative, configurational search method described herein, we explored the configurational space of five HIV-1 protease inhibitors. We assessed the precision and accuracy of our method by examining its thermodynamic convergence properties as a function of the granularity of the rotamer libraries used and the size of the ensemble collected as well as by comparing the converged, calculated inhibitor binding free energies to experimental measurements. We subsequently analyzed the source of the changes in the entropic free energy upon binding in terms of both marginal entropy changes of individual ligand degrees of freedom as well as coupling entropy changes between multiple ligand degrees of freedom.
3.1. Rotamer Grid Resolution and Thermodynamic Convergence
Conformational space for inhibitor degrees of freedom was explored at multiple resolutions. Ultimately, the grid resolution used to compute all thermodynamic parameters was selected based on the rate of exploration of scaffold degrees of freedom and the numerical convergence observed in the computed free energy. As the configurational search was performed in multiple steps, we examined the convergence of each step separately. In step one, the external and internal scaffold degrees of freedom were explored via an enumerative MC simulation in which collected configurations were snapped onto a uniform rotamer grid of user defined resolution. The coverage of low-energy space was measured at multiple grid resolutions to find the highest resolution grid possible while maximizing coverage (Figure 3). Simulation convergence was quantified via the number of unique, grid-snapped configurations found per MC step, as this growth rate should approach zero as the simulation length increases and more configurational space is explored. A 0.1 Å and 10° grid was used in the bound state and a 20° grid in the unbound, as the final growth rate at these resolutions was 0.03 unique configurations per step or less for all bound and unbound inhibitors. Increasing the grid resolution to 5° and 10° increased the number of unique configurations that required collection to a computationally intractable number of scaffold positions in order to ensure the configurational space was adequately sampled. Note that in all the computed inhibitor ensembles, the unbound state required a coarser grid in order to obtain a comparable rate of convergence using a similar number of overall configurations. This indicates that there is a larger volume of configurational space accessible in the unbound compared to the bound state. Without the receptor present to constrain the torsional motions of the inhibitor, the scaffold is able to adopt a much wider variety of conformations without paying large energetic penalties. It is important to note, however, that while the unbound state has a larger accessible volume of configurations compared to the bound state, the accessible configurational space is smoother, and capturing these features should require less resolution.
Figure 3.

KB-98 enumerative Monte Carlo scaffold grid resolution convergence. (A, B) The unique scaffold configuration and pose growth rates measured as a function of grid resolution and Monte Carlo simulation length in the bound and unbound states. (C, D) Final unique configuration growth rates for bound and unbound state. The dotted line indicates the 0.03 configurations per step acceptance cutoff used.
In the second configurational search step, the remaining functional group degrees of freedom were enumerated using a user specified rotamer step size, yielding a low-resolution measure of free energy. Convergence of this absolute free energy was measured using the rate of change of the free energy as a function of the grid resolution and offset calculations (Figure 4). Comparing sampling resolutions of 15° versus 30° in the bound state and 30° versus 60° in the unbound state, we observed free energy changes of only ≈3% and ≈1%, respectively. Offset calculations in which the grid was translated by half of the grid resolution also yielded small offsets of less than ±1 kcal/mol. Both of these measures of free energy uncertainty suggest that converged measures of the free energy of binding can be found with moderate functional group grid resolutions. These data also suggest that the unbound state has a more degenerate low-energy configurational space than the bound state with wider, less rugged potential energy wells (i.e., vast regions of unbound configurational space are well described by coarser sampling with limited grid error).
Figure 4.

KB-98 functional group grid resolution convergence. (A, B) Low-resolution free energy convergence of KB-98 in the bound and unbound state as a function of the rotamer step size used when searching the functional group degrees of freedom. Error bars indicate the standard deviation computed from the two offset calculations performed at each grid resolution. All calculations use a starting geometry collected from the lowest energy configuration found during the bound state scaffold search. The offset calculations begin from this configuration with each degree of freedom offset by half the step size so as to escape from the initial, low energy well. (C, D) Final rate of free energy change for each examined inhibitor in the bound and unbound state.
3.2. Ensemble Size and Thermodynamic Convergence
The Boltzmann distributions computed for each inhibitor ensemble were truncated at a range of energy cutoffs to explore the effect of collected ensemble size on free energy convergence. These cutoffs define the ensemble of all configurations with energies within a particular energy range above global minimum energy (Figure 5). Our results suggest that only a very small portion of configurational space is necessary to achieve a very high level of convergence for the free energy so long as it covers the low-energy conformations in the space. The lowest 1 kcal/mol of the ensemble brings the computed free energy within 2% (≈1.5 kcal/mol) of the converged free energy value in the bound state and within 5% (≈2.5 kcal/mol) in the unbound state. At the highest degree of rotamerization, this corresponds to less than 200 and 700 configurations in the bound and unbound states, respectively. This behavior was observed in all configurational ensembles, and all thermodynamic averages were converged to within less than 1 kcal/mol when the full set of configurations was included. This rapid convergence suggests that the most relevant portions of configurational space are low-energy wells and that the average thermodynamic properties of these systems are well described by low-energy configurational ensembles, supportive of the predominant state hypothesis.10
Figure 5.

Configurational free energy convergence. (A–C) The convergence of the free energy, enthalpy, and entropy of KB-98 in the bound state, using a 10° scaffold and 15° functional group grid, as a function of ensemble size, measured in kcal/mol above the global minimum energy. The red portion of curve shows the contribution to the average from the top 50 000 configurations (computed by explicit re-evaluation), and the blue portion shows the contribution from the remaining millions of configurations (computed via high resolution energy level inference). (D) The final rate of convergence of each thermodynamic parameter for each inhibitor in the bound state measured as a function of change in ensemble cutoff (kcal/mol per kcal/mol of the ensemble). (E–H) Measures of convergence for the unbound state using a 20° scaffold and 60° functional group grid.
One should note, however, that given a fixed ensemble size, not all averages reach the same level of convergence. We observe that ensemble enthalpies and entropies show slower rates of convergence compared to free energies, consistent with their derivative relationship to the partition function.66 Using a 15° grid in the bound state and a 60° grid in the unbound state, the ensemble free energies exhibited an average final rate of convergence of 0.001 and 0.1 kcal/mol per kcal/mol of the ensemble, respectively. By comparison, both the enthalpy and entropy averages showed average final rates of 0.02/0.2 and 0.02/0.3 (bound/unbound). These data suggest that larger fractions of configurational space are required to accurately gauge enthalpic or entropic contributions to binding compared to the full free energy and that the sampling error associated with these contributions partially cancels when computing the free energy. In particular, accurate estimation of entropic changes requires elaboration of low-probability (i.e., high-energy) regions of the distribution, which becomes increasingly difficult to explore as the degeneracy of configurational space increases. Nonetheless, the required low-probability regions identified here fall within the lowest 10 kcal/mol of the ensemble. Finally, in all cases, a significantly smaller portion of the less degenerate bound-state space was required to obtain comparable levels of convergence compared to the unbound state.
3.3. Experimental versus Calculated Inhibitor Affinities
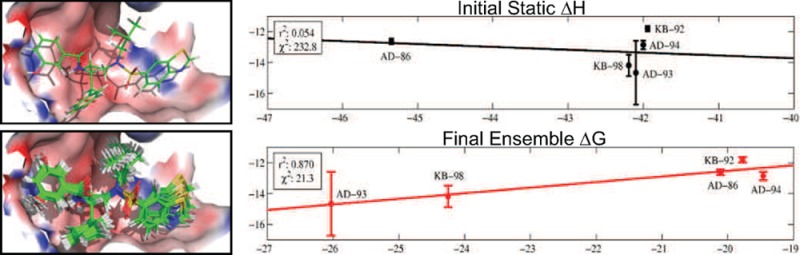
One of the primary motivations in this study was the lack of strong correlation between the originally computed design energies for these inhibitors and experiment (Figure 6A). We sought to improve upon our original relative affinity predictions and examine which methodological enhancements brought about the most significant correlative improvement of calculated affinity with experiment. Examining the r2 correlation coefficients for calculated vs experimental affinity, the previous static enthalpy metric shows almost no correlation (0.05). Note that the single conformations used to evaluate binding in this study were found using a coarser rotamer library, a constrained scaffold set, and the rigid binding approximation. Using our more exhaustive search method, we first examined the effect of searching both the bound and unbound states in tandem for low-energy structures with a higher resolution rotamer set (Figure 6B). By selecting the lowest energy structure in both the bound and unbound ensembles, we computed a static enthalpy of binding that shows marked correlation with experiment (r2 ≈ 0.7) and significant reduction in the variance weighted sum of squared error (χ2 ≈ 47 vs 230). While the relative affinity ordering is still not correct, we have effectively separated the cluster of drugs that were previously all predicted to bind with the same affinity. This large improvement in correlation likely stems from two factors: searching conformational space more finely and appropriately accounting for the significant conformational change that each inhibitor undergoes upon binding with independent bound and unbound state searches. Heavy atom, least-squares alignments of the best unbound to bound conformations show root-mean-square deviations of greater than 3.4 Å for each of the five inhibitors. Additionally, when bound inside the protease, each inhibitor takes on an extended shape to fit within the active site, and when unbound, each inhibitor undergoes a structural collapse in order to maximize solvation as well as intramolecular interactions. We find that the solvent accessible surface area of the best inhibitor configurations increased on average by 80 ± 20 Å2 upon binding.
Figure 6.

Correlation between calculated and experimental binding affinity. Effect of approximation on the correlation of the calculated inhibitor affinities with the experimental binding free energies. (A) Correlation between previously calculated static enthalpy metric (single conformation energy assuming rigid binding) and experiment. (B) Correlation between updated, static enthalpy metric (single conformation energy difference between bound and unbound states) and experiment. (C) Correlation between ensemble enthalpy and experiment. (D) Correlation between updated static enthalpy with ensemble entropy change and experiment. (E) Correlation between ensemble free energy change and experiment.
We next examined the correlative effect of ensemble averaging by computing the average enthalpy change upon binding for each of the five inhibitors (Figure 6C). This further improved correlation with experiment, yielding an r2 value of 0.85, an additional 2-fold reduction in χ2 error, and the correct relative ranking of each inhibitor. Incorporating the ensemble average into the calculation of the enthalpy change had a significant effect on both the bound and unbound state and moved the average enthalpy up by 2.3 ± 0.2 kcal/mol and 2.8 ± 0.7 kcal/mol in the bound and unbound state, respectively. Examining the net difference, we find that KB-98 and AD-86 experienced the largest change relative to their static enthalpy evaluation (≈1 kcal/mol). This is due to the fact that for these two inhibitors, the average unbound state enthalpy was pushed up by 1 kcal/mol more than in the bound state, which suggests that the unbound low-energy state space of these two compounds is larger compared to the remaining inhibitors. These changes result in residual improvement for all points except AD-93, with KB-98, KB-92, and AD-94 showing the largest improvement.
We also examined the correlative effect of ensemble averaging by correcting the new static enthalpy estimates with our computed entropy penalties (Figure 6D). Interestingly, this also introduced a clear separation between the high-affinity inhibitors (KB-98 and AD-93) and the less effective ones (AD-94, KB-92, and AD-86), and significantly improved correlation with experiment, giving a correlation coefficient of 0.84. Comparing this correlation with that of the new static enthalpy change, the observed improvement is primarily the result of bringing KB-98 and AD-94 closer to the best fit line. KB-98 shifted because its computed entropic free energy loss was much smaller relative to the other computed entropic penalties, while AD-94 shifted because it experienced the largest entropic free energy loss. Note that attempts to similarly correct the new static enthalpy with a constant, entropic penalty per rotatable bond fail to significantly improve correlation. We explored possible constant corrections up to 2 kcal/mol/bond, and the most effective (0.5 kcal/mol/bond) only yielded an r2 value of 0.74.
The final effect we explored was accounting for both the configurational entropy change of the ligand (ΔSbind) as well as the average enthalpy change (ΔHbind) upon binding, which together correspond to the full configurational free energy of binding, ΔGbind (Figure 6E). Surprisingly, while separately including either ensemble measure significantly improves correlation, together there is only a slight improvement over previously examined metrics (r2 ≈ 0.87). Each ensemble measure captures similar information such that together they have only a small, coupled effect. In total, our results show that finding a better estimate of the global minimum energy conformation (GMEC) in both the bound and unbound states can substantially improve relative inhibitor rankings but that further improvement necessitates an ensemble treatment. We find that including information about the shape of the minimum energy potential well and surrounding wells, in addition to its relative position, is required to resolve more subtle differences between inhibitors. We note that while the slopes of these lines of best fit are larger than 1, our primary design objective was to improve the relative ranking of these inhibitors, which does not depend on their absolute correlation with experimental free energies. However, we suspect that this discrepancy may be due to the assumption that the protein remains rigid for all bound states.
A similar quantitative picture emerges when examining the calculated enthalpy–entropy breakdown of these inhibitors (Table 1). We observed that ΔH is favorable and nearly twice the size of the unfavorable, configurational entropy loss. Given this large relative difference and the functional form of the Boltzmann distribution, the importance of the GMEC in ranking can be rationalized, as this distribution is strongly biased toward and peaked about low-energy configurations. It is interesting to note that the configurational entropy changes of the ligand (−TΔS) are quite large (+22–26 kcal/mol), and they are very similar to previous estimates of the configurational entropy loss of chemically similar HIV-1 protease inhibitors calculated using different methodologies.10 In contrast to cheaper, empirical measures of configurational entropy loss, these entropies show only marginal correlation with the number of rotatable bonds explored (r2 ≈ 0.5). In particular, the entropy losses of AD-94 and AD-86 deviate significantly from the trend exhibited by KB-98, AD-93, and KB-92, which show a consistent loss of ≈1 kcal/mol per rotatable bond. Both KB-92 and AD-94 have 15 rotatable bonds, yet AD-94 loses nearly 1.5 kcal/mol more in entropic free energy upon binding. Structurally, these two inhibitors are also very similar and differ only in the identity and flexibility of their R2 and R3 functional groups. In AD-94, R2 is more flexible than R3, while the reverse is true for KB-92. In the case of AD-86, we find that it lost nearly 2 kcal/mol less entropic free energy than would be expected assuming a constant entropic penalty. It is more flexible than KB-92 at the R1 and R2 positions and AD-94 at the R1 and R3 positions, yet it lost much less entropy than expected given its flexibility. These deviations highlight the fact that both the number of rotatable bonds as well as their location influence configurational entropy losses.
Table 1. Calculated Thermodynamic Changes (kcal/mol) upon Binding for the Five Tested HIV-1 Protease Inhibitors.
| KB-98 | AD-93 | KB-92 | AD-94 | AD-86 | |
|---|---|---|---|---|---|
| ΔG | –24.3 | –26.0 | –19.8 | –19.5 | –20.1 |
| ΔH | –46.9 | –49.7 | –44.5 | –45.6 | –45.1 |
| –TΔS | 22.6 | 23.7 | 24.8 | 26.1 | 24.96 |
| no. rot. bonds | 13 | 14 | 15 | 15 | 17 |
3.4. Analysis of Marginal Configurational Entropy Changes
In order to understand the subtle entropic differences between these inhibitors and identify the major contributions to the absolute entropy loss, we decomposed inhibitor entropy changes using a conditional mutual information expansion (CMIE). The decomposition separated the entropy change into additive contributions that quantified the marginal conditional entropy losses due to each individual degree of freedom as well as all higher-order changes in coupling entropy (pairs, triplets, etc.). Unlike similar information theoretic entropy decompositions such as MIE35,36 or MIST,37,38 this decomposition was not a means of approximating the true entropy of the bound or unbound state or any high-order coupling entropy terms from lower-order ones. It is simply an alternative expansion whose individual terms provide detail about direct coupling contributions of all subsets of degrees of freedom. We note that if one were not able to enumerate the configurational ensemble as was done here, the CMIE would not be a useful approximation method, as the conditioning of each term (first-order, second-order, etc.) requires knowledge of the full probability distribution of each degree of freedom. We find that the vast majority (95%) of the total ligand conformational entropy change was due to first-order, uncoupled degrees of freedom, and coupling of degrees of freedom accounted for the remaining 5% of contributions. As can be seen in Figure 7, all inhibitors experience large losses in external entropy (≈12.3 kcal/mol), due to constraints limiting motion corresponding to what had been the unbound translational and rotational degrees of freedom. For comparison, assuming a standard state concentration of 1 M, corresponding to a volume of 13280π2 Å3 per molecule, the unbound ligand state has an external, standard state entropic free energy (−TS°) of approximately −7 kcal/mol, with −4.4 kcal/mol from translational entropy and −2.6 kcal/mol from rotational entropy. Note that while this implies that the bound state entropy of external ligand degrees of freedom, which are now internal to the complex, is negative, it comprises only a fraction of the total entropy, which need not be positive. Additionally, these numbers do not account for the entropic contribution of the momentum portion of phase space, which exactly cancels when taking the difference upon binding (see eq 10).67 This estimate of the external entropy loss compares very well with a variety of alternative formulations. In particular, Chang et al. estimate an external entropy loss of 12.3 kcal/mol for a chemically similar inhibitor, amprenavir, binding to HIV-1 protease using the second generation mining minima algorithm, and a loss of 11.6 kcal/mol using the quasiharmonic approximation.10 Using molecular dynamics in conjunction with the quasiharmonic approximation as well as Schlitter’s entropy formula, Carlsson and Aqvist estimate the combined translational and rotational entropy loss of benzene binding to rigid T4 lysozyme to be ≈11 kcal/mol.68
Figure 7.
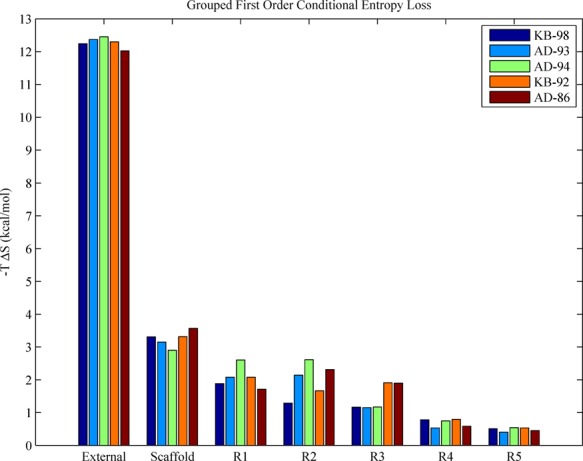
First order conditional entropy losses. The reported entropy loss for each group is defined as the sum of the first-order conditional entropy losses for each degree of freedom contained within the structure group. The scaffold contains 5 torsions, R1 contains up to 5 (KB-98/AD-93, 3; AD-94/KB-92, 4; AD-86, 5), R2 contains up to 2 (KB-98/KB-92, 1; AD-93/AD-94/AD-86, 2), R3 contains up to 2 (KB-98/AD-93/AD-94, 1; KB-92/AD-86, 2), and both R4 and R5 contain 1 torsional degree of freedom.
The remaining internal, inhibitor degrees of freedom contributed net losses of ≈9–11 kcal/mol (Table 2; −TΔSmarginal), with a coupling independent, average loss of 0.7 ± 0.3 kcal/(mol·torsion) of configurational entropic free energy. This average loss is in agreement with previously reported values of 0.4 to 0.9 kcal/(mol·torsion), which were estimated from the experimentally measured thermodynamics of fusion of small hydrocarbons.69 Page and Jencks reported losses of 1–1.4 kcal/(mol·torsion), which were estimated from the entropy loss measured upon hydrocarbon cyclization.70 Note that the former estimate is derived from the entropy loss as a molecule is captured inside a crystal lattice, while the latter is a measure of the entropic cost of freezing out a degree of freedom into a constrained ring structure. The difference between our estimate and that of Page and Jencks could be due to the fact that individual torsional angles are only partially frozen upon ligand binding. As we can see from examining the marginal probability distributions of individual degrees of freedom, many torsional angles retain a considerable amount of conformational freedom upon binding (Figure 8).
Table 2. Calculated Enthalpy and Entropy Component Changes (kcal/mol) upon Binding for the Five Tested HIV-1 Protease Inhibitors as Found from the Top 50 000 Lowest Energy Structures.
| KB-98 | AD-93 | KB-92 | AD-94 | AD-86 | |
|---|---|---|---|---|---|
| ΔHelec | –11.66 | –11.35 | –10.15 | –9.90 | –7.87 |
| ΔHvdw | –64.74 | –67.84 | –60.17 | –61.93 | –66.63 |
| ΔHsasa | –6.23 | –6.45 | –6.23 | –6.22 | –6.29 |
| ΔHsolvation | 35.26 | 35.54 | 33.23 | 33.50 | 33.84 |
| –TΔSext | 12.25 | 12.37 | 12.45 | 12.30 | 12.03 |
| –TΔSmarginal | 8.94 | 9.58 | 10.79 | 10.35 | 10.62 |
| –TΔScoupling | 0.19 | 0.86 | 1.28 | 0.96 | 0.18 |
Figure 8.

Selected marginal distributions of KB-98 (A) Marginal distributions for selected torsional degrees of freedom in the bound and unbound states of KB-98. (B) Structure of KB-98 marked with degrees of freedom 1–5.
Further exploration of these distributions showed unique differences in how each distribution changes upon binding. We observed two major trends among all the inhibitors, which we illustrate using KB-98 as an example. First, moving down either column in Figure 8, we see the distributions becoming increasingly spread out, indicating that each degree of freedom is increasingly more mobile. Small-angle rotations about scaffold torsions (degrees of freedom one and two) swing large lever arms, which result in large displacements. Comparatively, rotations around terminal dihedral angles (e.g., degree of freedom five) swing small lever arms and, as a result, tolerate much larger changes. Second, loss of configurational freedom upon binding for these inhibitors was due both to the disappearance of populated wells and to well contraction. Comparing the unbound- and bound-state distributions for degrees of freedom one, two, and four, we observed a collapse from a multimodal distribution to a unimodal one. Additionally, making the same comparison for degrees of freedom one, three, and four, the corresponding wells contracted from a width of 80°, 120°, and 90° in the unbound state to 10°, 60°, and 60° in the bound. The marginal distribution changes for scaffold torsions were particularly stark, with unimodal collapse and contraction upon binding for almost all core degrees of freedom across all the examined inhibitors. The window of occupied configurational states for these motions is always less than 20° in the bound state, which implies that accurate sampling of these highly constrained degrees of freedom requires very small step sizes. Comparatively, the most free motions correspond to hydroxyl rotations, as they have the shortest associated lever arm. All such groups exhibit broad, nearly uniform distributions in the unbound state, which become more biased (widths of ≈180°) and centered around an ideal hydrogen bond position upon binding.
Examining these marginal distributions for the variable functional groups R1, R2, and R3 across all of the studied inhibitors and their marginal entropy losses, we noted a spatial dependence of the marginal entropy loss, with differential losses per degree of freedom depending on where the structural group interacts within the active site. Table 3 shows the average entropy loss upon binding per degree of freedom for the external, scaffold, and functional groups. Averaging over all five inhibitors, we find that for this scaffold the R3 group, which binds in the P2′ pocket, experienced the largest entropic loss per degree of freedom (1.2 ± 0.5 kcal/(mol·torsion)). By comparison, the R1, R2, and R4 groups, which sit in the P2, P1′, and P1 pockets, lost 0.6, 0.8, and 0.7 kcal/(mol·torsion), respectively. This suggests that rigid functional groups might be especially important at this site because groups that bind to the P2′ pocket experience greater losses in entropy per flexible torsion upon binding than other sites. Interestingly, when examining the experimentally measured affinities of the larger MIT-2 inhibitor library, we see a similar trend in which the binding free energy became more unfavorable as the functional groups became more flexible at position R3.24
Table 3. Entropy Loss Per Rotatable Bond (kcal/mol).
| –TΔS (kcal/mol) | |
|---|---|
| external | 2.05 ± 0.03 |
| scaffold | 0.65 ± 0.05 |
| R1 | 0.6 ± 0.1 |
| R2 | 0.8 ± 0.3 |
| R3 | 1.2 ± 0.5 |
| R4 | 0.7 ± 0.1 |
| R5 | 0.49 ± 0.06 |
| avg. internal | 0.7 ± 0.3 |
3.5. Analysis of Coupled Configurational Entropy Changes
The remaining contributions to the change in configurational entropy upon binding were involved in higher-order coupling terms. Individually, these terms were often much smaller than the first-order terms, but their net effect was significant, accounting for 1–2 kcal/mol of entropy in the bound and unbound states as well as being informative of gross intramolecular coupling behavior. By examining the cumulative differences between the net entropy of the bound or unbound states and the entropy as a function of the number of higher-order terms accounted for (i.e., the error), we observed that the source of the coupling entropy differs between the bound and unbound states (Figure 9A–E). In the bound state, the largest source of coupling appears in second-order terms (as the error drops precipitously upon the addition of second-order coupling terms), but that the higher-order effects only become negligible after the addition of ninth- or tenth-order terms, at which point the cumulative error reaches 0. In the unbound state, we again see that the largest source of coupling arises from second-order terms, but note that higher-order effects become negligible by the addition of fourth- or fifth-order terms. The size of the relative drop in the error between the bound and unbound states upon addition of second-order terms suggests that there was more second-order coupling in the unbound versus bound state, whose contribution translates to a loss of entropic free energy upon binding. The relative importance of higher-order coupling terms in the bound state suggests that there was more significant higher-order coupling in the bound versus unbound state, whose contribution translates to a net gain in entropic free energy upon binding. Averaging over all inhibitors, we find that the net change in entropic free energy upon binding was unfavorable for all coupling interactions involving five or fewer degrees of freedom (−TΔS ≈ + 1 kcal/mol total summed across all terms) and generally favorable for all higher-order coupling interactions (−TΔS ≈ – 0.3 kcal/mol total; Figure 9F). This suggests that, upon binding, the receptor restricted not only the independent motions of individual inhibitor rotatable bonds but many of the pairwise, three-, four-, and five-body coupling interactions present in the unbound state as well. Moreover, this suggests that, in the bound state, higher-order coupling between inhibitor torsional degrees of freedom arose as inhibitors adopted specific conformations to adapt to the constrained receptor binding site.
Figure 9.

Cumulative CMIE summation errors. (A–E) Error associated with the cumulative summation of all conditional mutual information terms as a function of term order for each inhibitor in the bound and unbound states. (F) Average, net change in entropic free energy as a function of term order.
We examined the large number of individual coupling interactions in both the bound and unbound ensembles and found that the majority of specific coupling terms each contributed less than 0.05 kcal/mol, and that the largest individual coupling terms never contributed more than ≈0.3 kcal/mol. Consistent with our analysis of the overall changes in coupling, we saw that most of the large magnitude couplings terms appeared in the unbound state and stem from second-order coupling between scaffold degrees of freedom. In particular, we observed strong coupling between adjacent scaffold torsions or between torsions one bond apart. Interestingly, these unique pairs of torsions can modulate the van der Waals packing of the functional groups with each other, and Figure 10A shows the two-dimensional probability distribution for two such coupled torsions in KB-98. These two dihedral angles can manipulate the position of R3 relative to the rest of the inhibitor and cooperatively interact to maximize intramolecular van der Waals interactions between the R3 ring and either the scaffold backbone or the R4 phenyl ring (Figure 10 moving from left to right, top to bottom). These data support the notion that unbound state coupling arose as a result of cooperative motions that maintained intramolecular hydrophobic and ring stacking interactions. Note, however, that none of these couplings individually contributed more than 0.15 kcal/mol to the overall entropy change. By comparison, we observed far fewer, large coupling terms in the bound state, and the most significant (≈0.3 kcal/mol) arose between the two dihedral angles surrounding the amide moiety in the R1 functional group. These two torsions seem to be coupled in order to modulate the position of the distal R1 hydroxyl group to maintain its position relative to its hydrogen bonding partners. As in the unbound case, these two torsions compensated for each other, although here they affected intermolecular interactions with the receptor. The higher-order, bound state coupling terms are predicted to couple external degrees of freedom to core, scaffold torsions but individually rarely contribute more than 0.1 kcal/mol.
Figure 10.

KB-98 unbound state coupling. (A) Pairwise probability distribution of two coupled scaffold dihedral angles in the unbound ensemble of KB-98. The inset rectangle and arrows highlight the sequence of configurations shown in part C. (B) Unbound KB-98 labeled with dihedrals 1 and 2. Arrows show direction of rotation moving from left to right (dihedral 2) and top to bottom (dihedral 1). (C) Sequence of most probable unbound configurations where dihedrals 1 and 2 have the values indicated by the inset rectangle in part A. Moving from right to left corresponds to clockwise rotation of dihedral 2 with a dihedral 1 fixed, and moving from top to bottom corresponds to counter-clockwise rotation of dihedral 1 with dihedral 2 fixed. Configurations are colored based upon their relative probabilities, with red indicating high probability and the yellow arrows indicate the normal vector of the aromatic rings present in functional groups R3 and R4.
4. Conclusions
We have presented here a novel method to enumerate and study changes in the potential energy landscape of inhibitors upon binding. Using this enumerative, rotamer based approach, we obtained converged binding free energies, enthalpies, and entropies for flexible HIV protease inhibitors that accurately ranked inhibitor affinities relative to one another. We found that using a fine grain configurational search to refine the global minimum energy conformation in the bound and unbound states to rank inhibitors correlated well with experiment but that ensemble effects were critical for more accurate resolution of affinity differences. Breaking the free energy change into components, we observed that average enthalpies and entropies of binding were highly sensitive to the shapes of the global minimum energy well and surrounding wells but that the sampling errors associated with these sensitivities partially canceled when computing the free energy. Additionally, we found that the predominant state assumption appeared valid for these high-affinity inhibitors in both the bound and unbound states. The majority of configurational space contributed only marginally to the ensemble free energy, and converged free energy, enthalpy, and entropy values were obtained when truncating the configurational integral to include only those configurations within 10 kcal/mol of the GMEC. Compared to the free energy, however, computing accurate entropy and enthalpy changes required larger low-energy ensembles that accounted for lower probability regions of phase space.
Analysis of the low-energy thermodynamic ensembles collected in this study revealed both how the shape of this landscape changed upon binding and how these differences translated into changes in the thermodynamic properties of the system. By decomposing the entropy change using an additive, conditional mutual information expansion, we saw that the large computed differences in configurational entropy upon binding originated primarily from losses in external and uncoupled internal entropy, with average losses consistent with previously reported experimental and computational estimates. From a potential energy landscape perspective, these changes arose from both well contraction and well disappearance. Changes in coupling entropy played a more subtle, less pronounced role, and while their net effect was significant and critical to the rank ordering of inhibitor affinity, the entropy present in individual coupled motions was small. We found that most significant coupling interactions were of low (second or third) order and most often appeared between neighboring dihedral angles that could cooperatively modulate intermolecular or intramolecular interactions in the bound and unbound state, respectively. Examining the change in coupling between the bound and unbound state, we observed a net loss of low-order coupling interactions present in the unbound state between core degrees of freedom, and a net gain of high-order coupling interactions that appeared only in the bound state. It is interesting to note that this entropy decomposition could be used to inform the optimization of future inhibitors, as it provides a way to estimate the spacial dependence of entropy loss for a given scaffold and determine the ideal positions to include either flexible or rigid chemical groups.
Overall, these results suggest that inhibitor flexibility plays an important role in binding but that the thermodynamic properties of these high affinity inhibitors are fundamentally determined by a small fraction of the full configurational ensemble. Low-energy configurations dominate the ensemble averages and coupling between inhibitor degrees of freedom has only a small but potentially important effect. It is interesting to note that all of these results and conclusions arise without approximating the geometry of the potential energy landscape or inordinate sampling times. Our method is structured around the use the DEE/A* algorithm, which sorts configurations by their energies and explicitly computes their contribution to the Boltzmann distribution. As a result, the free energy is computed from the bottom up without having to approximate or account explicitly for landscape and well geometry. This ensures that the enthalpic and entropic contributions of all spatially distinct, low-energy minima are included according to their level of import and constructs a convergent, minimal configurational ensemble. By comparison, perturbative methods (FEP, TI) are slow to converge, and alternative end-point approaches focus on computing free energies on a well-by-well basis using Boltzmann sampling to explore configurational space and map out low-energy wells. The often used harmonic and quasiharmonic approximations assume the shape of potential energy well(s) can be accurately modeled as a collection of harmonic oscillators, which provides an analytical expression for the free energy contribution of each well. The former is the basis for normal-mode analysis, which has been widely used to estimate entropy changes in biological systems,71 and the latter is used in the mining minima approach to similar effect.20 The strong agreement found between ours and more approximate methods speaks to the accuracy of the predominant state and harmonic assumptions made for this system, but this may not be true for all systems.
Finally, it is also interesting to note that all the inhibitors examined in this study were originally developed to test the substrate envelope hypothesis and were designed to bind inside the substrate envelope. Four of these inhibitors (KB-98, AD-93, AD-94, and AD-86) were experimentally shown to exhibit relatively flat binding profiles to a variety of HIV protease mutants.24,72 Considering just the top 50 000 configurations in each ensemble, we find that the vast majority of configurations in each of the respective ensembles also fit inside the substrate envelope, suggesting that the envelope hypothesis may be applicable in a more dynamic context. For an inhibitor to be insensitive to mutations in its target, the low-energy ensemble of ligand configurations must fit inside the substrate envelope or substrate envelope ensemble.
The methods outlined here offer a flexible framework in which to study ensemble binding effects, and while the current study only explored ligand configurational freedom, receptor flexibility can be incorporated into this rotamer, DEE/A* based search scheme, given enough computational power. Nonetheless, there are clear limitations to the study presented here, which only considers flexibility in the ligand, binding to a rigid receptor. Proteins have significant numbers of degrees of freedom with local and global motions that will be affected, perhaps differentially, by ligand binding. Moreover, if ligand degrees of freedom couple effectively with receptor ones, then the ligand configurational entropy losses computed here will be overestimates. It has been shown that upon ligand binding the change in protein configurational entropy can be affected both positively and negatively depending upon the specific molecular system.73 In wild-type HIV protease, ligand binding likely causes a decrease in the configurational freedom of many receptor degrees of freedom, as flap mobility is markedly decreased upon ligand binding and the side chains in direct contact with these tight binding ligands likely experience a reduction in configurational freedom due to enthalpy–entropy compensation;74,75 nonetheless, it is unclear how strongly backbone motions and/or residues not in direct contact with these ligand are affected. Despite this limitation, in this study, we were primarily concerned with thermodynamic differences between structurally similar ligands, and our ability to correctly rank them. As such, while the changes in the protein configurational entropy will certainly affect the absolute, total change in entropy upon binding, it may have a much smaller effect between related ligands. Extending this methodology to account for receptor degrees of freedom will help address how important this effect may be. We also note that the lack of treatment of internal energies in this study may differentially affect inhibitors upon binding. They were not accounted for at the high-resolution re-evaluation as they were not originally calculated in the low-resolution energy screen used here or in the previous study from which the inhibitors used here were designed.24 Attempts to introduce their effects at the high-resolution re-evaluation resulted in very poor correlation between the low-resolution and high-resolution energy functions and lack of partition function convergence using the tiered approach applied here (data not shown). We expect that appropriately accounting for the internal energies at both stages of evaluation will result in low/high-resolution energy function correlation comparable to that observed here and further improve the correlation of calculated inhibitors with experiment, both on a relative and absolute scale. Finally, we acknowledge that while we account for the presence of highly conserved ordered water molecules by their explicit inclusion in the bound complex and the electrostatic effects of bulk solvent with our implicit solvation calculations, we likely do not capture the binding thermodynamic effects of semiordered water networks, as such water molecules are neither directly engaged with the complex (and thus not conserved in crystal structures) nor part of the bulk solvent. Water clusters indirectly connected to the ligand or receptor have been observed within the active site in crystal structures of substrate and inhibitor structures,60,76,77 but their specific role in substrate or inhibitor binding is unclear. It is possible that displacement of these water molecules by conformations in the bound state ligand ensemble is thermodynamically unfavorable, further restricting the configurational space of bound ligands, but further study is needed. Given the structural similarity of these inhibitors and their common mode of binding, however, we suspect even if water clusters do further reduce the configurational entropy of each bound ligand, the differential effect between inhibitors is likely small.
Acknowledgments
This work was supported by the National Institutes of Health (GM065418, GM066524, and GM082209) and was carried out on computational equipment supported by the National Science Foundation (0821391) and a generous gift from the Intel Corporation.
The authors declare no competing financial interest.
Funding Statement
National Institutes of Health, United States
References
- Freire E.; Mayorga O. L.; Straume M. Isothermal Titration. Anal. Chem. 1990, 62, 950–959. [Google Scholar]
- Brooks B. R.; Brooks C. L. III; MacKerell A. D. Jr.; Nilsson L.; Petrella R. J.; Roux B.; Won Y.; Archontis G.; Bartels C.; Boresch S.; Caflisch A.; Caves L.; Cui Q.; Dinner A. R.; Feig M.; Fischer S.; Gao J.; Hodoscek M.; Im W.; Kuczera K.; Lazaridis T.; Ma J.; Ovchinnikov V.; Paci E.; Pastor R. W.; Post C. B.; Pu J. Z.; Schaefer M.; Tidor B.; Venable R. M.; Woodcock H. L.; Wu X.; Yang W.; York D. M.; Karplus M. CHARMM: The Biomolecular Simulation Program. J. Comput. Chem. 2009, 30, 1545–1614. [DOI] [PMC free article] [PubMed] [Google Scholar]
- Case D. A.; Cheatham T. E.; Darden T.; Gohlke H.; Luo R.; Merz K. M.; Onufriev A.; Simmerling C.; Wang B.; Woods R. J. The AMBER Biomolecular Simulation Programs. J. Comput. Chem. 2005, 26, 1668–1688. [DOI] [PMC free article] [PubMed] [Google Scholar]
- Gilson M. K.; Given J. A.; Bush B. L.; McCammon J. A. The Statistical-Thermodynamic Basis for Computation of Binding Affinities: A Critical Review. Biophys. J. 1997, 72, 1047–1069. [DOI] [PMC free article] [PubMed] [Google Scholar]
- Pickett S. D.; Sternberg J. E. Empirical Scale of Side-Chain Conformational Entropy in Protein Folding. J. Mol. Biol. 1993, 231, 825–839. [DOI] [PubMed] [Google Scholar]
- Lazardis T.; Masunov A.; Gandolfo F. Contributions to the Binding Free Energy of Ligands to Avadin and Streptavidin. Proteins 2002, 47, 194–208. [DOI] [PubMed] [Google Scholar]
- Wang R. X.; Lai L. H.; Wang S. M. Further Development and Validation of Empirical Scoring Functions for Structure-Based Binding Affinity Prediction. J. Comput.-Aided Mol. Des. 2002, 16, 11–26. [DOI] [PubMed] [Google Scholar]
- Giordanetto F.; Cotesta S.; Catana C.; Trosset J. Y.; Vulpetti A.; Stouten P. F. W.; Kroemer R. T. Novel Scoring Functions Comprising QXP, SASA, and Protein Side-Chain Entropy Terms. J. Chem. Inf. Comput. Sci. 2004, 44, 882–893. [DOI] [PubMed] [Google Scholar]
- Cramer R. D. Tautomers and Topomers: Challenging the Uncertainties of Direct Physicochemical Modeling. J. Comput.-Aided Mol. Des. 2010, 24, 617–620. [DOI] [PubMed] [Google Scholar]
- Chang C. A.; Chen W.; Gilson M. K. Ligand Configurational Entropy and Protein Binding. Proc. Natl. Acad. Sci. U.S.A. 2007, 104, 1534–1539. [DOI] [PMC free article] [PubMed] [Google Scholar]
- Beveridge D. L.; Dicapua F. M. Free-Energy via Molecular Simulation—Applications to Chemical and Biomolecular Systems. Annu. Rev. Biophys. 1989, 18, 431–492. [DOI] [PubMed] [Google Scholar]
- Carlsson J.; Aqvist J. Calculations of Solute and Solvent Entropies from Molecular Dynamics Simulations. Phys. Chem. Chem. Phys. 2006, 8, 5385–5395. [DOI] [PubMed] [Google Scholar]
- Straatsma T. P.; McCammon J. A. Computational Alchemy. Annu. Rev. Phys. Chem. 1992, 43, 407–435. [Google Scholar]
- Dixit S. B.; Chipot C. Can Absolute Free Energies of Association Be Estimated from Molecular Mechanical Simulations? The Biotin–Streptavidin System Revisited. J. Phys. Chem. A 2001, 105, 9795–9799. [Google Scholar]
- Cai Y.; Schiffer C. A. Decomposing the Energetic Impact of Drug Resistant Mutations in HIV-1 Protease on Binding DRV. J. Chem. Theory Comput. 2010, 6, 1358–1368. [DOI] [PMC free article] [PubMed] [Google Scholar]
- Zheng L.; Chen M.; Yang W. Random Walk in Orthogonal Space to Achieve Efficient Free-Energy Simulation of Complex Simulations. Proc. Natl. Acad. Sci. U.S.A. 2008, 105, 20227–20232. [DOI] [PMC free article] [PubMed] [Google Scholar]
- Swanson J. M. J.; Henchman R. H.; McCammon J. A. Revisiting Free Energy Calculations: A Theoretical Connection to MM/PBSA and Direct Calculation of the Association Free Energy. Biophys. J. 2004, 86, 67–74. [DOI] [PMC free article] [PubMed] [Google Scholar]
- Stoica I.; Kashif S. S.; Coveney P. V. Rapid and Accurate Prediction of Binding Free Energies for Saquinavir-Bound HIV-1 Proteases. J. Am. Chem. Soc. 2008, 130, 2639–2648. [DOI] [PubMed] [Google Scholar]
- Head M. S.; Given J. A.; Gilson M. K. Mining Minima: Direct Computation of Conformational Free Energy. J. Phys. Chem. A 1997, 101, 1609–1618. [Google Scholar]
- Chang C.; Gilson M. K. Free Energy, Entropy, and Induced Fit in Host–Guest Recognition: Calculations with the Second-Generation Mining Minima Algorithm. J. Am. Chem. Soc. 2004, 126, 13156–13164. [DOI] [PubMed] [Google Scholar]
- Karplus M.; Kushick J. N. Method for Estimating the Configurational Entropy of Macromolecules. Macromolecules 1981, 14, 325–332. [Google Scholar]
- Luo H.; Sharp K. On the Calculation of Absolute Macromolecular Binding Free Energies. Proc. Natl. Acad. Sci. U.S.A. 2002, 99, 10399–10404. [DOI] [PMC free article] [PubMed] [Google Scholar]
- Chang C.; Chen W.; Gilson M. K. Evaluating the Accuracy of the Quasiharmonic Approximation. J. Chem. Theory Comput. 2005, 1, 1017–1028. [DOI] [PubMed] [Google Scholar]
- Altman M. D.; Ali A.; Reddy K. K.; Nalam M. N. L.; Anjum S. G.; Cao H.; Chellappan S.; Kairys V.; Fernandes M. X.; Gilson M. K.; Schiffer C. A.; Rana T. M.; Tidor B. HIV-1 Protease Inhibitors from Inverse Design in the Substrate Envelope Exhibit Subnanomolar Binding to Drug-Resistant Variants. J. Am. Chem. Soc. 2008, 130, 6099–6113. [DOI] [PMC free article] [PubMed] [Google Scholar]
- Dunbrack R. L. Rotamer Libraries in the 21st Century. Curr. Opin. Struct. Biol. 2002, 12, 431–440. [DOI] [PubMed] [Google Scholar]
- Desmet J.; Maeyer M. D.; Hazes B.; Lasters I. The Dead-End Elimination Theorem and Its Use in Protein Side-Chain Positioning. Nature 1992, 356, 539–542. [DOI] [PubMed] [Google Scholar]
- Dahiyat B. I.; Mayo S. L. Protein Design Automation. Protein Sci. 1996, 5, 895–903. [DOI] [PMC free article] [PubMed] [Google Scholar]
- Dahiyat B. I.; Mayo S. L. De Novo Protein Design: Fully Automated Sequence Selection. Science 1997, 278, 82–87. [DOI] [PubMed] [Google Scholar]
- Pierce N. A.; Spriet J. A.; Desmet J.; Mayo S. L. Conformational Splitting: A More Powerful Criterion for Dead-End Elimination. J. Comput. Chem. 2000, 21, 999–1009. [Google Scholar]
- Hart P. E.; Nilsson N. J.; Raphael B. A Formal Basis for the Heuristic Determination of Minimum Cost Paths. IEEE Trans. on Sys. Sci. and Cybern. SSC4 1968, 2, 100–107. [Google Scholar]
- Leach A. R.; Lemon A. P. Exploring the Conformational Space of Protein Side Chains Using Dead-End Elimination and the A* Algorithm. Proteins 1998, 33, 227–239. [DOI] [PubMed] [Google Scholar]
- Kirkwood J. G. Statistical Mechanics of Fluid Mixtures. J. Chem. Phys. 1935, 3, 300–313. [Google Scholar]
- Kirkwood J. G. Molecular Distribution in Liquids. J. Chem. Phys. 1939, 7, 919–925. [Google Scholar]
- Matsuda H. Physical Nature of Higher-Order Mutual Information: Intrinsic Correlations and Frustration. Phys. Rev. E 1999, 62, 3096–3102. [DOI] [PubMed] [Google Scholar]
- Killian B. J.; Kravitz J. Y.; Gilson M. K. Extraction of Configurational Entropy from Molecular Simulations via an Expansion Approximation. J. Chem. Phys. 2007, 127, 02417. [DOI] [PMC free article] [PubMed] [Google Scholar]
- Killian B. J.; Kravitz J. Y.; Somani S.; Dasgupta P.; Pang Y.; Gilson M. K. Configurational Entropy in Protein–Peptide Binding: Computational Study of Tsg101 Ubiquitin E2 Variant Domain with an HIV-Derived PTAP Nonapeptide. J. Mol. Biol. 2009, 389, 315–335. [DOI] [PMC free article] [PubMed] [Google Scholar]
- King B. M.; Tidor B. MIST: Maximum Information Spanning Trees for Dimension Reduction of Biological Data Sets. Bioinformatics 2009, 25, 1165–1172. [DOI] [PMC free article] [PubMed] [Google Scholar]
- King B. M.; Silver N. W.; Tidor B. Efficient Calculation of Molecular Configurational Entropies Using an Information Theoretic Approximation. J. Phys. Chem. B 2012, 116, 2891–2904. [DOI] [PMC free article] [PubMed] [Google Scholar]
- Attard P.; Jepps O. G.; Marcelja S. Information Content of Signals Using Correlation Function Expansions of the Entropy. Phys. Rev. E 1997, 56, 4052–4067. [Google Scholar]
- Singer A. Maximum Entropy Formulation of the Kirkwood Superposition Approximation. J. Chem. Phys. 2004, 121, 3657–3666. [DOI] [PubMed] [Google Scholar]
- Zhou H. X.; Gilson M. K. Theory of Free Energy and Entropy in Noncovalent Binding. Chem. Rev. 2009, 109, 4092–4107. [DOI] [PMC free article] [PubMed] [Google Scholar]
- Hill T. L.Cooperativity Theory in Biochemistry; Springer-Verlag, New York, 1985. [Google Scholar]
- Chang C. A.; Potter M. J.; Gilson M. K. Calculation of Molecular Configuration Integrals. J. Phys. Chem. B. 2003, 107, 1048–1055. [Google Scholar]
- Pitzer K. S. Energy Levels and Thermodynamic Functions for Molecules with Internal Rotation. J. Chem. Phys. 1946, 14, 239–243. [Google Scholar]
- Go N.; Sheraga H. A. On the Use of Classical Statistical Mechanics in the Treatment of Polymer Chain Conformation. Macromolecules 1976, 9, 535–542. [Google Scholar]
- McQuarrie D. A.Statistical Mechanics; University Science Books: Sausalito, CA, 2000. [Google Scholar]
- Cover T. M.; Thomas J. A.. Elements of Information Theory; Wiley-Interscience: New York, 2006. [Google Scholar]
- Reza F. M.An Introduction to Information Theory; Dover Publications: Dover, NY, 1994. [Google Scholar]
- Fano R. M.Transmission of Information; A Statistical Theory of Communications; MIT Press: Cambridge, MA, 1963. [Google Scholar]
- Metropolis N.; Rosenbluth A. W.; Rosenbluth M. N.; Teller A. H.; Teller E. Equations of State Calculations by Fast Computing Machines. J. Chem. Phys. 1953, 21, 1087–1092. [Google Scholar]
- Brooks B. R.; Bruccoleri R. E.; Olafson B. D.; States D. J.; Swaminathan S.; Karplus M. CHARMM: A Program for Macromolecular Energy, Minimization, and Dynamics Calculations. J. Comput. Chem. 1983, 4, 187–217. [Google Scholar]
- Momany F. A.; Rone R. Validation of the General-Purpose QUANTA(R)3.2/CHARMM(R) Force-Field. J. Comput. Chem. 1992, 13, 888–900. [Google Scholar]
- Gilson M. K.; Honig B. Calculation of the Total Electrostatic Energy of a Macromolecular System: Solvation Energies, Binding Energies, and Conformational Analysis. Proteins 1988, 4, 7–18. [DOI] [PubMed] [Google Scholar]
- Nicholls A.; Honig B. A Rapid Finite-Difference Algorithm, Utilizing Successive Over-relaxation to Solve the Poisson–Boltzmann Equation. J. Comput. Chem. 1991, 12, 435–445. [Google Scholar]
- Sitkoff D.; Sharp K. A.; Honig B. Accurate Calculation of Hydration Free-Energies Using Macroscopic Solvent Models. J. Phys. Chem. 1994, 98, 1978–1988. [Google Scholar]
- Gilson M. K.; Sharp K. A.; Honig B. H. Calculating the Electrostatic Potential of Molecules in Solution—Method and Error Assessment. J. Comput. Chem. 1988, 9, 327–335. [Google Scholar]
- Green D. F. A Statistical Framework for Hierarchical Methods in Molecular Simulation and Design. J. Chem. Theory Comput. 2010, 5, 1682–1697. [DOI] [PubMed] [Google Scholar]
- Azzalini A. A Class of Distributions Which Includes the Normal Ones. Scand. J. Stat. 1985, 12, 171–178. [Google Scholar]
- Berman H. M.; Westbrook J.; Feng Z.; Gilliland G.; Bhat T. N.; Weissig H.; Shindyalov I. N.; Bourne P. E. The Protein Data Bank. Nucleic Acids Res. 2000, 28, 235–242. [DOI] [PMC free article] [PubMed] [Google Scholar]
- Surleraux D. L.; Tahri A.; Verscheuren W. G.; Phille G. M.; de Kock H. A.; Jonckers T. H.; Peeters A.; de Meyer S.; Azijn H.; Pauwels R.; de Bethune M. P.; King N. M.; Prabu-Jeyabalan M.; Schiffer C. A.; Wigerinck P. B. HIV Protease Wild-Type in Complex with TMC114 Inhibitor. J. Med. Chem. 2005, 48, 1813–1822. [DOI] [PubMed] [Google Scholar]
- Bayly C.; Cieplak P.; Cornell W.; Kollman P. A. A Well-behaved Electrostatic Potential Based Method Using Charge Restraints For Deriving Atomic Charges: The RESP Model. J. Phys. Chem. 1993, 97, 10269–10280. [Google Scholar]
- Frisch M.; Trucks G. W.; Schlegel H. B.; Scuseria G. E.; Robb M. A.; Cheeseman J. R. Jr.; Vreven T.; Kudin K. N.; Burant J. C.; Millam J. M.; Iyengar S. S.; Tomasi J.; Barone V.; Mennucci B.; Cossi M.; Scalmani G.; Rega N.; Petersson G. A.; Nakatsuji H.; Hada M.; Ehara M.; Toyota K.; Fukuda R.; Hasegawa J.; Ishida M.; Nakajima T.; Honda Y.; Kitao O.; Nakai H.; Klene M.; Li X.; Knox J. E.; Hratchian H. P.; Cross J. B.; Adamo C.; Jaramillo J.; Gomperts R.; Stratmann R. E.; Yazyev O.; Austin A. J.; Cammi R.; Pomelli C.; Ochterski J. W.; Ayala P. Y.; Morokuma K.; Voth G. A.; Salvador P.; Dannenberg J. J.; Zakrzewski V. G.; Dapprich S.; Daniels A. D.; Strain M. C.; Farkas O.; Malick D. K.; Rabuck A. D.; Raghavachari K.; Foresman J. B.; Ortiz J. V.; Cui Q.; Baboul A. G.; Clifford S.; Cioslowski J.; Stefanov B. B.; Liu G.; Liashenko A.; Piskorz P.; Komaromi I.; Martin R. L.; Fox D. J.; Keith T.; Al-Laham M. A.; Peng C. Y.; Nanayakkara A.; Challacombe M.; Gill P. M. W.; Johnson B.; Chen W.; Wong M. W.; Gonzalez C.; Pople J. A.. Gaussian 03, Revision B. 05; Gaussian Inc.: Pittsburgh, PA, 2003. [Google Scholar]
- Matayoshi E. D.; Wang G. T.; Krafft G. A.; Erickson J. Novel Fluorogenic Substrates for Assaying Retroviral Proteases by Resonance Energy Transfer. Science 1990, 247, 954–958. [DOI] [PubMed] [Google Scholar]
- Morrison J. F. Kinetics of the Reversible Inhibition of Enzyme-Catalysed Reactions by Tight-Binding Inhibitors. Biophys. Acta 1969, 185, 269–286. [DOI] [PubMed] [Google Scholar]
- Greco W. R.; Hakala M. T. Evaluation of Methods for Estimating the Dissociation Constant of Tight Binding Enzyme Inhibitors. J. Biol. Chem. 1979, 254, 12104–12109. [PubMed] [Google Scholar]
- Fleishman S. H.; Brooks C. L. J. Chem. Phys. 1987, 87, 3029–3037. [Google Scholar]
- Hnizdo V.; Gilson M. K. Thermodynamic and Differential Entropy under a Change of Variables. Entropy 2010, 12, 578–590. [DOI] [PMC free article] [PubMed] [Google Scholar]
- Carlsson J.; Aqvist J. Absolute and Relative Entropies from Computer Simulation with Applications to Ligand Binding. J. Phys. Chem. B 2005, 109, 6448–6456. [DOI] [PubMed] [Google Scholar]
- Searle M. S.; Williams D. H. The Cost of Conformational Order: Entropy Changes in Molecular Associations. J. Am. Chem. Soc. 1992, 114, 10690–10697. [Google Scholar]
- Page M. I.; Jencks W. P. Entropic Contributions to Rate Accelerations in Enzymic and Intramolecular Reactions and the Chelate Effect. Proc. Natl. Acad. Sci. U.S.A. 1971, 68, 1678–1683. [DOI] [PMC free article] [PubMed] [Google Scholar]
- Tidor B.; Karplus M. The Contribution of Vibrational Entropy to Molecular Association: The Dimerization of Insulin. J. Mol. Biol. 1994, 238, 405–414. [DOI] [PubMed] [Google Scholar]
- Nalam M. N. L.; Ali A.; Altman M. D.; Reddy G. S. K. K.; Chellappan S.; Kairys V.; Ozen A.; Cao H.; Gilson M. K.; Tidor B.; Rana T. M.; Schiffer C. A. Evaluating the Substrate-Enelope Hypothesis: Strucural Analysis of Novel HIV-1 Protease Inhibitors Designed To Be Robust against Drug Resistance. J. Virol. 2010, 84, 5368–5378. [DOI] [PMC free article] [PubMed] [Google Scholar]
- Diehl C.; Engstrom O.; Delaine T.; Hakansson M.; Genheden S.; Modig K.; Leffler H.; Ryde U.; Nilsson U. J.; Akke M. Protein Flexibility and Conformational Entropy in Ligand Design Targeting the Carbohydrate Recognition Domain of Galectin-3. J. Am. Chem. Soc. 2010, 132, 14577–14589. [DOI] [PMC free article] [PubMed] [Google Scholar]
- Hornak V.; Simmerling C. Targeting Structural Flexibility in HIV-1 Protease Inhibitor Binding. Drug Disc. Today 2007, 12, 132–138. [DOI] [PMC free article] [PubMed] [Google Scholar]
- Chen W.; Chang C.; Gilson M. K. Calculation of Cyclodextrin Binding Affinities: Energy, Entropy, and Implications for Drug Design. Biophys. J. 2004, 87, 3035–3049. [DOI] [PMC free article] [PubMed] [Google Scholar]
- Prabu-Jeyabalan M.; Nalivaika E.; Schiffer C. A. Substrate Shape Determines Specificity of Recognition for HIV-1 Protease: Analysis of Crystal Structures of Six Substrate Complexes. Structure 2002, 10, 369–381. [DOI] [PubMed] [Google Scholar]
- Lui Z.; Wang Y.; Yedidi R. S.; Dewdney T. G.; Reiter S. J.; Brunzelle J. S.; Kovari I. A.; Kovari L. C. Conserved Hydrogen Bonds and Water Molecules in MDR HIV-1 Protease Substrate Complexes. Biochem. Biophys. Res. Commun. 2013, 430, 1022–1027. [DOI] [PMC free article] [PubMed] [Google Scholar]