Abstract
Hydroxyurea (HU) induces fetal hemoglobin synthesis through activation of cyclic guanine monophosphate (cGMP) signaling. Studies in sickle cell patients demonstrated increased circulating nitric oxide (NO) levels after oral HU treatment. However, the direct measurement of NO in erythroid cells and its role in fetal hemoglobin induction have not been defined. Therefore, we quantified the level of nitrate and nitrite (NOx) generated by HU in human erythroid progenitors in the presence of three nitric oxide synthase inhibitors (NOS), including NG-monomethyl-L-arginine (L-NMMA). In addition, cGMP levels were measured in the presence or absence of the pathway inhibitor 1H-(1,2,4)oxadiazolo(4,3-a)quinoxalin-1-one, which blocks soluble guanylyl cyclase formation. HU treatment increased NOx levels and γ-globin transcription in K562 and primary erythroid cells, which was augmented when HU was combined with L-NMMA. Pretreatment with the cGMP pathway inhibitor reversed γ-gene activation by HU. These data demonstrate the direct stimulation of cellular NO and cGMP signaling in erythroid progenitors by HU as a possible mechanism for γ-globin gene activation.
Keywords: hydroxyurea, sickle-cell disease, nitric oxide, fetal hemoglobin, cGMP
Introduction
Hydroxyurea (HU) reduces the rates of vaso-occlusive complications in patients with sickle-cell disease (SCD) (1, 2) by mechanisms not fully understood. Its ability to stimulate fetal hemoglobin (HbF) synthesis is beneficial because it blocks hemoglobin S polymerization. However, clinical improvement in sickle-cell patients has been described independent of HbF induction (1), supporting other mechanisms of action for HU. As a ribonucleotide reductase inhibitor (3), HU blocks DNA synthesis, producing cytotoxicity, rapid erythroid progenitor regeneration, and the continued expression of a fetal program during differentiation (4). In 1998, HU was released by the Food and Drug Administration for the treatment of sickle cell patients. Later, we identified zileutin (ZIL), a clinically relevant HU analog (5), as an HbF inducer (6).
Increased serum levels of NO occur after HU treatment in sickle cell patients (7, 8) and in animal models (9, 10). These data suggest that NO is an effector molecule in HbF induction by HU (11, 12). Nonetheless, to advance this theory, direct measurement of NO levels in erythroid cells is required. Different mechanisms have been proposed for the conversion of HU to NO, including a three-electron oxidation of heme proteins (13–15). HU can also react with hemoglobin to produce nitrosylhemoglobin, nitrite, and nitrate, but this reaction does not account for the rapid increase in serum NO produced in patients taking HU (14).
NO is a free radical that functions as a signaling molecule (16, 17), causing vasodilatation and increased local blood flow. Elevated erythrocyte arginase activity produces a competitive decrease in NO due to the metabolism of L-arginine to L-ornithine and urea (18). Reiter and colleagues (19) demonstrated that NO levels decrease in patients with chronic hemolytic anemia via consumption by free plasma hemoglobin. Experimental data support NO consumption as a mechanism of endothelial dysfunction and vascular instability in sickle cell patients leading to proliferative vasculopathy and pulmonary hypertension (20, 21).
In addition to its role in endothelial function, NO has been implicated in butyrate- and hemin-mediated γ-globin activation through cGMP signaling (11, 12). Yet direct measurement of intracellular NO levels has not been performed. We previously showed that neither L-arginine nor L-NMMA inhibited HbF induction by HU in erythroid progenitors (6). These data suggest HbF induction by HU involves its ability to directly generate intracellular NO independent of NOS activity or alternative mechanisms. Another signaling pathway activated by HU is p38 mitogen-activated protein kinase (22). We recently showed that butyrate and trichostatin A induced HbF via p38 activation by H2O2 (23) but that HU activates p38 through a H2O2-independent mechanism.
In the current study, we developed a system to measure cellular NO levels. A significant increase of NO was observed in K562 and primary erythroid cells treated with HU; when the NOS inhibitor L-NMMA was combined with HU, the NOx levels increased further. Blocking the cGMP pathway with 1H-(1,2,4)oxadiazolo(4,3-a)quinoxalin-1-one (ODQ) inhibited γ-globin activation by HU. These data confirm the ability of HU to directly increase NO levels in erythroid cells and support a possible mechanism for γ-globin gene activation by HU involving the generation of NO and subsequent activation of cGMP signaling.
Materials and Methods
Study Design
We developed a method to directly quantify cellular NO in the form of nitrite and nitrates (NOx) and measured levels in erythroid cells for different drug treatments. In a second set of experiments, we determined the effects the NOS inhibitors on the ability of HU to generate NO or activate γ-globin gene expression. To gain insights into the mechanism of action for the HU analog, zileuton (ZIL), we quantified H2O2 levels using 2′,7′-dichlorodihydrofluorescein diacetate (DCFH-DA) in the presence and absence of myxathiazole (MYX). In the last set of studies, we measured the ability of HU to activate cGMP signaling in the presence of the pathway inhibitor ODQ as a mechanism for γ-globin gene activation.
Tissue Culture
NO levels were measured in K562 erythroleukemia cells, which have γ-globin genes inducible by HU and many other chemical compounds (6, 23). Cells were cultured in Iscove’s Modified Dulbecco’s medium (Invitrogen, Carlsbad, CA) containing 10% fetal bovine serum, 100 U/ml penicillin, and 0.1 mg/ml streptomycin. Drug treatments were completed with 50, 100, 200, and 400 μM HU, ZIL, and detanonoate (DE) or 2 mM butyrate for 2–72 hr; H2O2 was generated with 20 μM menadione (MND) treatment for 2–24 hr as a positive control. L-NMMA (100 μM), NG-nitro-L-arginine (L-NNA; Calbiochem, La Jolla, CA) (100 μM), NG-nitro-L-arginine methyl ester (L-NAME; Tocris Cookson, Ellisville, MO) (200 μM), MYX (10 μM), or ODQ (Calbiochem) (10 μM) were added 30–60 min prior to the drug inducers. HU, butyrate, MYX, and MND were purchased from Sigma (St. Louis, MO); DE from Alexis Biochemicals (San Diego, CA), and ZIL from ChemPacific (Baltimore, MD).
Fluorometry
K562 cells were treated with the various drugs, and total protein was isolated with lysis buffer (Promega, Madison, WI). Nitrates and nitrites levels were measured on a BIO-TEK Fluorometer (Winooski, VT) using a Nitric Oxide Assay Kit (Cat. No. 482655, Calbiochem) following the manufacturer’s instructions. To measure H2O2 levels, 20 μM DCFH-DA (Molecular Probe, Eugene, OR) was added for 2 hr prior to harvesting cells. Fluorescence data were collected at excitation wavelength of 485/20 nm and emission wavelength of 530/35 nm. Protein concentrations were determined by Bradford assay (BioRad, Hercules, CA) per manufacturer’s protocol.
Fluorescent Microscopy
K562 cells were photographed with an Olympus BX 51 phase contrast epifluorescent microscope equipped with Hoffman Modulation optics. Phase-contrast images were recorded with a CCD camera (1/100 sec exposure), and fluorescence images were photographed through 485/20 nm emission and 540/35 nm excitation filters.
Quantitative PCR (qPCR) Analysis
Reverse transcription combined with real-time qPCR analysis was used to measure gene expression levels as previously published (24). Total RNA (1 μg) isolated by RNA Stat-60™ (TEL-TEST “B” Inc., Friendswood, TX) was used to generate cDNA with the Improm-II reverse transcriptase system (Promega, Madison, WI). qPCR reactions were performed with a Sybergreen iQ Supermix (BioRad) and 100 pM each of γ-globin, β-globin, and glyceraldehydes-3-phosphate dehydrogenase (GAPD), gene-specific primers on an iCycler iQ machine (BioRad). Standard curves were generated with serial 10-fold dilutions of Topo7 base plasmids carrying a γ-globin cDNA (Topo7-γ-globin), Topo7-β-globin, or Topo7-GAPD.
Enzyme-Linked Immunosorbent Assay (ELI-SA)
Total hemoglobin was quantified using 20 μl of protein extract from 3 million K562 cells mixed with 5 ml of Drabkin’s reagent (Sigma), and then cyanmethemoglobin was measured at 540 nm. HbF levels were measured using the human Hemoglobin F ELISA Quantitation Kit (Bethyl Laboratory, Montgomery, TX). Briefly, 96-well plates were coated with sheep anti-human HbF antibody (1 mg/ml), and then after blocking with 1% bovine serum albumin, horseradish peroxidase–conjugated secondary antibody (1 mg/ml) was added. Raw data were analyzed in PRISM GraphPad (GraphPad Software, Inc., La Jolla, CA), and HbF levels were calculated as a ratio of total hemoglobin corrected for total protein concentrations for each sample (HbF/total Hb/total protein).
cGMP Immunoassay
cGMP levels were determined using the cGMP Immunoassay Kit (R&D Systems Inc, Minneapolis, MN) following the manufacturer’s instructions. The levels were normalized by total protein in each sample.
Two-Phase Liquid Culture System
Erythroid progenitors were generated using the two-phase liquid cultures system (25) established with buffy coat mono-nuclear cells purchased from Carter BloodCare (Fort Worth, TX). During phase 1, cells were treated with 50 ng/ml each of granulocyte-monocyte colony–stimulating factor, Interleukin-3, and stem cell factor. On day 7 (phase 2), the medium was changed and erythropoietin (2 U/ml) and stem cell factor (50 ng/ml) were added. Cells were treated on day 11 with the various drug inducers for 24, 48, or 72 hr, and then were analyzed by qPCR.
Statistics
The data are reported as the mean ± SEM from at least five data points generated from independent inductions with the different experimental drugs, in parallel with untreated K562 cells. Data were analyzed by Student’s t test and values of P < 0.05 were considered statistically significant. The correlation coefficient was calculated using the Pearson R correlation analysis to determine the relationship between γ-globin mRNA and HbF. Statistical analyses were performed using Microsoft Exel (Kirkland, WA) and SigmaPlot software (Systat Software, Inc., San Jose, CA).
Results
HU Treatment Augments NO in K562 Cells
NO is generated from L-arginine through the action of NOS in eukaryotic cells (Fig. 1). Competition between NOS and arginase for interaction with the common substrate L-arginine determines final intracellular NO levels. The main goal of our study was to directly measure NO levels in erythroid cells after HU treatment and to ascertain whether this molecule plays a role in HbF induction. Studies were also completed with DE (a known NO donor) and ZIL (a 5-lipoxygenase HU analog) to gain insights into signaling molecules involved in γ-globin activation. NOx levels were measured directly using a fluorometry-based kit. We generated a nitrate standard curve from serial dilutions of a stock solution in the linear range from 1.0 μM to 5.0 μM.
Figure 1.
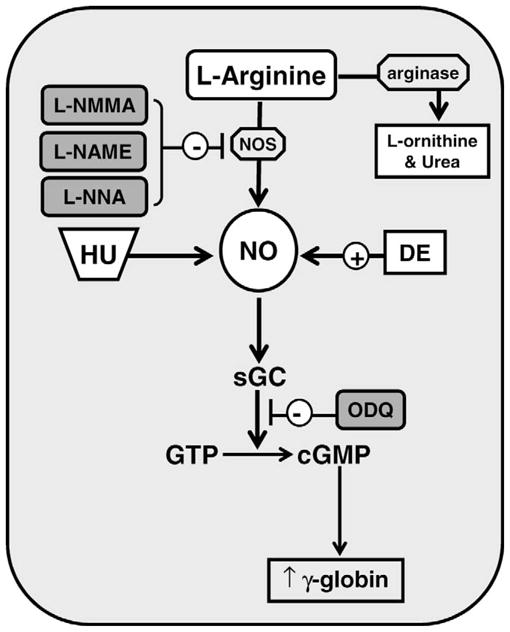
Mechanisms for γ-globin gene activation via NO signaling. Shown is a model of how hydroxyurea (HU) and detanonoate (DE) act as nitric oxide (NO) donors. The level of γ-globin transcription is increased by cyclic guanosine monophosphate (cGMP) signaling triggered by the conversion of guanosine triphosphate (GTP) to cGMP by soluble guanosine cyclase (sGC). Nitric oxide synthase (NOS) inhibitors NG-monomethyl-L-arginine (L-NMMA), NG-nitro-L-arginine methyl ester (L-NAME), and NG-nitro-L-arginine (L-NNA) are shown in gray along with the sGC inhibitor 1H-(1,2,4)oxadiazolo(4,3-a)quinoxalin-1-one (ODQ).
NO was not detected in culture media alone in our system. Shown in Figure 2A–D are the NOx levels generated under the different experimental conditions. A dose-dependent increase in NOx was produced by DE treatment for 4 hr, which reached a significance 1.3-fold and 1.7-fold increase (P < 0.05) at 200 μM and 400 μM concentrations, respectively (Fig. 2A); by 24 hr, NOx levels increased 2.0-fold at 400 μM. These data demonstrated that NOx increased over a narrow but significant range after treatment with DE. We observed a maximal 1.6-fold increase in NO after HU treatment for 24 hr (Fig. 2B). However, neither ZIL (100–400 μM) nor 2 mM butyrate increased NO levels significantly (Fig. 2C and 2D).
Figure 2.
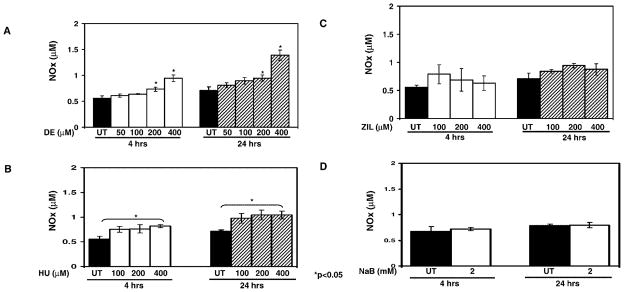
NOx levels are increased by HU treatment. (A) Shown are the NOx levels for untreated (UT) K562 cells and cells treated with increasing concentrations of DE. Raw data are shown as the mean ± SEM. The asterisks (*) above the bar graphs indicate that the difference between the UT and drug-treated cells was significant at the values indicated. (B) K562 cells were treated with increasing HU concentrations and analyzed as described in panel A. (C) K562 cells were treated with ZIL and analyzed as described in panel A. (D) K562 cells were treated with 2 mM sodium butyrate (NaB) for 4 and 24 hr, and NOx levels were quantified.
HU Generates NO Independent of NOS Activity
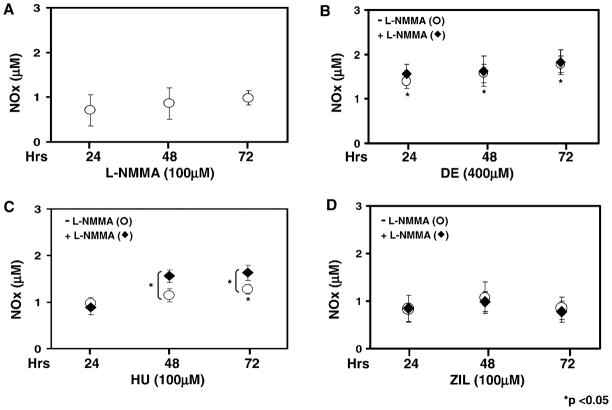
NOS is required for the metabolism of L-arginine to NO and citrulline (Fig. 1). However, this reaction can be altered by the competitive activity of arginase (26). Three NOS isozymes exist, including neural and endothelial NOS, which are regulated by intracellular free Ca+2 (27, 28). When K562 cells were treated with L-NMMA, endogenous NOx levels were not altered significantly (Fig. 3A). Similar experiments were completed with DE, HU, and ZIL alone or after L-NMMA pretreatment. L-NMMA pretreatment did not alter the 1.8-fold increase in NOx levels produced by DE at 72 hr (Fig. 3B). Treatment with HU produced a significant increase in NOx by 48 hr, which was sustained at 72 hr (Fig. 3C). Moreover, when HU was combined with L-NMMA, the level of NOx was significantly higher than values obtained for HU alone at both time points (P < 0.05). In contrast, NOx levels produced by ZIL were not altered by L-NMMA pretreatment (Fig. 3D). The inability of ZIL to generate NO supports our previous observation that this compound activates γ-globin by a different mechanism than HU (6).
Figure 3.
Pretreatment with L-NMMA augments the ability of HU to generate NO. (A) K562 cells were treated with L-NMMA and NOx levels were measured (see Materials and Methods). (B–D) In each panel is shown respectively the raw data for K562 cells treated with DE, HU, or ZIL. Data collected for drug treatment alone (○) or after pretreatment with 100 μM L-NMMA for 30 min (◆) at 24, 48, and 72 hr are shown in each graph. In panel C, the bracket and asterisk (*) indicate that the NOx levels produced when HU was combined with L-NMMA were significantly higher (P < 0.05) than levels produced by HU treatment alone.
Studies were also performed with two additional NOS inhibitors: L-NAME and L-NNA. Neither of these agents increased NOx levels above the 0.5 μM NOx level observed at baseline when used alone; when L-NAME and L-NNA were combined with HU, NOx levels did not increase above the 0.98 μM level generated by HU alone. The data generated by L-NMMA suggest that HU may act as a NO donor through a novel mechanism.
Combined HU and L-NMMA Treatments Stimulates γ-Globin Gene Transcription
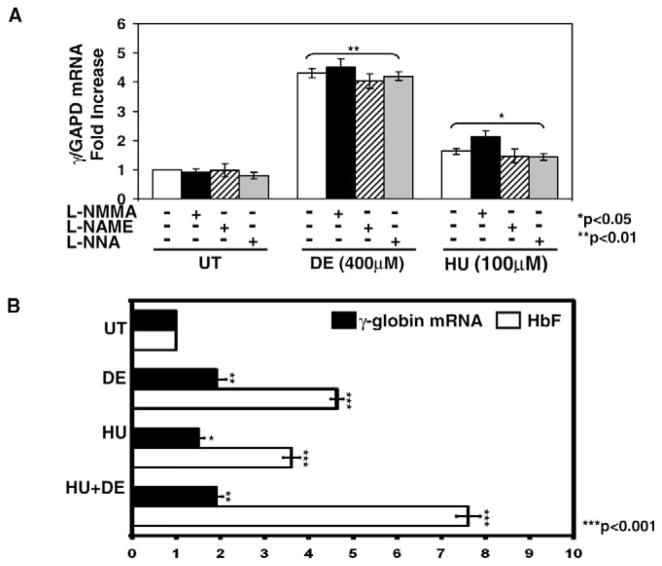
To investigate the ability of HU to induce γ-globin by generating NO independent of NOS, we measured gene expression in the presence or absence of NOS inhibitors. Treatment with the three NOS inhibitors alone for 72 hr did not significantly alter γ-globin expression (Fig. 4A). Treatment with DE increased γ-globin transcription 4.3-fold (P < 0.01). However, combined treatment with L-NMMA did not augment γ-globin mRNA synthesis further. In contrast, combining HU and L-NMMA augmented γ-globin mRNA 0.5-fold (P < 0.05) compared with levels for HU alone (Fig. 4A). L-NMMA was the only NOS inhibitor that augmented γ-gene expression when combined with HU.
Figure 4.
Enhanced HbF synthesis was observed with combined drug treatment. (A) K562 cells were treated with 100 μM L-NMMA), 200 μM L-NAME or 100 μM L-NNA alone or combined with DE or HU for 72 hr. The γGAPD mRNA ratios in UT cells were normalized to one. The bracket and asterisks (* or **) above the graph indicate that all values are significantly different from the corresponding UT values. (B) K562 cells were cultured in DE or HU alone or combined for 72 hr and then mRNA levels were quantified by qPCR and HbF levels by ELISA (see Materials and Methods). The HbF levels were normalized to total hemoglobin and total protein, and levels in UT K562 cells were normalized to one
We next completed studies to determine if combining HU with DE could augment γ-globin expression, since they appear to generate NO by different mechanisms. We observed γ-globin gene activation by DE and HU. However, combination treatment did not increase mRNA levels further (Fig. 4B). In contrast, HbF synthesis increased 7.6-fold (P < 0.001) when HU was combined with DE compared with a 4.6-fold and 3.6-fold increase in HbF produced by DE and HU alone, respectively. Furthermore, we observed a positive correlation between γ-globin mRNA synthesis and HbF levels (r2 = 0.8026; P < 0.05) for the different experimental conditions. Augmented HbF synthesis without a similar effect in γ-globin transcription suggests changes in mRNA stability. This mechanism was previously demonstrated for rapid HbF induction after arginine butyrate treatment in sickle cell patients (29).
HU Generates NO in Primary Erythroid Cells
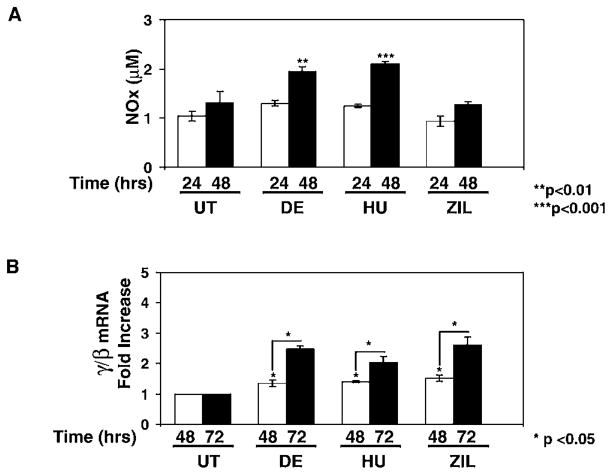
We next determined if HU generates NO in normal human erythroid progenitors. Cells grown in a primary liquid culture system were treated with HU (30 μM), ZIL (30 μM), or DE (100 μM) for 24–72 hr. Drug concentrations were decreased to avoid cell toxicity and the inhibition of burst-forming unit erythroid colony growth. HU treatment increased NOx levels 2.1-fold (P < 0.001) at 48 hr (Fig. 5A), which was comparable with levels produced by DE (1.9-fold; P < 0.01), but NO was not generated by ZIL. At 72 hr of treatment, we observed a 2.5-fold and 2.0-fold increase in the γ/β ratio by HU and DE, respectively (Fig. 5B); ZIL also increased the γ/β globin ratio 2.6-fold. The β/GAPD levels were altered 0.8-fold to 1.3-fold by the various drug treatments, which was not statistically significant. These data confirmed that the increase in γ/β-globin ratio was due to γ-globin gene activation rather than β-globin silencing. We concluded from these studies that γ-globin activation by HU occurred simultaneously with the generation of NO in primary cells but that ZIL induced γ-globin by a NO-independent mechanism.
Figure 5.
HU generates NO in primary erythroid progenitors. Buffy coats peripheral blood mononuclear cells were grown in a two-phase liquid culture system (see Materials and Methods). Drug inductions were completed on day 11 for 24, 48, or 72 hr. (A) Shown are the raw data for NOx levels after 200 μM DE, 30 μM HU, or 30 μM ZIL treatment. (B) The γ-globin and β-globin mRNA levels were quantified by qPCR and then each value was normalized by GAPD. Shown in the graph is the fold increase in γ/β-globin mRNA ratio after correction by GAPD. The line and asterisk (*) indicate that the difference between the 48 and 72 hr γ/β-globin ratios was significant at P < 0.05.
ZIL Induces γ-Globin by H2O2 Formation in K562 Cells
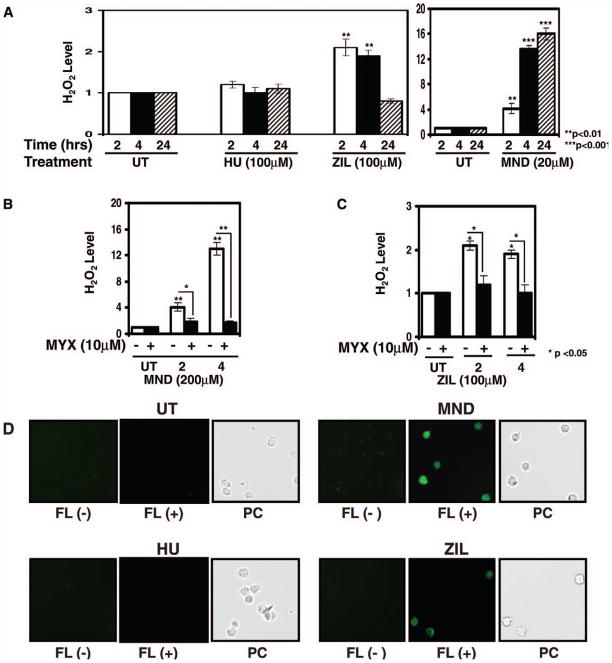
To address other possible mechanisms for HbF induction by ZIL, we investigated H2O2, which also activates cGMP signaling (30). We asked the question whether ZIL could generate H2O2 to induce γ-globin activation. Thus, H2O2 levels were quantified by a DCFH-DA fluorescence assay previously established in our laboratory (23). Controls studies with MND, a known H2O2 inducer (31), produced a 16-fold (P < 0.001) increase in H2O2 formation at 24 hr, compared with levels observed in untreated K562 cells (Fig. 6A). ZIL significantly increased H2O2 at 2 and 4 hr, compared with levels obtained at the same time points for untreated cells, and then returned to baseline levels at 24 hr (Fig. 6A). In contrast, HU did not increase H2O2 significantly at any time point (Fig. 6A).
Figure 6.
Zileuton generates H2O2 in K562 cells. (A) DCFH-DA fluorescence data as a measure of H2O2 generated in K562 cells are shown. Cells were treated for 2, 4, and 24 hr with HU, ZIL, or menadione (MND); DCFH-DA (20 μM) was added for 2–4 hr before cells were harvested and analyzed by fluorometry. At each time point, H2O2 levels in untreated (UT) K562 cells were normalized to one. H2O2 levels for the different treatments are shown as the fold increase compared with UT K562 cells at each time point. (B) Cells were treated with MND for 2 and 4 hr in the absence (−) or presence (+) of myxothiazole (MYX) for 30 min, respectively. (C) Cells were treated with ZIL for 2 and 4 hr and analyzed as described in panels A and B. (D) Shown are photomicrographs of the fluorescence produced by drug inducers at 2 hr. Photomicrographs of cells in the absence (−) or presence (+) of DCFH-DA are shown. The corresponding phase contrast (PC) images are shown. A color version is available in the online journal.
To confirm that ZIL induced H2O2 formation, we pretreated K562 cells with 10 μM MYX, an agent that prevents the formation of H2O2. MYX treatment alone had no effect, yet this agent blocked H2O2 produced by MND up to 87% (Fig. 6B). ZIL-mediated H2O2 generation was inhibited 38% (P < 0.05) by MYX at 2 and 4 hr (Fig. 6C). Fluorescence photomicrographs were taken in the absence or presence of DCFH-DA (Fig. 6D); auto-fluorescence was not detected in untreated K562 cells. We observed increased fluorescence in the MND- and ZIL-treated cells, in contrast to HU, in which no fluorescence positive cells were observed. In K562 cells treated with ZIL, γ-globin mRNA increased 2.3-fold (P < 0.05), which was inhibited 50% by MYX pretreatment as well. These data suggest that ZIL induced γ-globin through a H2O2-mediated signaling mechanism.
cGMP Signaling Contributes to the Ability of L-NMMA to Augment γ-Globin Induction by HU
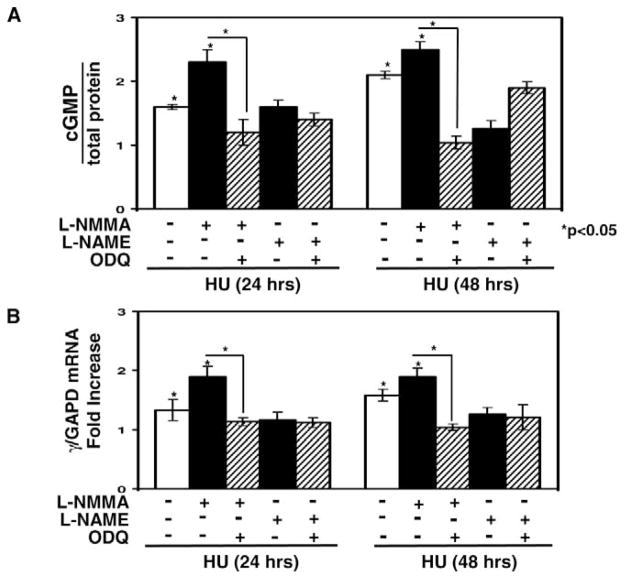
We speculated that augmented NO levels produced by combining L-NMMA with HU might stimulate γ-globin transcription via cGMP signaling. To test this hypothesis, we measured cGMP activation and γ-globin transcription in K562 cells in the presence of the pathway inhibitor ODQ. At 24 hr, cGMP levels were increased 1.6-fold by HU versus 2.3-fold when combined with L-NMMA (Fig. 7A); pretreatment with ODQ dampened cGMP accumulation significantly by 45% (P < 0.05). By 48 hr, cGMP levels were increased further by HU alone to 2.1-fold, and the effect of L-NMMA was sustained. In contrast, a second NOS inhibitor L-NAME, failed to augment the effects of HU. Combined L-NMMA and DE treatment did not augment cGMP levels as was observed for HU (data not shown).
Figure 7.
L-NMMA augmented γ-globin transcription when combined with HU through cGMP signaling. (A) cGMP levels were measured using an immunoassay and normalized by total protein (see Materials and Methods). Shown are levels in K562 cells treated with either 100 μM HU alone or combined with L-NMMA (200 μM) or L-NAME (200 μM) in the presence or absence of ODQ (10μM). (B) The effect on γ-globin transcription was quantified by qPCR in K562 cells grown under the same experimental conditions as panel A. Shown are changes in the γ/GAPD mRNA ratios.
We also analyzed γ-globin transcription under the same experimental conditions. The combination of L-NMMA and HU produced an additive 1.9-fold increase in γ-gene mRNA compared with a 1.3-fold increase by HU alone (Fig. 7B). Pretreatment with ODQ inhibited γ-globin activation, which is consistent with the cGMP data. The ability of L-NMMA to augment γ-gene transcription persisted at 48 hr. In contrast, the 4.3-fold increase in γ-globin transcription produced by DE was not augmented by L-NMMA. These data are consistent with a mechanism whereby combined HU and L-NMMA treatment produces an additive effect on γ-globin transcription in part by the generation of NO and cGMP signaling.
Discussion
Recent reports suggest that NO contributes to the ability of HU to induce erythroid differentiation and HbF synthesis (11, 32), which is supported by our findings. Cokic et al recently demonstrated the ability of HU to increase cGMP levels through nitrosylation of soluble guanylyl cyclase in human erythroid progenitors (33). However, to date direct quantification of NO levels in erythroid cells has not been performed. Experimental data suggest that combining HU with powerful NO donors may have a dual effect of HbF induction and restoration of vascular tone as an effective treatment for pulmonary hypertension in sickle cell patients (32). Our in vitro ELISA data for combined HU and DE treatment support this notion. A phase I clinical trial was recently completed to evaluate the efficacy of HU combined with L-arginine or sildenafil to treat pulmonary hypertension in sickle cell patients (34). The goals of the study were to determine the effectiveness of combined treatment on HbF induction and lowering pulmonary blood pressure. The study outcome is pending.
We developed a system to directly quantify NO to confirm intracellular NO generation after HU treatment in K562 cells and primary erythroid progenitors. Furthermore, γ-globin gene induction by HU occurred after the generation of NO and cGMP signaling, suggesting that the two events may be linked. However, the exact role of NO in HU-mediated HbF induction remains to be elucidated. Our findings also support a novel NOS-independent mechanism whereby L-NMMA enhances the ability of HU to generate NO.
L-NMMA is an inhibitor of both endothelial and inducible NOS isoforms (35), which metabolize L-arginine through a specific binding site. Interestingly, in K562 cells treated with L-NMMA and HU, both NO levels and γ-globin gene transcription were augmented. We speculate that blockade of arginine metabolism in the presence of L-NMMA may allow a greater rate of conversion of HU to NO (Fig. 1). This effect was only observed for L-NMMA compared with the other NOS inhibitors, which may reflect differences in specificity of the different isoforms (36). Also likely, other undefined mechanisms may account for the unique ability of L-NMMA to augment HU-mediated NO generation.
Findings by Iyamu et al (37) that HU may regulate arginase and NOS activity in vivo provide another possible mechanism for the interaction between HU and L-NMMA. Arginase is an enzyme that limits NO production by depleting NOS substrate. Iyamu and colleagues demonstrated that HU-treated sickle cell patients have increased NOS levels and reduced arginase activity, which produces a rapid increase in serum NO levels. These observations suggest that HU increases NO levels by at least two mechanisms including a direct conversion of HU to NO by heme iron or, indirect conversion by modulating NOS activity. This interpretation does not exclude other mechanisms by which L-NMMA augments the effects of HU independent of NOS activity.
Our laboratory and others demonstrated the ability of butyrate and Trichostatin A to activate p38 MAPK to induce γ-globin expression (22, 38, 39). We recently showed that p38 was activated by the formation of H2O2 (23) and subsequent phosphorylation of CREB and ATF-2 to augment γ-gene transcription (24). Interestingly, HU activated γ-globin via a p38-dependent mechanism but independent of H2O2 formation. In this study, ZIL stimulated H2O2 production as an alternative mechanism of γ-globin induction. These data also illustrate the importance of chemical composition in drug function, because ZIL is a closely related structural analog of HU.
We confirmed that HU treatment directly generates NO in erythroid cells and that HU combined with DE produced an additive increase in HbF synthesis. Of interest is the finding that the NO donor DE is a potent inducer of γ-globin in vitro and superior to HU in its ability to generate NO. The ability of the NOS inhibitor, L-NMMA to selectively augment γ-globin gene induction by HU requires further investigation to clarify the exact mechanism involved. These findings have important implications for research efforts to develop new HbF inducers or combination drug therapy for patients with SCD.
Acknowledgments
This research was supported by grant HL69234 from the National Heart, Lung, and Blood Institute to Betty Pace, MD and state funding of the Center for Applied Biology at the University of Texas at Dallas.
References
- 1.Charache S, Terrin ML, Moore RD, Dover GJ, Barton FB, Eckert SV, McMahon RP, Bonds DR. Effect of hydroxyurea on the frequency of painful crises in sickle cell anemia: investigators of the Multicenter Study of Hydroxyurea in Sickle Cell Anemia. N Engl J Med. 1995;332:1317–1322. doi: 10.1056/NEJM199505183322001. [DOI] [PubMed] [Google Scholar]
- 2.Heeney MM, Ware RE. Hydroxyurea for children with sickle cell disease. Pediatr Clin North Am. 2008;55:483–501. doi: 10.1016/j.pcl.2008.02.003. [DOI] [PubMed] [Google Scholar]
- 3.Yarbro JW. Mechanism of action of hydroxyurea. Semin Oncol. 1992;19:1–10. [PubMed] [Google Scholar]
- 4.Stamatoyannopoulos G, Veith R, al-Khatti A, Papayannopoulou T. Induction of fetal hemoglobin by cell-cycle-specific drugs and recombinant erythropoietin. Am J Pediatr Hematol Oncol. 1990;12:21–26. doi: 10.1097/00043426-199021000-00005. [DOI] [PubMed] [Google Scholar]
- 5.Bell RL, Young PR, Albert D, Lanni C, Summers JB, Brooks DW, Rubin P, Carter GW. The discovery and development of zileuton: an orally active 5-lipoxygenase inhibitor. Int J Immunopharmacol. 1992;14:505–510. doi: 10.1016/0192-0561(92)90182-k. [DOI] [PubMed] [Google Scholar]
- 6.Haynes J, Jr, Baliga BS, Obiako B, Ofori-Acquah S, Pace B. Zileuton induces hemoglobin F synthesis in erythroid progenitors: role of the L-arginine-nitric oxide signaling pathway. Blood. 2004;103:3945–3950. doi: 10.1182/blood-2003-08-2969. [DOI] [PubMed] [Google Scholar]
- 7.King SB. Nitric oxide production from hydroxyurea. Free Radic Biol Med. 2004;37:737–744. doi: 10.1016/j.freeradbiomed.2004.02.073. [DOI] [PubMed] [Google Scholar]
- 8.Gladwin MT, Shelhamer JH, Ognibene FP, Pease-Fye ME, Nichols JS, Link B, Patel DB, Jankowski MA, Pannell LK, Schechter AN, Rodgers GP. Nitric oxide donor properties of hydroxyurea in patients with sickle cell disease. Br J Haematol. 2002;116:436–444. doi: 10.1046/j.1365-2141.2002.03274.x. [DOI] [PubMed] [Google Scholar]
- 9.Huang J, Yakubu M, Kim-Shapiro DB, King SB. Rat liver-mediated metabolism of hydroxyurea to nitric oxide. Free Radic Biol Med. 2006;40:1675–1681. doi: 10.1016/j.freeradbiomed.2006.01.002. [DOI] [PubMed] [Google Scholar]
- 10.Jiang J, Jordan S, Barr D, Gunther MR, Maeda H, Mason RP. In vivo production of nitric oxide in rats after administration of hydroxyurea. Mol Pharm. 1997;52:1081–1086. doi: 10.1124/mol.52.6.1081. [DOI] [PubMed] [Google Scholar]
- 11.Cokic VP, Smith RD, Beleslin-Cokic BB, Njoroge JM, Miller JL, Gladwin MT, Schechter AN. Hydroxyurea induces fetal hemoglobin by the nitric oxide-dependent activation of soluble guanylyl cyclase. J Clin Investm. 2003;111:231–239. doi: 10.1172/JCI16672. [DOI] [PMC free article] [PubMed] [Google Scholar]
- 12.King SB. A role for nitric oxide in hydroxyurea-mediated fetal hemoglobin induction. J Clin Invest. 2003;111:171–172. doi: 10.1172/JCI17597. [DOI] [PMC free article] [PubMed] [Google Scholar]
- 13.King SB. Mechanisms and novel directions in the biological applications of nitric oxide donors. Free Rad Biol Med. 2004;37:735–736. doi: 10.1016/j.freeradbiomed.2004.01.013. [DOI] [PubMed] [Google Scholar]
- 14.King SB. Nitric oxide production from hydroxyurea. Free Radic Biol Med. 2004;37:737–744. doi: 10.1016/j.freeradbiomed.2004.02.073. [DOI] [PubMed] [Google Scholar]
- 15.Pacelli R, Taira J, Cook JA, Wink DA, Krishna MC. Hydroxyurea reacts with heme proteins to generate nitric oxide. Lancet. 1996;347:900. doi: 10.1016/s0140-6736(96)91378-1. [DOI] [PubMed] [Google Scholar]
- 16.Thippeswamy T, McKay JS, Quinn JP, Morris R. Nitric oxide, a biological double-faced janus is this good or bad? Histol Histopatho. 2006;21:445–458. doi: 10.14670/HH-21.445. [DOI] [PubMed] [Google Scholar]
- 17.Tuteja N, Chandra M, Tuteja R, Misra MK. Nitric oxide as a unique bioactive signaling messenger in physiology and pathophysiology. J Biomed Biotech. 2004;2004:227–237. doi: 10.1155/S1110724304402034. [DOI] [PMC free article] [PubMed] [Google Scholar]
- 18.Boucher JL, Moali C, Tenu JP. Nitric oxide biosynthesis, nitric oxide synthase inhibitors and arginase competition for L-arginine utilization. Cell Mol Life Sci. 1999;55:1015–1028. doi: 10.1007/s000180050352. [DOI] [PMC free article] [PubMed] [Google Scholar]
- 19.Reiter CD, Wang X, Tanus-Santos JE, Hogg N, Cannon RO, III, Schechter AN. Cell-free hemoglobin limits nitric oxide bioavailability in sickle-cell disease. Nat Med. 2002;8:1383–1389. doi: 10.1038/nm1202-799. [DOI] [PubMed] [Google Scholar]
- 20.Morris CR, Gladwin MT, Kato GJ. Nitric oxide and arginine dysregulation: a novel pathway to pulmonary hypertension in hemolytic disorders. Curr Mol Med. 2008;8:620–632. doi: 10.2174/156652408786241447. [DOI] [PMC free article] [PubMed] [Google Scholar]
- 21.Hsu LL, Champion HC, Campbell-Lee SA, Bivalacqua TJ, Manci EA, Diwan BA, Schimel DM, Cochard AE, Wang X, Schechter AN, Noguchi CT, Gladwin MT. Hemolysis in sickle cell mice causes pulmonary hypertension due to global impairment in nitric oxide bioavailability. Blood. 2007;109:3088–3098. doi: 10.1182/blood-2006-08-039438. [DOI] [PMC free article] [PubMed] [Google Scholar]
- 22.Park JI, Choi HS, Jeong JS, Han JY, Kim IH. Involvement of p38 kinase in hydroxyurea-induced differentiation of K562 cells. Cell Growth Differ. 2001;12:481–486. [PubMed] [Google Scholar]
- 23.Hsiao CH, Li W, Lou TF, Baliga BS, Pace BS. Fetal hemoglobin induction by histone deacetylase inhibitors involves generation of reactive oxygen species. Exp Hematol. 2006;34:264–273. doi: 10.1016/j.exphem.2005.12.009. [DOI] [PubMed] [Google Scholar]
- 24.Sangerman J, Lee MS, Yao X, Oteng R, Zein S, Ofori-Acquah S, Pace BS. Mechanisms for fetal hemoglobin induction by histone deacetylase inhibitors involve γ-globin activation by CREB1 and ATF-2. Blood. 2006;108:3590–3599. doi: 10.1182/blood-2006-01-023713. [DOI] [PMC free article] [PubMed] [Google Scholar]
- 25.Fibach E. Cell culture and animal models to screen for promising fetal hemoglobin-stimulating compounds. Semin Hematol. 2001;38:374–381. doi: 10.1016/s0037-1963(01)90032-0. [DOI] [PubMed] [Google Scholar]
- 26.Hey C, Boucher JL, Vadon-Le Goff S, Ketterer G, Wessler I, Racké K. Inhibition of arginase in rat and rabbit alveolar macrophages by N-hydroxy-D,L-indospicine, effects on L-arginine utilization by nitric oxide synthase. Br J Clin Pharmacol. 1997;121:395–400. doi: 10.1038/sj.bjp.0701143. [DOI] [PMC free article] [PubMed] [Google Scholar]
- 27.Huang PL, Fishman MC. Genetic analysis of nitric oxide synthase isoforms: targeted mutation in mice. J Mol Med. 1996;74:415–421. doi: 10.1007/BF00217517. [DOI] [PubMed] [Google Scholar]
- 28.Moncada S, Higgs EA. Endogenous nitric oxide: physiology, pathology and clinical relevance. Eur J Clin Invest. 1991;21:361–374. doi: 10.1111/j.1365-2362.1991.tb01383.x. [DOI] [PubMed] [Google Scholar]
- 29.Weinberg RS, Ji X, Sutton M, Perrine S, Galperin Y, Li Q, Liebhaber SA, Stamatoyannopoulos G, Atweh G. Butyrate increases the efficiency of translation of gamma-globin mRNA. Blood. 2005;105:1807–1809. doi: 10.1182/blood-2004-02-0454. [DOI] [PMC free article] [PubMed] [Google Scholar]
- 30.Mittal CK, Murad F. Activation of guanylate cyclase by superoxide dismutase and hydroxyl radical: a physiological regulator of guanosine 3′,5′-monophosphate formation. Proc Natl Acad Sci USA. 1977;74:4360–4364. doi: 10.1073/pnas.74.10.4360. [DOI] [PMC free article] [PubMed] [Google Scholar]
- 31.Goldberg B, Stern A. Production of superoxide anion during the oxidation of hemoglobin by menadione. Biochim Biophys Acta. 1976;437:628–632. doi: 10.1016/0304-4165(76)90029-5. [DOI] [PubMed] [Google Scholar]
- 32.Kato GJ, Gladwin MT. Evolution of novel small-molecule therapeutics targeting sickle cell vasculopathy. JAMA. 2008;300:2638–2646. doi: 10.1001/jama.2008.598. [DOI] [PMC free article] [PubMed] [Google Scholar]
- 33.Cokic VP, Andric SA, Stojilkovic SS, Noguchi CT, Schechter AN. Hydroxyurea nitrosylates and activates soluble guanylyl cyclase in human erythroid cells. Blood. 2008;111:1117–1123. doi: 10.1182/blood-2007-05-088732. [DOI] [PMC free article] [PubMed] [Google Scholar]
- 34.National Institutes of Health Clinical Center. [Accessed April 14, 2009];Evaluation of hydroxyurea plus L-arginine or sildenafil to treat sickle cell anemia. Available at: http://clinicaltrials.gov/ct2/show/NCT00056433.
- 35.Vallance P, Collier J, Moncada S. Effects of endothelium-derived nitric oxide on peripheral arteriolar tone in man. Lancet. 1989;2:997–1000. doi: 10.1016/s0140-6736(89)91013-1. [DOI] [PubMed] [Google Scholar]
- 36.Rivier C. Role of nitric oxide and carbon monoxide in modulating the ACTH response to immune and nonimmune signals. Neuroimmunomod. 1998;5:203–213. doi: 10.1159/000026338. [DOI] [PubMed] [Google Scholar]
- 37.Iyamu EW, Cecil R, Parkin L, Woods G, Ohene-Frempong K, Asakura T. Modulation of erythrocyte arginase activity in sickle cell disease patients during hydroxyurea therapy. Br J Haematol. 2005;131:389–394. doi: 10.1111/j.1365-2141.2005.05772.x. [DOI] [PubMed] [Google Scholar]
- 38.Pace BS, Qian XH, Sangerman J, Ofori-Acquah SF, Baliga BS, Han J, Critz SD. p38 MAP kinase activation mediates gamma-globin gene induction in erythroid progenitors. Exp Hematol. 2003;31:1089–1096. doi: 10.1016/s0301-472x(03)00235-2. [DOI] [PubMed] [Google Scholar]
- 39.Witt O, Sand K, Pekrun A. Butyrate-induced erythroid differentiation of human K562 leukemia cells involves inhibition of ERK and activation of p38 MAP kinase pathways. Blood. 2000;95:2391–2396. [PubMed] [Google Scholar]


