

Abstract
Metabolic labeling of cells using heavy amino acids is most commonly used for relative quantitation; however, partner mass shifts also detail the number of heavy amino acids contained within the precursor species. Here, we use a recently developed metabolic labeling technique, NeuCode (neutron encoding) stable isotope labeling with amino acids in cell culture (SILAC), which produces precursor partners spaced ~40 mDa apart to enable amino acid counting. We implement large scale counting of amino acids through a program, “Amino Acid Counter”, which determines the most likely combination of amino acids within a precursor based on NeuCode SILAC partner spacing and filters candidate peptide sequences during a database search using this information. Counting the number of lysine residues for precursors selected for MS/MS decreases the median number of candidate sequences from 44 to 14 as compared to an accurate mass search alone (20 ppm). Furthermore, the ability to co-isolate and fragment NeuCode SILAC partners enables counting of lysines in product ions, and when the information is used, the median number of candidates is reduced to 7. We then demonstrate counting leucine in addition to lysine results in a 6-fold decrease in search space, 43 to 7, when compared to an accurate mass search. We use this scheme to analyze a nanoLC-MS/MS experiment and demonstrate that accurate mass plus lysine and leucine counting reduces the number of candidate sequences to one for ~20% of all precursors selected, demonstrating an ability to identify precursors without MS/MS analysis.
Shotgun proteomic analysis by mass spectrometry (MS) relies on selection of peptide precursor ions of interest from a survey scan (MS1) followed by dissociation and product ion analysis (i.e., tandem MS, MS/MS).1 Tens of thousands of MS/MS spectra are then searched against an in-silico database of predicted spectra generated by an in-silico digest of the proteome in question to produce a peptide sequence match.2–7 Regardless of acquisition strategy, the precursor peptide sequence is primarily determined from the product ions within the MS2 spectrum, while the MS1 is used to determine the precursor mass to narrow the possible peptide matches from the in-silico proteome digest.8–10 A trend in MS instrumentation has increased MS/MS data acquisition rates from 1 Hz several years ago to as much as 10 Hz today.11–14 With this boosted sampling rate have come increasingly deeper proteome coverage proteome with more and more peptides identified with each newer, i.e., faster, generation of instruments. We reason that if some fraction of peptide precursors did not require MS/MS scanning to generate sequence identification, the bandwidth limited MS/MS scans could be allocated to only those precursor candidates whose sequence cannot be deduced by accurate mass alone.
Many researchers have examined the use of accurate mass to determine peptide sequence.15–21 Even with ±1 ppm mass accuracy, only peptides smaller than 700–800 Da can be unambiguously identified by mass alone.22 From this body of work, we conclude that other information must be obtained if we wish to avoid tandem MS for even a modest fraction of precursors. A decade ago, Stephenson et al. described the use of isoelectric focusing with accurate mass for peptide identification.23 This method, however, required knowledge of precursor isoelectric point, information that is not typically available for all proteomic applications. Many modern proteomic experiments often utilize heavy amino acids for quantitative purpose, e.g., stable isotope labeling with amino acids in cell culture (SILAC).24,25 MS1 spectra contain more information than just precursor mass. Specifically, the mass shift imparted by the incorporation of heavy amino acids, typically 4–10 Da, discloses the number of heavy amino acids contained in the peptide and, therefore, the exact number of the labeled residues present in that particular peptide.
Amino acid counting was used with high mass accuracy Fourier transform ion cyclotron resonance (FTICR)26–28 mass spectrometry to aid in whole protein identification using a variety of heavy amino acids including leucine, lysine, arginine, histidine, phenylalanine, and cysteine.29–33 Furthermore, peptide mass fingerprinting techniques demonstrated an ability to identify proteins by accurate mass of peptides and amino acid content determined by counting isotopically labeled amino acids.34–36 This technique was expanded to peptide sequence analysis where mass shifts in the MS1 used to determine amino acid content and add confidence to peptide identifications, as well as infer peptide modifications.37–40 Amino acid counting has also been used to improve de novo sequencing by analyzing induced mass shifts in MS2 spectra.41–43 More recently, amino acid counting has been employed prior to database search of peptides to limit the number of peptides considered based on the number of lysines and/or arginine residues in addition to accurate mass.21 Obviously, increasing the number of labeled amino acids increases the informing power and the likelihood that a single peptide sequence can be mapped to a precursor m/z peak. A considerable limitation of the traditional SILAC approach is that adding many distinct heavy amino acids can rapidly increase MS1 spectral complexity, using labeled amino acids with relatively large partner mass shifts (4–10 Da).44 These large spacings, which are necessary to limit isotopic envelope overlap, increase MS1 spectral complexity, limit the number of precursors that can be selected in a typical LC-MS/MS analysis, and decrease overall protein identifications.45
We have recently described a novel metabolic labeling strategy termed neutron encoding (NeuCode) that exploits the discrepancy of neutron binding energetics between isotopes of C, N, and H.46 NeuCode utilizes isotopologues of amino acids that differ in mass by as little as 6 mDa and as much as ~40 mDa. These small mass differences are not detectable at mass resolutions lower than ~100 000 but are revealed under ultrahigh resolution analysis that is achievable on modern FT-MS systems, including the Orbitrap analyzer.12,14,47–51 Reducing partner spacing from 4–10 Da to <40 mDa with NeuCode SILAC compresses the various precursor species in m/z space, space so small that only one form of the peptide is detected under typical mass resolution conditions. This approach lowers the number of precursor species in MS1 spectra, eliminates redundant sampling of peptide partners, increases overall protein identifications, and enables amino acid counting with multiple labeled amino acids.46
Here, we explore the use of NeuCode SILAC to map peptide mass-to-charge (m/z) signals to peptide sequence without need for MS/MS analysis. A major benefit of the proposed methodology is derived from the use of NeuCode where very small mass differences permit us to use multiple amino acids, which greatly improve identification specificity with no complication of the MS1 spectra. Using theoretical calculations, we determined that accurate mass measurement of the intact precursor, and knowledge of the number of Leu and Lys residues it contains (via NeuCode SILAC), would provide sufficient information to map the precursor to sequence half of the time (51%). With these enticing theoretical results, we tested this idea experimentally. We developed custom software, AminoAcidCounter, and demonstrate the application of amino acid counting significantly reduces the number candidate sequences more than 3-fold for lysine and 6-fold for lysine and leucine counting. We also demonstrate lysine counting within product ions further reduces the number of peptides considered 2-fold as compared to lysine counting alone. Finally, we use this amino acid counting strategy to analyze all precursors and find that 916 (19.5% of all selected precursors) are found to have one potential peptide after accurate mass, lysine, and leucine filtering, demonstrating the potential to identify peptides from MS1 spectra alone.
EXPERIMENTAL PROCEDURES
Yeast Growth
For lysine NeuCode SILAC, Saccharomyces cerevisiae strain BY4741 Lys1Δ was grown in defined, synthetic-complete (SC, Sunrise Science) drop out media supplemented with “light” lysine (+0 Da), “heavy 1” 13C6/15N2 lysine (+8.0142 Da, Cambridge Isotopes), or “heavy 2” 2H8 (+8.0502 Da, Cambridge Isotopes). Cells were allowed to propagate for a minimum of 10 doublings to ensure complete lysine incorporation. Upon reaching midlog phase, the cells were harvested by centrifugation at 3000g for 3 min and washed three times with chilled ddH2O. Cell pellets were resuspended in 5 mL of lysis buffer (50 mM Tris pH8, 8 M urea, 75 mM sodium chloride, 100 mM sodium butyrate, 1 mM sodium orthovanadate, protease and phosphatase inhibitor tablet), and total protein was extracted by glass bead milling (Retsch).
For lysine and leucine NeuCode SILAC, yeast was grown, harvested, and lysed as described above but with the following changes: Saccharomyces cerevisiae strain BY4742 (MATα; his3Δ1; leu2Δ0; lys2Δ0; ura3Δ0) was grown in defined, synthetic-complete drop out media supplemented with either “heavy 1” 13C6/15N2 lysine (+8.0142 Da, Cambridge Isotopes; 76 mg/L media) and 13C6/15N leucine (+7.01716 Da, Cambridge Isotopes; 80 mg/L media) or “heavy 2” 2H8 lysine (+8.0502 Da, Cambridge Isotopes; 76 mg/L media) and 2H7 leucine (+7.04393 Da, Cambridge Isotopes; 80 mg/L media).
Sample Preparation
Protein concentration of yeast lysate was measured by BCA (Pierce). Yeast proteins from respective cultures were mixed in a 1:1 ratio before reduction by 5 mM DTT, alkylation with 14 mM iodoacetamide, and capping by an additional 5 mM DTT. Prior to digestion, the sample was diluted to 2 mM Urea using 50 mM Tris and 3 mM CaCl2. Digestion was carried out by adding GluC (Roche Applied Science, Indianapolis, IN) at a 1:100 enzyme to substrate ratio and incubating overnight at room temperature. Peptides were then acidified with trifluoroacetic acid (TFA) to quench the reaction and desalted using C-18 solid phase extraction (SPE) columns (Waters, Milford, MA) before analysis.
Nano-High Performance Liquid Chromatography
Online reverse-phase chromatography was performed using a Nano-Acuity UPLC system (Waters, Milford, MA). Peptides were loaded onto a precolumn (75 μm ID, packed with 5 cm Magic C18 particles, Bruker, Michrom) for 10 min at a flow rate of 1 μL/min. Samples were then eluted over an analytical column (75 μm ID, packed with 25 cm Magic C18 particles, Bruker, Michrom) using either a 60 or 120 min linear gradient from 8% to 35% acetonitrile with 0.2% formic acid and a flow rate of 300 nL/min.
Mass Spectrometry
All experiments were performed on an LTQ Orbitrap Elite mass spectrometer (Thermo Fisher Scientific, San Jose, CA). High resolution (30 000 resolving power) survey scans (MS1) were used to guide data dependent sampling and subsequent CAD fragmentation (NCE = 35) of the top five or ten most intense peptides. Fragment ions were then analyzed in either the ion trap or Orbitrap (480 000 resolving power) to produce MS/MS spectra (MS2). High resolution (240 000 or 480 000 resolving power) MS1 scans enabled the distinction of closely spaces isotopologue partners. Preview mode was enabled, and precursors with unassigned or +1 charge states were not selected for MS2 analysis. A maximum of 500 precursors were dynamically excluded for 30 s with a window −0.55 Th and +2.55 Th surrounding the precursor. MS1 and MS2 target ion accumulation values were set to 1 × 10⁶, 4 × 10⁴, and 1 × 10⁵ for MS1, IT-MS2, and FT-MS2, respectively.
Database Searching and FDR Estimation
MS2 data were analyzed using the Coon OMSSA Proteomic Analysis Software Suite (COMPASS).52 The Open Mass Spectrometry Search Algorithm, OMSSA5, was used to search spectra against a concatenated target–decoy database consisting of yeast protein sequences from Uniprot.53 GluC peptides were created in-silico allowing up to three missed cleavages. The precursor tolerance was set to 200 ppm, while the product ion tolerance was set to ±0.015 Da and ±0.5 Da for FT-MS2 and IT-MS2 spectra, respectively. Carbamidomethylation of cysteines were included as a fixed modification, whereas oxidation of methionine was set as a variable modification. Fixed modifications representing the average mass increase of the 13C6/15N2 and 2H8 isotopologues (+8.0322) compared to unmodified lysine and the average mass increase of the 13C6/15N and 2H7 isotopologues (+7.03054) compared to unmodified leucine were used when appropriate. Database search results were then filtered to 1% FDR.52
Data Analysis with AminoAcidCounter (AACounter)
Amino acid counting was facilitated by in an in-house program, AminoAcidCounter (AACounter). For every precursor, the peak selected for MS2 in the previous high resolution (≥240 000 resolving power) spectrum was located and used as the m/z for analysis of potential isotopologue partners. The m/z shifts of all amino acid combinations (0–5 Lys and 0–5 Leu) were calculated (Supplemental Figure 1, Supporting Information). Using the experimental precursor m/z as a center point, the tallest peak within a 10 ppm window of each amino acid combination was summed over five MS1 scans preceding and fifteen MS1 succeeding the sampling of the precursor and normalized to the summed intensity of the precursor over the same range of scans. Amino acid combinations were ranked on the basis of their absolute distance from a ratio of 1, and only those pairs that received a score of 2 (lysine filtering) or 5 (lysine and leucine filtering) were saved for use in a database search. These score thresholds were determined as they decreased the number of peptides considered, while maintaining high sensitivity.
An in-silico GluC digest of yeast proteins was created by AACounter (0–3 missed cleavages, carbamidomethylation of cysteines). Peptides within a 20 ppm window of the neutral mass of the selected precursor mass were saved as accurate mass matches. For each precursor scored and searched, AACounter output the spectrum in which the precursor was selected, number of matched peptides based on accurate mass filtering, number of matched peptides based on amino acid filtering of the accurate mass list, peptide sequences remaining after accurate mass filtering, and peptide sequences remaining after amino acid filtering of the accurate mass list.
For MS2 filtering, AACounter performed an in-silico fragmentation of each peptide remaining after accurate mass and lysine filtering. For each product that contained a lysine residue, AACounter calculated the m/z corresponding to both the “heavy 1” and “heavy 2” isotopologue product peaks and then analyzed the MS2 spectrum for the presence of these peaks within a 15 ppm window. If both the “heavy 1” and “heavy 2” product isotopologue peaks were present for at least two product ions, the peptide remained under consideration as accurate mass, lysine, and MS2 filtered matches. If a peptide did not contain a lysine residue, no filtering was applied and the peptide remained under consideration.
RESULTS
NeuCode SILAC Enables Amino Acid Counting
To test our NeuCode-facilitated amino acid counting strategy, we developed a scheme to count the number of specified amino acids contained within a given precursor by analyzing the NeuCode isotopic fine structure from an MS1 spectrum (Figure 1). To embed these NeuCode labels, we began with two isotopologues of lysine (Lys-13C6, 15N2 or Lys-D8) (Figure 1A). Both of these amino acids are 8 Da heavier than natural Lys; however, they differ from each other by only 36 mDa and are only detected at resolutions greater than ~200 000 (Figure 1B,C). The close proximity of these NeuCode partners maintains a low complexity MS1 scan, as compared to traditional SILAC, and allows for facile isolation of both partners for concurrent analysis in the MS/MS. Note the spacing of the two peptide isotopologues within the MS1 spectrum still facilitates relative quantitation, provided they are resolved. Our intent here, however, is to enable the calculation of lysine count for each precursor. For example, the triply charged precursor at m/z 360.197 had a partner located 23.4 mTh higher in m/z space (Figure 1C). To calculate the mass difference in Da, the m/z difference was multiplied by the precursor z and divided by the mass difference imparted by one lysine (36.0 mDa, Figure 1C, inset). The arithmetic reveals this particular precursor peptide contains two lysine residues, a result confirmed upon database searching of the tandem MS/MS scan (MKPTSIEKE). Supplemental Figure 2, Supporting Information, depicts an extracted ion chromatogram of this peptide demonstrating near-coelution of both isotopologues.
Figure 1.

Amino acid counting with NeuCode SILAC. (A) Experimental design of lysine NeuCode SILAC utilizing either “heavy 1” lysine (Lys-13C6,15N2) or “heavy 2” lysine (Lys-D8). (B) A survey scan acquired in the Orbitrap was used to select a triply charged precursor at m/z 360.197. (C) A precursor at m/z 630.197 displays the presence of two distinct peaks separated by 23.4 mTh, created by the incorporation of two lysine isotopologues. This was confirmed by a database search, which matched it to sequence, MKPTSIEKE.
Theoretical Calculations of Reduction in Precursor Search Space
Traditional SILAC data analysis often begins with the assignment of peptide pairs before a database search, enabling lysine and/or arginine counting to limit the precursor search space by accurate mass (20 ppm) and then the number of counted amino acids.21 We surmised that alternate enzyme digestion and additional heavy amino acids could further limit search space, ideally to one candidate sequence, perhaps enabling identifications of amino acids based solely on MS1 information. To determine the best enzyme and heavy amino acid combination, 100 000 randomly selected yeast peptides were searched against all peptides from an in-silico digest and filtered on the basis of accurate mass, accurate mass and the count of one amino acid, or accurate mass and the count of two amino acids. For these calculations, we used LysC and GluC and, in addition to lysine, leucine was used due to its prevalence within the proteome as well as the availability of appropriate heavy isotopologues. Lysine and leucine are also used as heavy amino acids in yeast culture providing confidence that an experimental strategy which uses both amino acids in culture was feasible.34,54,55
Using LysC and accurate mass alone, the median number of candidate sequences for a precursor from 100 000 random yeast peptides is 18 (Figure 2A). If these peptides are filtered by accurate mass and the number of lysines or the number of lysines and leucines, the median number of candidates falls to 6 and 2, respectively (Figure 2A). Here, 38.2% (38 167 of 100 000) precursor m/z peaks have only one candidate sequence remaining after all three filters are applied. When GluC peptides are filtered for accurate mass and the number of lysines and leucines, the median number of sequences under consideration for each precursor falls to 1 and 51.2% (51 299 of 100 000) of precursor m/z peaks having only one candidate sequence that fits all three criteria (Figure 2B). This exciting calculation prompted us to proceed to test the idea experimentally. Specifically, we labeled yeast with either NeuCode Lysine or NeuCode Lysine and leucine and digested the resulting proteins with GluC.
Figure 2.

Theoretical calculations using amino acid counting. (A) LysC theoretical calculations: 100 000 random yeast LysC peptides were searched against an entire in-silico LysC digest of the yeast proteome with a precursor search tolerance of 20 ppm. The list of resulting peptides was then narrowed if the candidate peptide contained the same number of lysines or lysines and leucines as the peptides used for the search. (B) GluC theoretical calculations: Identical analysis to (A) was performed, but GluC was used as the enzyme for in-silico digest of the yeast proteome.
NeuCode SILAC to Count Lysines
To test NeuCode SILAC for MS1 identifications, proteins from yeast cultured as shown in Figure 1A were mixed 1:1, digested by GluC, and analyzed in four nanoLC-MS/MS experiments. Tandem mass spectra from all four raw files were searched against an in-silico GluC digest of the yeast proteome using traditional database correlation (1% FDR) to produce confident peptide assignments.52 Automatic counting of lysines within precursors was performed by an in-house program, “AminoAcidCounter” (AACounter). AACounter uses precursor m/z and z to analyze raw data and calculate a score for potential peptide isotopologue partners separated by the mass shift imparted heavy amino acid combinations. For example, a triply charged precursor selected for MS/MS analysis at 442.970 is shown in Figure 3A. A zoomed view of this precursor demonstrates peptide pairs separated in the MS1 by 23.6 mTh, a shift imparted by two lysine residues (Figure 3B). An accurate mass (20 ppm) search of GluC peptides within AACounter returned 11 candidate sequences, only one of which had two lysine residues, LNVPKSKALVLE, this sequence was then confirmed by database search of the corresponding MS/MS scan (high confidence match value = 3.51 × 10⁻⁵). Supplemental Figure 3, Supporting Information, depicts an extracted ion chromatogram of this peptide demonstrating both isotopologues nearly coelute. This result demonstrates the ability to identify a peptide solely on the basis of information gathered from MS1 spectra. We mapped 6678 tandem mass spectra to sequence and used these identifications to determine how many of these could be uniquely identified using amino acid counting and accurate mass. We determined that amino acid counting reduced search space as the median number of candidate sequences per precursor falls more than 3-fold, from 44 to 14 (Figure 3D,E), while the sensitivity (calculated by the number of times the correct peptide still remains under consideration) remains high at 95.6%. FDR of AAC is slightly higher than typical peptide FDR (1%) due to incorrect scoring and higher number of false positives with low signal-to-noise precursors (Supplemental Figure 4, Supporting Information). We conclude that NeuCode SILAC amino acid counting with a single amino acid provides significant benefits but does not often remove the requirement for tandem MS.
Figure 3.

Lysine NeuCode SILAC enabled amino acid counting. (A) A survey scan acquired in the Orbitrap was used to select a triply charged precursor at m/z 442.970. (B) A precursor at m/z 442.970 displays the presence of two distinct peaks separated by 23.6 mTh, created by the incorporation of 2 lysine isotopologues. (C) A search of an in-silico digest of the yeast proteome with a 20 ppm precursor tolerance returned 11 candidate peptides, only one of which contained two lysines, LNVPKSKALVLE. (D) The number of peptides remaining after accurate mass (20 ppm) and subsequent lysine filtering of 6678 precursors were plotted as a histogram. (E) Median number of peptides considered after filtering.
Using MS2 Information to Further Reduce Precursor Search Space
Lysine NeuCode SILAC partners are closely spaced (<40 mDa) and are always cofragmented as mass filtering devices do not have mTh resolution. Utilizing this characteristic, we wondered how beneficial would the NeuCode labels be for improving identification by amino acid counting from product ion spectra. Figure 4A displays the MS/MS spectrum of a triply charged peptide TGVIKPGMVVTFAP-AGVTTE dissociated by CAD and analyzed at high resolution (to reveal the NeuCode signatures). Both isotopologues of this peptide nearly coeluted as demonstrated in Supplemental Figure 5, Supporting Information, enabling cofragmentation. Any product ion containing a NeuCode labeled lysine should appear as a doublet. Detection of these doublets, therefore, reveals which fragments have Lys and how many. Figure 4B displays a typical spectrum. AACounter was modified to create in-silico fragments for each light and heavy peptide partner that was under consideration following accurate mass and lysine filtering. Putative sequences remained under consideration if at least two lysine-containing product ions contained both the “heavy 1” and “heavy 2” partners within the MS2 spectrum. Application of this filter reduced the median number of candidate sequences considered per precursor from 13, with accurate mass and lysine filtering, to 7 with accurate mass, lysine, and MS2 filtering with only a 5% decrease in sensitivity (Figure 4C). Meanwhile, the number of precursors that correctly matched to one candidate sequence increased almost 3-fold from 36 with accurate mass and lysine filtering to 105 with accurate mass, lysine, and MS2 filtering. We reason that, as the time penalty for collecting high resolution MS/MS scans is reduced with newer instrumentation, this type of approach may become quite useful for aiding in confident peptide identification.
Figure 4.

MS2 analysis further narrows precursor search space. (A) Annotated high resolution MS2 spectrum of the peptide TGVIKPGMVVTFAPAGVTTE. (B) Enlarged view of lysine-containing product ions. Three doubly charged product ions (b11, b17, b19) exhibit m/z shifts of ~18 mTh or ~36 mDa when corrected for charge state. (C) Lysine and MS2 filtering applied to unique peptide spectral matches. For 1652 unique peptide spectral matches, the number of candidates remaining after accurate mass (20 ppm) plus lysine and subsequent MS2 filtering were plotted as a histogram.
NeuCode SILAC to Count Lysine and Leucine
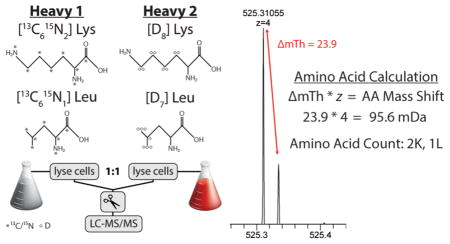
Still hoping to demonstrate that NeuCode amino acid counting could eliminate the need for MS/MS scanning for some fraction of precursors, we tested the peptides that had been labeled with both Lys and Leu (Figure 5A). Here, we combined NeuCode isotopologues of both amino acids to label yeast proteins, mixed the proteins 1:1, digested with GluC, and analyzed in five separate nanoLC-MS/MS experiments. Panel B of Figure 5 presents a MS1 spectrum of a +4 precursor at m/z 525.310 that was selected for MS/MS analysis. An expanded view of this monoisotopic m/z peak of the precursor reveals two partner isotopologues separated by 95.6 mDa, indicating the presence of two lysines and one leucine (Figure 5C). An accurate mass search of this precursor (20 ppm) returned 17 potential peptides, only one of which met the amino acid criteria AKAQGVAVQLKRQPAQPRE (Figure 5D). This putative match was confirmed by searching the MS/MS scan with conventional database matching algorithms. Note, the incorporation of multiple deuterated lysine and leucine residues induces a retention time shift of this peptide (Supplemental Figure 6, Supporting Information).
Figure 5.

Lysine and leucine NeuCode SILAC enabled amino acid counting. (A) Experimental design of lysine and leucine NeuCode SILAC. (B) A survey scan acquired in the Orbitrap at a resolving power of 30 000 was used to select a +4 precursor at m/z 525.310. (C) Enlarged view of precursor at m/z 525.310. The presence of two distinct peaks separated by 23.9 mTh is created by the incorporation of 2 lysines and 1 leucine residues. (D) A search of an in-silico digest of the yeast proteome with a 20 ppm precursor tolerance returned 17 candidate peptides, only one of which contained two lysines and one leucine, AKAQGVAVQLKRQPAQPRE. (E) The number of candidate sequences remaining after accurate mass (20 ppm) and subsequent lysine and leucine filtering of 5571 precursors. (F) Median number of candidate sequences considered after filtering.
AACounter was modified to enable automated leucine and lysine counting for 5571 peptide identifications across five nanoLC-MS/MS experiments (typically ~3000 peptide identifications per run). The distribution of the number of sequence candidates remaining based on accurate mass (20 ppm) or accurate mass and lysine and leucine filtering is displayed in Figure 5E. Impressively, the median number of peptides under consideration for each precursor falls more than 6-fold from 43 to 7, while sensitivity was high at 87% (Figure 5F). In addition, 276 precursors were found to have only one potential peptide after accurate mass and lysine and leucine filtering, of which 209 (75%) were found to be correct (as judged by database searching), signifying an ability to identify peptides without subjecting precursors to MS/MS analysis. Note, the FDR of AACounter is ~25% for one candidate precursor due to inaccuracies of scoring low signal-to-noise precursors, similar to lysine results in Supplemental Figure 4, Supporting Information, as well as the increased number of isotopologue pairs when scoring lysine and leucine combinations.
Application of Lysine and Leucine Counting
AA-Counter was then used to search all precursors chosen for MS/MS analysis using lysine and leucine counting as a search filter. Note, we restricted analysis to these precursor because MS/MS scanning provided a second means by which to establish sequence. For this analysis, 400 unique precursors from a nanoLC-MS/MS experiment were analyzed with varying precursor search tolerances (20 to 5 ppm) within AACounter (Figure 6A). The narrowing of the precursor search window lowers the median number of candidate sequences considered from 42 to 11 and 7 to 2 for accurate mass and accurate mass plus amino acid filtering, respectively. The reduction in search space only slightly impacts sensitivity from 20 to 7.5 ppm (94% vs 91%), while reduction to 5 ppm severely lowers sensitivity (79%). In addition, decreasing the precursor search tolerance increases the number of precursors with only one candidate sequence from 23 (20 ppm) to 103 (5 ppm) (Figure 6B). We are encouraged that peptide sequences identified by our MS1 analysis method are correct more than 92% of the time across all search tolerances, demonstrating high confidence when these precursors have one suitable match.
Figure 6.

Applying lysine and leucine counting to a nanoLC-MS/MS experiment. (A) Sensitivity and median number of candidate sequences considered vs precursor search tolerance. (B) Number of candidate sequences with one match vs precursor search tolerance. The number of these precursors that identified the same peptide as a database search is plotted in red. (C) Lysine and leucine counting applied to all precursors selected in a nanoLC-MS/MS experiment. AAC returned one sequence candidate for 916 precursors, while returning zero sequence candidates for 1358 precursors. (D) High resolution MS1 spectrum of a one match precursor at m/z 620.023. Two peaks spaced 52.4 mTh or 156.9 mDa apart signified the presence of three lysines and 2 leucine residues, mapping this precursor to the peptide GERAKTKDNNLLGKE. (E) An annotated high resolution MS2 belonging to the precursor at m/z 620.023 confirms the peptide GERAKTKDNNLLGKE. Product ions produced by HCD containing lysine or leucine demonstrate the appropriate partners in the MS2 spectrum (insets).
A search tolerance of 7.5 ppm was used to analyze all precursors in the same nanoLC-MS/MS experiment, as its high sensitivity (91%) and single precursor match fidelity (97%) offered the best opportunity to identify peptides from an MS1 alone (Figure 6C). The median number of peptides under consideration drops 7-fold (14 to 2) when amino acid filtering is applied, while the 916 precursors which matched to one peptide (representing 19.5% of all selected precursors) is 14% higher than the number of peptide spectral matches returned through a database search (805). Of the 916 precursors that AACounter matched to one peptide, 86.5% were in agreement with traditional database searching. This provides confidence that precursors not identified by database search, but found to have one match by AACounter, are correct. Knowing that many tandem mass spectra are chimeric,56 we postulate that a considerable fraction of the 14% that disagree may stem from such mixed spectra. One of these precursors, a triply charged peptide at m/z 620.023 was uniquely mapped to the sequence GERAKTKDNNLLGKE by AACounter (Figure 6D). This spectrum was not mapped to sequence by database search, but the peptide was manually confirmed by calculating an MS1 mass difference of 156.9 mDa, corresponding to the presence of 3 lysine and 2 leucine residues (Figure 6D, inset) as well as confirming the number of lysines and leucines in each product ion (Figure 6E). The simple introduction of two amino acids using NeuCode SILAC, combined with GluC digestion, enabled the identification of peptides from MS1 spectra alone and provides a proof-of-concept for a NeuCode MS1 identification method.
DISCUSSION
Here we describe an experimental strategy utilizing NeuCode SILAC peptide isotopologues and high mass accuracy to count the number of lysine and/or leucine residues within precursor species. These data can assist with the traditional database correlation sequencing method or can, in some cases, permit identification directly from the MS1 spectral information. Theoretical calculations demonstrate this strategy could potentially identify more than 50% of the peptides generated by a GluC digestion of the yeast proteome without MS/MS analysis. To implement this strategy, we developed a software program, AACounter, to determine possible combinations of lysine or lysine and leucine residues. Counting lysine residues, in addition to high mass accuracy, decreased the median number of candidates for each precursor more than 3-fold (44 to 14). The additional filter of requiring lysine containing product ions decreased the median number of peptides considered per precursor from 13 to 7. The addition of leucine to lysine and accurate mass filtering decreased the median number of candidates more than 6-fold from 43 to 7. Finally, when used on all selected precursors in a “shotgun” proteomics analysis of GluC yeast digest, accurate mass along with lysine and leucine filtering returns only one peptide candidate for 916 (19.5%) of precursors.
We note that the current implementation used deuterium labeled amino acids for NeuCode SILAC. Deuterium can induce chromatographic elution time shifts,57 but these are relatively small and inconsequential for most peptides (1–2).58 That said, samples containing peptides with multiple deuterium labeled amino acids displayed greater elution discrepancies. To account for chromatographic shifts, multiple MS1 spectra were examined to adequately determine the number of amino acids in each precursor. We envision multiple NeuCode isotopologues, with less reliance on deuterium, of several amino acids being commercially available in the near future.
Accurate selection of the correct monoisotopic precursor m/z peak also partly confounded our analysis and reduced our impact from theory. Theoretical calculations were performed assuming knowledge of the precursor monoisotopic mass, which is not always determined correctly by the instrument.59 Identification of the monoisotopic peak would reduce search space and improve our uniquely identified sequences from the 20% we currently report. These challenges were overcome with post-acquisition analysis, but this technology is ideally implemented in real-time so that up to half of all precursors could be avoided for MS/MS analysis. Recently, we and others described methods to enable real-time searching of precursor species using a modified instrument control methodology.60,61 Current work is aimed to improve the above limitations and to implement this technology into the real-time acquisition methodologies, improving instrument duty cycle and allowing deeper sampling of complex mixtures.
Supplementary Material
Acknowledgments
This work was funded by NIH grant R01 GM080148. C.M.R. was funded by an NSF Graduate Research Fellowship and NIH Trainee-ship (T32GM008505). A.E.M. gratefully acknowledges support from a National Institutes of Health-funded Genomic Sciences Training Program (5T32HG002760).
Footnotes
Notes
The authors declare no competing financial interest.
ASSOCIATED CONTENT
Additional information as noted in text. This material is available free of charge via the Internet at http://pubs.acs.org.
References
- 1.Coon JJ, Syka JEP, Shabanowitz J, et al. Biotechniques. 2005;38(4):519. doi: 10.2144/05384TE01. [DOI] [PubMed] [Google Scholar]
- 2.Eng JK, McCormack AL, Yates JR., III J Am Soc Mass Spectrom. 1994;5(11):976–989. doi: 10.1016/1044-0305(94)80016-2. [DOI] [PubMed] [Google Scholar]
- 3.Perkins DN, Pappin DJC, Creasy DM, et al. Electrophoresis. 1999;20(18):3551–3567. doi: 10.1002/(SICI)1522-2683(19991201)20:18<3551::AID-ELPS3551>3.0.CO;2-2. [DOI] [PubMed] [Google Scholar]
- 4.Craig R, Beavis RC. Bioinformatics. 2004;20(9):1466–1467. doi: 10.1093/bioinformatics/bth092. [DOI] [PubMed] [Google Scholar]
- 5.Geer LY, Markey SP, Kowalak JA, et al. J Proteome Res. 2004;3(5):958–964. doi: 10.1021/pr0499491. [DOI] [PubMed] [Google Scholar]
- 6.Cox JR, Neuhauser N, Michalski A, et al. J Proteome Res. 2011;10(4):1794–1805. doi: 10.1021/pr101065j. [DOI] [PubMed] [Google Scholar]
- 7.Wenger CD, Coon JJ. J Proteome Res. 2013;12:1377–1386. doi: 10.1021/pr301024c. [DOI] [PMC free article] [PubMed] [Google Scholar]
- 8.Sadygov RG, Cociorva D, Yates JR. Nat Methods. 2004;1(3):195–202. doi: 10.1038/nmeth725. [DOI] [PubMed] [Google Scholar]
- 9.Hsieh EJ, Hoopmann MR, MacLean B, et al. J Proteome Res. 2009;9(2):1138–1143. doi: 10.1021/pr900816a. [DOI] [PMC free article] [PubMed] [Google Scholar]
- 10.Eng JK, Searle BC, Clauser KR, et al. Mol Cell Proteomics. 2011;10:11. doi: 10.1074/mcp.R111.009522. [DOI] [PMC free article] [PubMed] [Google Scholar]
- 11.Olsen JV, Schwartz JC, Griep-Raming J, et al. Mol Cell Proteomics. 2009;8(12):2759–2769. doi: 10.1074/mcp.M900375-MCP200. [DOI] [PMC free article] [PubMed] [Google Scholar]
- 12.Michalski A, Damoc E, Hauschild J-P, et al. Mol Cell Proteomics. 2011;10:9. doi: 10.1074/mcp.M111.011015. [DOI] [PMC free article] [PubMed] [Google Scholar]
- 13.Bereman MS, Canterbury JD, Egertson JD, et al. Anal Chem. 2011;84(3):1533–1539. doi: 10.1021/ac203210a. [DOI] [PMC free article] [PubMed] [Google Scholar]
- 14.Michalski A, Damoc E, Lange O, et al. Mol Cell Proteomics. 2012;11:3. doi: 10.1074/mcp.O111.013698. [DOI] [PMC free article] [PubMed] [Google Scholar]
- 15.Jensen ON, Podtelejnikov A, Mann M. Rapid Commun Mass Spectrom. 1996;10(11):1371–1378. doi: 10.1002/(SICI)1097-0231(199608)10:11<1371::AID-RCM682>3.0.CO;2-5. [DOI] [PubMed] [Google Scholar]
- 16.Clauser KR, Baker P, Burlingame AL. Anal Chem. 1999;71(14):2871–2882. doi: 10.1021/ac9810516. [DOI] [PubMed] [Google Scholar]
- 17.Goodlett DR, Bruce JE, Anderson GA, et al. Anal Chem. 2000;72(6):1112–1118. doi: 10.1021/ac9913210. [DOI] [PubMed] [Google Scholar]
- 18.Smith RD, Anderson GA, Lipton MS, et al. Proteomics. 2002;2(5):513–523. doi: 10.1002/1615-9861(200205)2:5<513::AID-PROT513>3.0.CO;2-W. [DOI] [PubMed] [Google Scholar]
- 19.Zubarev R, Mann M. Mol Cell Proteomics. 2007;6(3):377–381. doi: 10.1074/mcp.M600380-MCP200. [DOI] [PubMed] [Google Scholar]
- 20.Bakalarski C, Haas W, Dephoure N, et al. Anal Bioanal Chem. 2007;389(5):1409–1419. doi: 10.1007/s00216-007-1563-x. [DOI] [PubMed] [Google Scholar]
- 21.Cox J, Mann M. Nat Biotechnol. 2008;26(12):1367–1372. doi: 10.1038/nbt.1511. [DOI] [PubMed] [Google Scholar]
- 22.Zubarev RA, Håkansson P, Sundqvist B. Anal Chem. 1996;68(22):4060–4063. [Google Scholar]
- 23.Cargile BJ, Stephenson JL. Anal Chem. 2003;76(2):267–275. doi: 10.1021/ac0352070. [DOI] [PubMed] [Google Scholar]
- 24.Ong SE, Blagoev B, Kratchmarova I, et al. Mol Cell Proteomics. 2002;1(5):376–386. doi: 10.1074/mcp.m200025-mcp200. [DOI] [PubMed] [Google Scholar]
- 25.Zhu H, Pan S, Gu S, et al. Rapid Commun Mass Spectrom. 2002;16(22):2115–2123. doi: 10.1002/rcm.831. [DOI] [PubMed] [Google Scholar]
- 26.Comisarow MB, Marshall AG. J Mass Spectrom. 1996;31(6):581–585. doi: 10.1002/(SICI)1096-9888(199606)31:6<581::AID-JMS369>3.0.CO;2-1. [DOI] [PubMed] [Google Scholar]
- 27.Marshall AG, Hendrickson CL, Jackson GS. Mass Spectrom Rev. 1998;17(1):1–35. doi: 10.1002/(SICI)1098-2787(1998)17:1<1::AID-MAS1>3.0.CO;2-K. [DOI] [PubMed] [Google Scholar]
- 28.Bogdanov B, Smith RD. Mass Spectrom Rev. 2005;24(2):168–200. doi: 10.1002/mas.20015. [DOI] [PubMed] [Google Scholar]
- 29.Chen X, Smith LM, Bradbury EM. Anal Chem. 2000;72(6):1134–1143. doi: 10.1021/ac9911600. [DOI] [PubMed] [Google Scholar]
- 30.Veenstra TD, Martinović S, Anderson GA, et al. J Am Soc Mass Spectrom. 2000;11(1):78–82. doi: 10.1016/S1044-0305(99)00120-8. [DOI] [PubMed] [Google Scholar]
- 31.Martinović S, Veenstra TD, Anderson GA, et al. J Mass Spectrom. 2002;37(1):99–107. doi: 10.1002/jms.263. [DOI] [PubMed] [Google Scholar]
- 32.Du Y, Parks BA, Sohn S, et al. Anal Chem. 2005;78(3):686–694. doi: 10.1021/ac050993p. [DOI] [PubMed] [Google Scholar]
- 33.Collier TS, Sarkar P, Rao B, et al. J Am Soc Mass Spectrom. 2010;21(6):879–889. doi: 10.1016/j.jasms.2010.01.031. [DOI] [PubMed] [Google Scholar]
- 34.Pratt JM, Robertson DHL, Gaskell SJ, et al. Proteomics. 2002;2(2):157–163. doi: 10.1002/1615-9861(200202)2:2<157::aid-prot157>3.0.co;2-m. [DOI] [PMC free article] [PubMed] [Google Scholar]
- 35.Horn DM, Peters EC, Klock H, et al. Int J Mass Spectrom. 2004;238(2):189–196. [Google Scholar]
- 36.Volchenboum SL, Kristjansdottir K, Wolfgeher D, et al. Mol Cell Proteomics. 2009;8(8):2011–2022. doi: 10.1074/mcp.M800472-MCP200. [DOI] [PMC free article] [PubMed] [Google Scholar]
- 37.Hunter TC, Yang L, Zhu H, et al. Anal Chem. 2001;73(20):4891–4902. doi: 10.1021/ac0103322. [DOI] [PubMed] [Google Scholar]
- 38.Zhu H, Hunter TC, Pan S, et al. Anal Chem. 2002;74(7):1687–1694. doi: 10.1021/ac010853p. [DOI] [PubMed] [Google Scholar]
- 39.Gu S, Pan S, Bradbury EM, et al. J Am Soc Mass Spectrom. 2003;14(1):1–7. doi: 10.1016/S1044-0305(02)00799-7. [DOI] [PubMed] [Google Scholar]
- 40.Pan S, Gu S, Bradbury EM, et al. Anal Chem. 2003;75(6):1316–1324. doi: 10.1021/ac020482s. [DOI] [PubMed] [Google Scholar]
- 41.Gu S, Pan S, Bradbury EM, et al. Anal Chem. 2002;74(22):5774–5785. doi: 10.1021/ac0204350. [DOI] [PubMed] [Google Scholar]
- 42.Zhong H, Marcus SL, Li L. J Proteome Res. 2004;3(6):1155–1163. doi: 10.1021/pr049900v. [DOI] [PubMed] [Google Scholar]
- 43.Shui W, Liu Y, Fan H, et al. J Proteome Res. 2004;4(1):83–90. doi: 10.1021/pr049850u. [DOI] [PubMed] [Google Scholar]
- 44.Hilger M, Mann M. J Proteome Res. 2011;11(2):982–994. doi: 10.1021/pr200740a. [DOI] [PMC free article] [PubMed] [Google Scholar]
- 45.Ong SE. Anal Bioanal Chem. 2012;404(4):967–976. doi: 10.1007/s00216-012-5998-3. [DOI] [PubMed] [Google Scholar]
- 46.Hebert AS, Merrill AE, Bailey DJ, et al. Nat Methods. 2013;10:332–334. doi: 10.1038/nmeth.2378. [DOI] [PMC free article] [PubMed] [Google Scholar]
- 47.Makarov A, Denisov E, Lange O. J Am Soc Mass Spectrom. 2009;20(8):1391–1396. doi: 10.1016/j.jasms.2009.01.005. [DOI] [PubMed] [Google Scholar]
- 48.Bruce JE, Anderson GA, Lin CY, et al. J Mass Spectrom. 2000;35(1):85–94. doi: 10.1002/(SICI)1096-9888(200001)35:1<85::AID-JMS910>3.0.CO;2-7. [DOI] [PubMed] [Google Scholar]
- 49.Syka JEP, Marto JA, Bai DL, et al. J Proteome Res. 2004;3(3):621–626. doi: 10.1021/pr0499794. [DOI] [PubMed] [Google Scholar]
- 50.Kaiser N, Quinn J, Blakney G, et al. J Am Soc Mass Spectrom. 2011;22(8):1343–1351. doi: 10.1007/s13361-011-0141-9. [DOI] [PubMed] [Google Scholar]
- 51.Denisov E, Damoc E, Lange O, et al. Int J Mass Spectrom. 2012;325–327(0):80–85. [Google Scholar]
- 52.Wenger CD, Phanstiel DH, Lee MV, et al. Proteomics. 2011;11(6):1064–1074. doi: 10.1002/pmic.201000616. [DOI] [PMC free article] [PubMed] [Google Scholar]
- 53.Consortium TU. Nucleic Acids Res. 2012;40(D1):D71–D75. [Google Scholar]
- 54.Jiang H, English AM. J Proteome Res. 2002;1(4):345–350. doi: 10.1021/pr025523f. [DOI] [PubMed] [Google Scholar]
- 55.Gruhler A, Olsen JV, Mohammed S, et al. Mol Cell Proteomics. 2005;4(3):310–327. doi: 10.1074/mcp.M400219-MCP200. [DOI] [PubMed] [Google Scholar]
- 56.Houel S, Abernathy R, Renganathan K, et al. J Proteome Res. 2010;9(8):4152–4160. doi: 10.1021/pr1003856. [DOI] [PMC free article] [PubMed] [Google Scholar]
- 57.Boutilier JM, Warden H, Doucette AA, et al. J Chromatogr, B. 2012;908(0):59–66. doi: 10.1016/j.jchromb.2012.09.035. [DOI] [PubMed] [Google Scholar]
- 58.Gygi SP, Rist B, Gerber SA, et al. Nat Biotechnol. 1999;17(10):994–999. doi: 10.1038/13690. [DOI] [PubMed] [Google Scholar]
- 59.Mayampurath AM, Jaitly N, Purvine SO, et al. Bioinformatics. 2008;24(7):1021–1023. doi: 10.1093/bioinformatics/btn063. [DOI] [PMC free article] [PubMed] [Google Scholar]
- 60.Bailey DJ, Rose CM, McAlister GC, et al. Proc Natl Acad Sci. 2012;109(22):8411–8416. doi: 10.1073/pnas.1205292109. [DOI] [PMC free article] [PubMed] [Google Scholar]
- 61.Graumann J, Scheltema RA, Zhang Y, et al. Mol Cell Proteomics. 2012;11:3. doi: 10.1074/mcp.M111.013185. [DOI] [PMC free article] [PubMed] [Google Scholar]
Associated Data
This section collects any data citations, data availability statements, or supplementary materials included in this article.