

Abstract
Background
This study determined the reliability, validity, and factor structure of self-report emotions in persons with mild Alzheimer’s disease (AD) and mild cognitive impairment (MCI) relative to controls.
Methods
Participants (mild AD, n = 73; MCI, n = 159; controls, n = 96) rated current emotions with the Visual Analogue Mood Scales (Stern, 1997).
Results
Internal consistency reliabilities were comparable across groups, as were the factor structures of emotion. Persons with AD reported more negative affect (NA) than persons with MCI and controls. The emotion that most differentiated groups was confusion. NA and PA may be more bipolar in persons with AD than for persons with MCI and controls.
Conclusions
The underlying structure of affect was similar in persons with mild AD, MCI, and controls. Further, persons with MCI appeared to be “transitional” between cognitive health and dementia with regard to mood and affect. That is, participants with MCI tended to have affect scores that were intermediate between those with AD and controls. Implications for interventions to improve emotional well-being in AD and MCI are discussed.
Keywords: visual analogue scales, positive affect, negative affect, factor structure, emotion, self-report, dementia
Introduction
It is difficult to know when a person with Mild Cognitive Impairment (MCI) or mild Alzheimer’s disease (mAD) can provide data about their experiences that are valid and reliable. On the one hand, there are obvious difficulties in collecting self-report data from persons with conditions that adversely impact memory and insight. On the other hand, self-report data are the most desirable source of data for subjective outcomes in clinical practice and research, such as data pertaining to emotions, well-being, and life quality. The Federal Drug Administration has an initiative to encourage patient-reported outcomes in clinical trials (Federal Drug Administration, 2006). Thus, there are many reasons to determine if and when data from persons with dementia are valid. Recent research suggests that persons with amnesia can provide valid data about their current emotions, long after the source of the emotion is forgotten (Feinstein et al., 2010). That is, persons with amnesia can validly report that they are sad without knowing why they are sad. Whereas this work has not been conducted in AD, it suggests that persons with AD, who similarly suffer from amnesia, might be able report on their current emotions in a valid manner. This hypothesis is further supported by the fact that some limbic structures, which are centrally involved in the experience and processing of emotion information, are relatively preserved in persons with AD (Barnes et al., 2006).
This study collected self-report data about current emotions from persons with mild AD and MCI, as well as from cognitively intact controls. It is likely that self-report data from persons with memory impairment will be most valid if the data pertain to the current time and do not require retrospective recall. Further, Kolanowski et al. (2007) cogently argue that daily emotions are particularly important to understand in persons with AD because they are likely to live in the “here and now” due to memory impairment.
Emotions in Alzheimer’s Disease
Very little is known about self-reported emotions in persons with AD. Some of the most compelling evidence about emotion in AD comes from dementia quality of life (QOL) instruments that include a large proportion of affected items. For example, The Dementia Quality of Life (DQoL) questionnaire includes measures of positive (PA) and negative affect (NA) and was designed expressly to gather self-report data from persons with dementia (Brod et al., 1999). On this scale, persons with AD reported significantly more PA and NA than their family caregivers (Sands et al., 2004). In another project, relative to controls, persons with mild AD and MCI reported mean PA and NA on the DQoL that were not significantly different from cognitively intact controls (Ready et al., 2004). Further, on QOL instruments, internal consistencies for participants with mild to moderate dementia are adequate and comparable to informant-report, ranging for example from 0.64 to 0.90 on the DQoL (Broad et al., 1999; Ready et al., 2004). A shortcoming of these studies is that the DQoL assesses affect over the past month and it is presumably a difficult, if not impossible, task for a person with memory impairment to accurately recall their affect over such a long period of time.
In a study of current emotion in persons with moderate to severe AD, emotions are assessed 12 days in a row by observers using the Geriatric Philadelphia Center Affect Rating Scale (Lawton et al., 1996) and by self-report via the Dementia Mood Picture Test (Tappen and Barry, 1995). Participants were nursing home residents. Emotions were more variable over time in participants with greater cognitive impairment (Kolanowski et al., 2007). This was particularly true for negative emotions. Positive emotions tended to be more stable over time, at least from observer perspectives. Internal consistency reliability of self-report emotional data was better in participants with stronger cognitive abilities.
Validity of Patient Report Data
Following from the studies above, persons with AD and MCI may be able to report about their emotions and provide internally consistent data. Determining the validity of self-report emotions in AD and MCI is more difficult. One relatively under-utilized way to approach validity is to compare the factor structure of data provided by patients and controls. That is, factor analyses can be used as an initial indication that the data provided by patients is or is not valid, in so far as it conforms to a known, reliable, and meaningful theoretical structure.
There is general consensus that affective space can broadly captured by two largely independent dimensions of PA and NA. That is, when affect terms are factor analyzed, two dimensions routinely emerge from analyses. Items measuring PA, such as happy, cheerful, and excited tend to covary and cohere into one factor, whereas as NA terms (e.g., sad and angry) tend to form another factor. Further, the structure of PA and NA tends to be highly similar in younger and older adult samples (e.g. Kunzmann et al., 2000; Crawford and Henry, 2004).
Less is known, however, about the structure of affect in persons with MCI and AD but preliminary evidence suggests that data provided by these populations might conform to data provided by caregivers. In exploratory factor analyses, Ready and colleagues (2007) compared the structure of DQoL data provided by persons with MCI and mild AD to the factor structure of caregiver-report. As previously mentioned, the DQoL is largely composed of affect terms. Results indicated highly similar factor structures across the patient and caregiver groups.
The Current Study
The current study extends previous work on the reliability and validity of subjective data from persons with MCI and mild AD by comparing the factor structure of self-reported emotions in these groups, as well as determining internal consistency reliabilities and convergent validity of the reports. Data were collected with the Visual Analogue Mood Scales (VAMS), which were designed to facilitate collection of affect data from neurologic impaired patient populations (Stern, 1997). The VAMS can be administered with simple verbal instructions and responses are nonverbal. Participants rate their current mood. The VAMS demonstrates validity in several populations of neurologically impaired patients, including persons with dementia and controls (Nyehius et al., 1997; Temple et al., 2004). In this study, mean levels of discrete emotions, as well as NA and PA, were compared across groups. Next, exploratory factor analyses determined the structure of affect in the patient samples, which were compared to results from age and education-matched controls1. The convergent validity of affect reports with self-reported depressive symptoms also was examined because state mood may be significantly associated with current depressive symptoms, which are somewhat more temporally stable (Meyer and Shack, 1989).
Methods
Participants
Participant data were drawn from the Boston University Alzheimer’s Disease Core Center Research Registry and retrospectively analyzed. Participants were from the greater Boston area and were recruited via advertisements, physician referrals, and community talks. All participants were English-speaking and community-dwelling older adults. All participants had a study partner to provide informant data. Exclusion criteria were a history of a major psychiatric disorder (e.g., bipolar disorder, schizophrenia) or other significant central nervous system disorder (e.g., stroke, epilepsy). Data collection and diagnostic procedures have been described in detail elsewhere (Ashendorf et al., 2008). To summarize, participants and informants engaged in a comprehensive interview, clinical history, and assessment (including neuropsychological and neurological evaluations). Participants were diagnosed as cognitively normal, having MCI (single or multiple domain), or AD by a multidisciplinary consensus team that included board certified neurologists, neuropsychologists, and a nurse practitioner. “Possible” MCI was diagnosed based on functional independence and objective cognitive impairment in one or more domains, defined by a performance that was ≥ 1.5 SD below the normative mean for at least one test in that domain. “Probable” MCI further was characterized by a cognitive complaint by the participant or companion, and corresponds to contemporary diagnostic criteria for MIC (Winblad et al., 2004). All MCI participants had a global Clinical Dementia Rating (CDR; Morris, 1993) rating of 0.5.
AD was diagnosed according to the NINCDS-ADRDA criteria for “probable” and “possible” AD (McKhann et al., 1984). Only participants with mild AD were included in this study; mild AD was defined as a global CDR of 0.5 or 1. Patients with mild AD were selected because the samples sizes for data from moderate to severe AD were too small for inclusion in factor analyses (n = 28 and n = 2, respectively, based on CDR ratings of 2 and 3).
There were 152 controls, 187 possible and probable MCI, and 82 possible and probable participants with mild AD that completed the VAMS. There were significant differences across the three groups in age and education, with the patient groups being older than controls and controls having more education than patient groups. Given that age and education might have an impact on the structure of self-report emotion data, and that it is difficult to statistically control for individual differences when making comparisons across exploratory factor analyses, subsets of participants from each group were selected to be matched for average age and education. The final sample consisted of 96 controls (33% male; 88% Non-Hispanic Caucasian), 159 persons diagnosed with MCI (39% male, 65% Non-Hispanic Caucasian), and 73 diagnosed with AD (49% male; 79% Non-Hispanic Caucasian) between the ages of 65 and 96 (Table 1).
Table 1.
Descriptive statistics for demographic, cognitive, disease severity and VAMS variables for controls, MCI, and AD
| CONTROLS (N = 96) |
MCI (N = 159) |
AD (N = 73) |
F (DF) | P | PARTIAL η2 |
|
|---|---|---|---|---|---|---|
| Age | 78.4 (5.8) | 77.5 (5.9) | 79.4 (6.1) | 2.6 (2,322) | 0.076 | 0.02 |
| Education (years) | 15.6 (2.6) | 14.7 (3.1) | 14.9 (3.0) | 2.5 (2,322) | 0.083 | 0.02 |
| MMSE | 29.2 (0.8) | 28.0 (1.6) | 24.1 (3.6) | 28.9 (2,322) | <0.001 | 0.15 |
| Global CDR | 0.0 (0.1) | 0.1 (0.2) | 0.8 (0.2) | 403.2 (2,322) | <0.001 | 0.72 |
| ADLs | 15.7 (0.9) | 15.3 (1.7) | 11.0 (3.8) | 118.0 (2,322) | <0.001 | 0.42 |
| IADLs | 12.0 (0.5) | 11.9 (0.8) | 11.4 (1.1) | 10.1 (2,322) | <0.001 | 0.06 |
| GDS | 1.1 (1.9) | 1.7 (2.1) | 2.5 (2.6) | 1.6 (2,322) | 0.194 | 0.01 |
| VAMS | ||||||
| Afraid | 7.3 (12.8) | 13.1 (18.3) | 17.6 (23.4) | 6.2 (2,322) | 0.002 | 0.04 |
| Confused | 10.6 (15.2) | 20.7 (23.6) | 40.2 (35.2) | 29.6 (2,322) | <0.001 | 0.16 |
| Sad | 7.3 (13.5) | 16.3 (24.0) | 17.8 (26.0) | 6.4 (2,322) | 0.002 | 0.04 |
| Angry | 4.6 (7.4) | 10.2 (14.5) | 13.5 (20.2) | 8.6 (2,322) | 0.002 | 0.05 |
| Tense | 17.8 (22.1) | 24.8 (27.5) | 30.4 (33.5) | 4.4 (2,322) | 0.013 | 0.03 |
| Tired | 31.1 (27.8) | 39.2 (32.1) | 43.4 (35.0) | 3.4 (2,322) | 0.032 | 0.02 |
| Energetic | 59.9 (29.6) | 49.6 (33.8) | 52.0 (34.1) | 3.0 (2,322) | 0.053 | 0.02 |
| Happy | 75.7 (27.8) | 68.7 (31.5) | 68.6 (29.4) | 1.8 (2,322) | 0.168 | 0.01 |
| PA | 68.2 (21.2) | 59.7 (25.5) | 59.1 (24.6) | 4.3 (2,322) | 0.014 | 0.03 |
| NA | 9.5 (10.3) | 16.9 (15.5) | 23.8 (19.3) | 18.4 (2,322) | <0.001 | 0.10 |
VAMS = Visual Analogue Mood Scale; MCI = Mild Cognitive Impairment; AD = Alzheimer’s disease; MMSE = Mini-Mental State Examination; CDR = Clinical Dementia Rating; ADLs = Activities of Daily Living; IADLs = Instrumental Activities of Daily Living; GDS = Geriatric Depression Scale; PA = Positive Affect (average of VAMS energetic, happy, and [reversed] tired); NA = VAMS Negative Affect (average of sad, confused, angry, tense, afraid).
Measures
Visual Analogue Mood Scale (VAMS)
The VAMS is a reliable and valid measure of current mood states (Stern, 1997). Items consist of eight simple, cartoon faces representing afraid, confused, sad, angry, energetic, tired, happy, and tense. Each item is composed of a 100-mm vertical line with a neutral face at the top and a face depicting a mood state at the bottom (Figure 1). Participants make a horizontal mark across the line to reflect their current mood, somewhere between neutral and the mood in question; stronger moods are marked closer to the mood expression and neutral moods are marked closer to the neutral face. The participant’s score is the distance of their mark from neutral and can range from 0 to 100, with higher scores indicating greater mood state. In controls and patients with neurologic disease, 15-minute test-retest intervals reveal good reliability (sad r = 0.83, afraid r = 0.84, energetic r = 0.44, happy r = 0.71, confused r = 0.43, angry r = 0.75, and tired r = 0.60; the tense scale was not included in this study). The scales exhibit convergent validity with other questionnaire measures of mood states, such as the Profile of Mood States (convergent r =0.39 to 0.69 in standardization samples, and r =0.49 to 0.80 in stroke patient samples), the Beck Depression Inventory (correlates with sad VAMS r = 0.53 to 0.54 in non-neurologic samples), and the State-Trait Anxiety Inventory (correlates with tense r = 0.66 in non-neurologic sample) (Stern, 1997). A Principal Components Analysis of the VAMS items in a large sample of controls indicated a two factor solution of NA (sad, angry confused, tense, afraid) and PA (energetic, happy, tired (reverse scored)) (Nyehius et al., 1997). That is, whereas high scores on happy and energetic indicate higher PA, a lower score on tired indicates higher PA; so tired is called a “reverse-scored” item.
Figure 1.

Sample item from the VAMS for anxiety. Reproduced by special permission of the Publisher, Psychological Assessment Resources, Inc., 16204 North Florida Avenue, Lutz, Florida 33549, from the Visual Analog Mood Scales by Robert A. Stern, Ph.D., Copyright 1988, 1990, 1997 by PAR, Inc., Further reproduction is prohibited without permission of PAR, Inc.
Mini Mental State Exam (MMSE)
The MMSE is a brief screening measure of cognitive function; scores range from 0 to 30, with higher scores reflecting better performance (Folstein et al., 1975). For the attention item, which can be variable, participants were asked to spell “world” backwards.
Clinical Dementia Rating Scale (CDR)
The CDR is a global rating of dementia severity (Hughes et al., 1982). The rating covers six domains of the patient’s cognitive and functioning performance including, memory, orientation, judgment and problem solving, community affairs, home and hobbies, and personal care (Hughes et al., 1982). The necessary information to make each rating is obtained through a semi-structured interview of the patient and a reliable informant, such as a family member. The patient is rated on a five-point scale (0 = healthy, 0.5 = very mild, 1 = mild, 2 = moderate, 3 = severe dementia) (Morris, 1993). In one study, inter-rater reliability was 0.62 (Rockwood et al. 2000).
Lawton-Brody ADL and IADLs
Activities of Daily Living (ALDs) and Instrumental Activities of Daily Living (IADLs) were measured by the 14-item Lawton and Brody scales (Lawton and Brody, 1969). The scales measures independence in performing various activities of daily life, from ADLs (e.g., personal hygiene, eating) to IADLs (e.g., driving, meal preparation, financial management). Patient performance of each activity is rated on a 3-point scale (2 = independence, 1 = need for assistance, 0 = dependence); thus, higher scores reflect more independent in functioning. Informants provided ratings of ADLs and IADLs. Inter-rater reliability of IADL items was strong (r = 0.85); reliability of ADLs items is not available. Validity was determined by comparing IADL ratings to four separate measures of functional and cognitive status and convergent correlations ranged from 0.40 to 0.61.
Geriatric Depression Scale – Short version (GDS)
Self-reported symptoms of depression were assessed with the short-form (15-item) version of the GDS (Sheikh and Yesavage, 1986). Items were read to participants and yes/no responses were recorded by the interviewer. The GDS has good reliability and validity as a screening measure for depressive symptoms in community-dwelling and clinical samples (Aikman and Oehlert, 2001). The GDS was administered in an interview format to participants and symptoms were coded by the clinician; thus, the GDS reflects self-reported depressive symptoms.
Data analyses
Preliminary analyses involved MANOVAs to compare the three groups on demographic variables and mean VAMS scores; follow-up contrasts, when indicated, were calculated with the Tukey test. Alpha of 0.01 was used to indicate statistical significance to correct for multiple comparisons. The primary analyses were Exploratory Factor Analyses (EFAs) to determine the factor structure of self-report affect in the three groups (i.e., controls, persons with MCI, persons with mild AD) and to test for the comparability of the factor structures across groups. EFAs are well suited for initial analyses of the factor structure of an instrument and to date, no EFA studies have been conducted with the VAMS. As mentioned above, there was only one previous PCA study (Nyehius et al., 1997) with control data that yielded a two-factor solution.
Results
Descriptive Statistics for Demographic and Disease Variables
Participants averaged about 78 years of age across the three groups, with 14 to 15 years of education (Table 1). A MANOVA tested for group differences in age, education, MMSE, global CDR, ADLs, IADLs, and GDS. The overall model was significant (Wilks’ Lambda = 0.26, F (14, 632) = 44.16, p < 0.001). The groups differed significantly on the MMSE (p < 0.001), global CDR (p < 0.001), ADLs (p<0.001), and IADLs (p<0.001). Followup contrasts indicated that mean MMSE was lower in persons with AD than persons with MCI (p <0.001) and controls (p < 0.001) and mean MMSE was lower in MCI than controls (p=0.001). Global CDR was lower in persons with AD than persons with MCI (p<0.001) and controls (p<0.001) and it was lower in persons with MCI than controls (p=0.001). ADLs were significantly lower in persons with AD than persons with MCI (p < 0.001) and controls (p < 0.001). IADLs were significantly lower in persons with AD than persons with MCI (p = 0.001) and controls (p < 0.001). Partial η2 values indicate the effect sizes for significant group differences were small (for IADLs), medium (for MMSE), and large (for Global CDR and ADLs) (Cohen, 1992).
Group Differences for VAMS Scores
A MANOVA tested for group differences on VAMS items. The overall model was significant (Wilks’ Lambda = 0.80, F (16, 630) = 4.72, p <0 .001). The groups differed significantly for afraid (p =0.002), confused (p < 0.001), sad (p = 0.002), and angry (p < 0.001). Follow-up contrasts indicated that persons with AD reported significantly higher scores on afraid than controls (p = 0.001). Persons with AD also had significantly higher scores for confused than persons with MCI (p < 0.001) and controls (p < 0.001). Further, persons with MCI reported significantly higher scores for confused than controls (p=0.005). Controls reported significantly lower scores for sad than persons with AD (p =0.007) and persons with MCI (p=0.005). Controls also reported significantly lower scores for angry than persons with AD (p<0.001) and persons with MCI (p = 0.008). Effect sizes for significant group differences were small (for afraid, sad, and angry) and medium (for confused) (Cohen, 1992).
Based on a previous PCA (Nyehius et al., 1997) (which is supported by results of factor analyses in the current data, reported below), PA (happy, energetic, reverse-score tired) and NA (angry, sad, confused, tense, afraid) scores were calculated. The overall ratio of average NA to average PA (Figure 2) was less favorable in persons with AD relative to the other groups. A MANOVA tested for group differences in NA and PA. The overall model was significant (Wilks’ Lambda = 0.89, F (4, 642) = 9.58, p < 0 .001). Follow-up contrasts indicated that persons with AD reported significantly greater NA than persons with MCI (p = 0.005) and controls (p < 0.001) and the effect size was small to medium.
Figure 2.
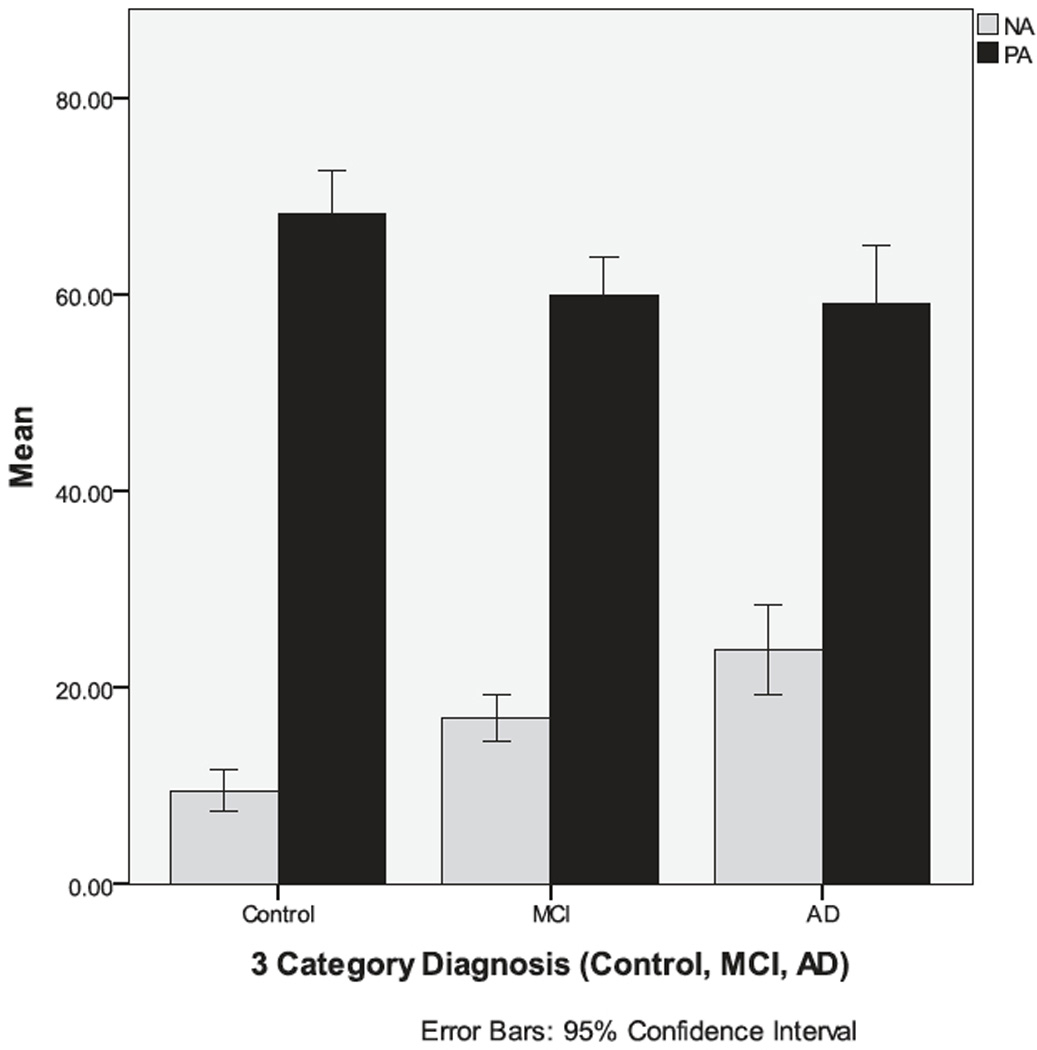
Participants with Alzheimer’s disease report significantly more NA than persons with MCI or control participants.
Internal Consistency Reliabilities and PA-NA Convergence
Internal consistency reliabilities indicate how well items measure the same construct. For the five NA items, internal consistencies were adequate and comparable for all three groups (controls α = 0.73, MCI α = 0.74, AD α = 0.72). Consistencies were less strong, due the short length of the scale at only three items, but highly similar for the three PA items (controls α = 0.60, MCI α = 0.69, AD α = 0.60). PA and NA correlations were negative for all three groups (controls r = −0.31, p = .002; MCI r = −0.38, p=<.001; AD r= −0.25, p=.037). Using an r-to-z transformation followed by a t-test on the z-scores, the differences between these correlations were not statistically significant.
Convergent and Discriminant Validity of Self-Report Mood
The VAMS assesses current mood. The GDS measures self-reported depressive symptoms over the past week. It is possible that current mood could be related to recent depressive symptoms and Pearson correlations were calculated to test this hypothesis. Overall, for controls, the GDS was significantly and positively correlated with VAMS sad, angry, and tense and significantly negatively correlated with energetic and happy (Table 2). Associations were less often significant for persons with MCI and AD; neither patient group exhibited a significant association between VAMS sad and the GDS. But for persons with AD, GDS was significantly and inversely associated with VAMS happy.
Table 2.
Correlations between VAMS Items and the GDS and MMSE for controls, MCI, and AD
| CONTROLS | MCI | MILD AD | ||||
|---|---|---|---|---|---|---|
| ITEM | GDS | MMSE | GDS | MMSE | GDS | MMSE |
| Afraid | 0.26 | 0.01 | 0.19 | −0.02 | 0.13 | 0.04 |
| Angry | 0.42* | 0.01 | 0.12 | 0.02 | 0.17 | −0.03 |
| Sad | 0.52* | 0.39* | 0.15 | −0.06 | 0.07 | −0.02 |
| Tense | 0.49* | 0.18 | 0.19 | −0.25* | 0.07 | 0.16 |
| Confused | 0.06 | 0.16 | 0.24* | −0.20 | 0.08 | 0.04 |
| Energetic | −0.27* | −0.04 | −0.11 | 0.05 | −0.16 | −0.21 |
| Tired | 0.17 | −0.02 | −0.02 | −0.05 | 0.12 | 0.22 |
| Happy | −0.37* | −0.06 | −0.06 | −0.05 | −0.25* | −0.13 |
Note. VAMS = Visual Analogue Mood Scales; GDS = Geriatric Depression Inventory; MMSE = Mini-Mental State Examination; MCI = Mild Cognitive Impairment, AD = Alzheimer’s Disease.
p < 0.01.
Associations between the VAMS and MMSE were explored; few significant associations were expected because previous studies that have not found links between cognitive and emotional (e.g., QOL) measures in persons with AD and MCI (Logsdon et al. 2002; Ready et al. 2004). Indeed, there were only two significant correlations between the MMSE and VAMS data (Table 2).
Exploratory Factor Analyses (EFA) on VAMS Data
All EFAs were run with varimax rotation, based on the putative orthogonal association between PA and NA (Watson and Tellegen, 1985) and were based on analysis of the correlation matrix. The first model was run on control data. Inspection of the scree plot indicated an “elbow” at the 2nd factor and there were two eigenvalues greater than one (1st = 2.99, 37.4% of the variance; 2nd = 1.46, 18.2% of the variance), supporting a two-factor solution. Further, when three factors were extracted, the third factor was defined by a primary loading from only one item (e.g., confused); the third factor accounted for an additional 12.0% of the common variance. The two-factor solution was best because a factor is not defined by a single item. For persons with MCI and mild AD, EFAs were conducted separately, the two-factor solutions also appeared to be best. For both analyses, there was again an “elbow” at the 2nd factor on each scree plot and each had two eigenvalues greater than one (MCI eigenvalues = 3.12 (39% of the variance) and 1.35 (16.9% of the variance); AD eigenvalues = 2.76 (34.5% of the variance) and 1.59 (19.9% of the variance)). Further, when a third factor was extracted for MCI, it was a mixed factor, defined by high anger and low happiness, which accounted for 10.3% of the common variance. For AD, when three factors were extracted, the third factor was defined by a salient loading from only one item (i.e., confused) and accounted for 14.9% of the variance. Thus, for patient data, three factor solutions were mixed valence or singular; two-factor solutions were more homogenous.
For the two-factor solutions in all three groups, the first factor was an NA factor, which was defined by strong and primary loadings from five VAMS items: afraid, angry, sad, tense, and confused (Table 3). The second factor was a PA factor and was defined by primary loadings from: energetic, tired (indicating low PA), and happy. There was one cross-loading greater than 0.30 in each group (i.e. tense for controls, sad for MCI, and tired for AD). For Controls and MCI, the PA factor was reversed because a high score indicated low PA; the opposite was true for AD. The sign reversal does not interfere with comparison of results of across groups.
Table 3.
Exploratory factor analyses of VAMS Items for controls, MCI, and AD
| CONTROLS | MCI | MILD AD | ||||
|---|---|---|---|---|---|---|
| ITEM | NA | (REV) PA | NA | (REV) PA | NA | PA |
| Afraid | 0.75 | −0.04 | 0.68 | 0.14 | 0.79 | 0.18 |
| Angry | 0.79 | 0.11 | 0.51 | 0.25 | 0.42 | −0.04 |
| Sad | 0.72 | 0.19 | 0.58 | 0.32 | 0.83 | −0.11 |
| Tense | 0.53 | 0.36 | 0.60 | 0.13 | 0.57 | −0.22 |
| Confused | 0.35 | 0.16 | 0.61 | 0.06 | 0.44 | −0.17 |
| Energetic | −0.06 | −0.65 | −0.04 | −0.73 | 0.04 | 0.83 |
| Tired | 0.06 | 0.51 | 0.20 | 0.55 | 0.37 | −0.49 |
| Happy | −0.24 | −0.55 | −0.28 | −0.63 | −0.05 | 0.43 |
MCI = mild cognitive impairment; AD = Alzheimer’s disease; NA = negative affect; PA = positive affect; Rev = reversed (i.e. factor is defined by low PA rather than high PA). Loadings greater than 0.30 are in bold.
Thus upon visual inspection, the patterns of factor loadings appear to be highly consistent across groups (Table 3) but we tested this hypothesis be with quantitative methods. To assess factor similarity, the factor scores generated by each solution were correlated (Everett, 1983). To calculate factor scores, a set of regression-based weights were generated separately from the factor analyses on data from persons with AD, MCi, and controls, and these weights were applied to the item-level data to calculate factor scores for each participant. Thus, six factor scores were generated for each participant: three NA factor scores (one each from the factor weights for the NA factor from control, persons with MCI, and persons with AD data) and three PA factor scores (one each from the factor weights for the PA factor from control, MCI, and AD data). Calculating and correlating factor scores is a well-established way to quality factor reliability (Everett, 1983; Watson et al., 2008).
For PA, the factor scores from the three sets of factor weights inter-correlated 0.94 to 0.97. For NA, associations were similarly strong, with inter-correlations ranging from 0.93 to 0.95. Everett (1983) suggested that a correlation of 0.90 or greater indicates that the factors converge with one another; thus, there is good quantitative support that the factor solutions between the three groups are convergent.
However, convergence does not imply perfect similarity. An interesting finding from the factor score convergence analyses suggested group differences in associations between PA and NA. NA and PA factor scores that were calculated based on weights from persons with AD were significantly and negatively associated (r = −0.23, p < 0.001), whereas NA and PA factor scores from the control weights were positively associated (r = 0.21, p < 0.001); the association for persons with MCI weights was near zero (r = 0.04, p = 0.52). All of these correlations are statistically significantly different (ts = −2.21 to −5.70, df = 324, ps < .05). The correlation for persons with AD differed significantly from controls (t = 2.87, df = 166, p = 0.004).
Another way to determine the similarity of factor solutions is to compute congruence correlation coefficients between factor loadings. This analysis involves correlating factor loadings between groups and could indicate, for example, if loadings for two of the three groups were more convergent than for the other group. Again, overall, correspondence between the NA and PA factor solutions were strong. The only value below 0.90 was the correlation between Control NA loadings and NA loadings from persons with AD (r = 0.88) but it was not significantly different than the convergence for the other two groups (r = 0.90 and r = 0.91). The PA factor loadings correlated 0.92 to 0.97.
Again, however, cross-domain differences emerged. Loadings from persons with AD for PA and NA correlated −0.56, whereas the associations between loadings for PA and NA were positive for controls (r = 0.53) and those with MCI (r = 0.71). Due to the small number of observations (n = 8 items), significance tests were not run between these correlations. However, it does appear that the structure of emotion from persons with AD is more bipolar with regard to NA and PA than for the other two groups.
Discussion
Persons with mild AD report more confusion and current negative emotions than persons with MCI and community-dwelling older adults without cognitive impairment. Before the implications and significance of these data are discussed, the reliability and validity of the data are addressed.
Overall, as in previous studies, the internal consistency reliability of data provided by participants with mild AD and MCI are comparable to controls (Brod et al. 1999; Logsdon et al., 2002; Ready et al., 2004). Results of validity analyses were less clear. State mood was compared to self-reported depressive symptoms over the past week, measures which could be related to a degree but would not be expected to be highly overlapping (Meyer and Shack, 1989). For controls, there was better evidence for convergent validity than for the patient groups, but in AD, depressive symptoms were negatively associated with happiness.
There is some suggestion from other studies that mood in persons with AD might be more reactive to the environment than for controls (Kolanowski et al., 2007). Mood in the current study was measured during an annual evaluation at an academic AD center, which can be unsettling, especially for persons who have cognitive impairment. It is possible that mood reported by AD during the evaluation was less related to their mood over the past week because they were more reactive to the particular situation; the same might be true for persons with MCI. It is also possible that self-reported depressive symptoms over the past week were less reliable and valid in persons with AD and MCI because this reporting relied upon retrospective recall which is known to be impaired in these groups. Clearly, comparing state mood and mood over the past week is a limited gauge of validity for persons with AD and MCI.
Thus, validity also was assessed from another perspective. The construct invariance of the VAMS was compared in controls and patients using factor analytic techniques. Results of EFAs on self-report mood data from controls, persons with MCI, and persons with AD were strikingly similar and suggested that persons with AD provided affect data that exhibited a highly convergent structure to that of cognitively intact older adults. The structure of the mood ratings also was highly convergent with major theoretical models about the structure of affect, which is defined by the two major dimensions of positive and negative affect (Watson and Clark, 1992). The similarity in factor structure of emotion ratings supports comparisons of mean ratings across the three groups because similar constructs are assessed in each group.
Emotional Experience in AD
Persons with mild AD reported more negative emotions and particularly more confusion than the other two groups. It makes intuitive sense that life for a person with mild AD would be confusing. Living with cognitive impairment characterized by an amnestic syndrome would undoubtedly cause confusion and persons with mild AD, overall, endorsed this experience. This finding speaks to the validity of self-report emotion in AD.
Thus, persons with AD appear to be characterized by greater current negativity and confusion relative to cognitively healthy older adults. Further, PA and Na might be more intimately connected in persons with AD than persons with MCI and controls. Interventions to improve current emotional well-beings in persons with AD could be based on this knowledge. For example, interventions to decrease negative emotional experiences and particularly confusion and/or to build on positive emotional experiences, would all lead to the common outcomes of a more optimal balance of PA to NA. Further, there is evidence among persons with amnestic syndromes that moods, once induced, can be sustained over time (Feinstein et al., 2010). Thus, simple interventions that boost positive moods (e.g., familiar music, family visits, walks in the garden) could have effects that persist even when the enjoyable activity comes to an end. Caregivers who feel there is little they can do to help their loved one with AD might be heartened to know that if they can identify things to lower negative moods or to increase positive moods, they may indeed be having an important effect on the patient’s emotional well-being.
More work is needed to identify effective therapies for modifying PA and NA in persons with AD. One study found that interventions to reduce negative disruptive behaviors in nursing home residents (e.g. aggression) had no significant impact on the negative behaviors but did increase PA (Beck et al., 2002). However, few studies have included PA and NA as outcome measures and thus the potential synergy between these outcomes is unknown.
MCI as a Transitional State between Controls and AD
MCI is a somewhat controversial label and a construct that is variably defined (Petersen et al., 2009). MCI is often conceptualized as a transitional state between cognitive health and dementia. For example, popular diagnostic criteria for MCI rely on cognitive and functional assessments (Winblad et al., 2004). In general, persons with MCI tend to have one or more areas of cognitive impairment (variably defined) relative to controls but exhibit minimal, if any, impairment in activities of daily living.
Results of the current study suggest that persons with MCI could be transitional between community-dwelling adults and persons with mild AD with regards to emotional variables. When group differences in reported emotion were manifest, persons with MCI tended either to have intermediate values between controls and persons with mild AD or to exhibit some emotions similar to one group and some more similar to the other group. For example, persons with MCI were more confused than controls but not as confused as persons with AD. Persons with MCI were more similar to persons with AD than controls for sadness and anger but their scores for afraid were more consistent with controls than persons with AD.
An interesting question, then, is how greater NA relates to processes that cause cognitive impairment. There are little data to suggest that greater NA is a reaction to receiving a diagnosis of MCI or AD (Heun et al., 2002). There are more data to suggest that changes in affect may be a risk for cognitive decline or may occur concomitant with neurodegeneration. NA often precedes cognitive decline in older adults (e.g. Sun et al., 2008). Heun et al. (2002) tested several hypotheses about the association between depression and AD and found support for the hypothesis that depression in dementia is related to neurobiological degeneration that causes the cognitive decline. In fact, depression in persons with amnestic-MCI is associated with significantly increased risk of progressing to AD (Palmer et al., 2010). Whereas the current study measured NA and not depressive symptoms per se, our data converge with other studies to suggest that adverse emotional change may accompany cognitive decline.
Limitations
The current results were based on cross-sectional data. Thus, any discussion of “transitional states” in persons with MCI should not be interpreted to indicate a developmental progression at this point. Longitudinal data are needed to better elucidate how emotions in persons with MCI relate to those in community-dwelling adults and persons with AD.
There are other limitations to the current study. First, it would have strengthened the project to have more measures of current affect, such as informant or observer reports, to further explore the convergent and discriminant validity of self-report data. Second, assessing current affect in different environmental contexts could have been useful in determining if indeed persons with AD are more reactive to their environments, particularly with regard to NA. Third, the measure of current affect was brief and limited. In some respects, measurement brevity is an asset for persons with dementia, in so far as the assessment is more accessible to more persons, but inevitably, conclusions that can be drawn are limited. Fourth, generalizability of findings is limited to persons who had an informant available and were willing to participate in the study. Finally, the sample was insufficient to follow the exploratory factor analyses with confirmatory factor analyses (CFA) to determine the construct invariance of PA and NA more thoroughly in the three groups. We will continue to collect data and conduct CFAs in future, larger, independent samples.
Conclusions
Our data support and extend the notion that persons with mild AD can report about their current moods and these data could be extremely valuable because persons with dementia may live more in the “here and now” than persons without memory loss (Kolanowski et al., 2007). Efforts to reduce confusion and other negative emotions may be potent interventions to improve well-being and life quality in persons with AD and they may also boost positive moods. Persons with MCI may be in somewhat better emotional health relative to persons with AD but also may be faring less well than controls; thus, greater attention to the emotional health of persons with MCI is also warranted. In future work, it will be informative to determine the nature of self-report emotion data from moderate to severly impaired patients.
Footnotes
Conflict of Interest
None.
Description of authors’ roles
R. Ready designed the study, conducted analyses, and drafted and edited the paper. J. Carvalho assisted with data analyses and editing the paper. R. Stern assisted with design of the study, data collection, preparation of data for analyses, and editing of the paper. B. Gavett assisted with data collection, preparation of data for analyses, and editing of the paper. R. Green assisted with data collection and editing of the paper.
Exploratory Factor Analyses (EFAs) were run on the data to establish the factor structure of the data. Confirmatory Factor Analyses (CFAs) are best suited to test the invariance of a theoretical structure across groups, once this structure has been identified. However, because there are no previous factor analytic studies of the VAMS data, we start with EFAs in this paper. Unfortunately, our samples were not large enough to split for an EFA followed by a CFA in independent data. CFAs are planned for the next phase of this study, when more data are collected.
Depressive symptoms were low in all groups but were significantly greater in mild AD than MCI and Controls. Thus, an ANCOVA to test for group differences on VAMS items was run, controlling for GDS score. GDS was a significant covariate for all NA items (Fs (1,320) = 4.27 to 8.52, ps < .05) but not for PA items (Happy, Energetic, Tired). After controlling for GDA scores, group differences remained for all NA items and Tired, with mild AD scoring significantly (ps < .05) higher than controls. MCI were still significantly more confused (p < .001) than controls.
GDS scores also were entered as a covariate in an ANCOVA, comparing PA and NA in all three groups. GDS was a significant covariate for NA (F(1,304) = 14.1, p < .001) but after controlling for GDS, the significant group differences on PA and NA were the same.
References
- 1.Federal Drug Administration. [Access 2006];Guidance for industry patient-reported outcome measures: Use in medical product development to support labeling claims. 2006 doi: 10.1186/1477-7525-4-79. http://www.fda.gov/cder/guidance/5460dft.htm. [DOI] [PMC free article] [PubMed]
- 2.Feinstein JS, Duff MC, Tranel D. Sustained experience of emotion after loss of memory in patients with amnesia. Proceedings of the National Academy of Sciences. 2010 doi: 10.1073/pnas.0914054107. Early Edition. [DOI] [PMC free article] [PubMed] [Google Scholar]
- 3.Bucks RS, Radford SA. Emotion processing in Alzheimer's disease. Aging & Mental Health. 2004;8:222–232. doi: 10.1080/13607860410001669750. [DOI] [PubMed] [Google Scholar]
- 4.Brod M, Stewart AL, Sands L, et al. Conceptualization and measurement of quality of life in dementia: The dementia quality of life instrument (DQoL) The Gerontologist. 1999;39:25–35. doi: 10.1093/geront/39.1.25. [DOI] [PubMed] [Google Scholar]
- 5.Sands LP, Ferreira P, Stewart AL, et al. What explains differences between dementia patients' and their caregivers' ratings of patient's quality of life? American Journal of Geriatric Psychiatry. 2004;12:272–280. [PubMed] [Google Scholar]
- 6.Ready RE, Ott BR, Grace J. Patient versus informant perspectives of quality of life in Mild Cognitive Impairment and Alzheimer's disease. International Journal of Geriatric Psychiatry. 2004;19:256–265. doi: 10.1002/gps.1075. [DOI] [PubMed] [Google Scholar]
- 7.Shin IS, Carter M, Masterman D, et al. Neuropsychiatric symptoms and quality of life in Alzheimer's disease. American Journal of Geriatric Psychiatry. 2005;13:469–474. doi: 10.1176/appi.ajgp.13.6.469. [DOI] [PubMed] [Google Scholar]
- 8.Logsdon RG, Gibbons LE, McCurry SM, et al. Assessing quality of life in older adults with cognitive impairment. Psychosomatic Medicine. 2002;64:510–519. doi: 10.1097/00006842-200205000-00016. [DOI] [PubMed] [Google Scholar]
- 9.Kolanowski A, Hoffman L, Hofer SM. Concordance of self-report and informant assessment of emotional well-being in nursing home residents with dementia. Journal of Gerontology. 2007;62B:P20–P27. doi: 10.1093/geronb/62.1.p20. [DOI] [PubMed] [Google Scholar]
- 10.Lawton MP, Kleban MH, Dean J, et al. The factorial generality of brief positive and negative affect measures. Journals of Gerontology. 1992;47:P220–P237. doi: 10.1093/geronj/47.4.p228. [DOI] [PubMed] [Google Scholar]
- 11.Crawford JR, Henry JD. The Positive and Negative Affect Schedule (PANAS): Construct validity, measurement properties and normative data in a large non-clinical sample. British Journal of Clinical Psychology. 2004;43:245–265. doi: 10.1348/0144665031752934. [DOI] [PubMed] [Google Scholar]
- 12.Kercher K. Assessing subjective well-being in the old-old. Research on Aging. 1992;14:131–168. [Google Scholar]
- 13.Mackinnon A, Jorm AF, Christensen H, et al. A short form of the Positive and Negative Affect Schedule: Evaluation of factorial validity and invariance across demographic variables in a community sample. Personality and Individual Differences. 1999;27:405–416. [Google Scholar]
- 14.Kunzmann U, Little TD, Smith J. Is age-related stability of subjective well-being a paradox? Cross-sectional and longitudinal evidence from the Berlin Aging Study. Psychology and Aging. 2000;15:511–526. doi: 10.1037//0882-7974.15.3.511. [DOI] [PubMed] [Google Scholar]
- 15.Stern RA. Visual Analogue Mood Scales: Professional Manual. Odessa, FL: Psychology Assessment Resources; 1997. [Google Scholar]
- 16.Temple RO, Stern RA, Latham J, et al. Assessment of Mood State in Dementia by Use of the Visual Analog Mood Scales (VAMS) American Journal of Psychiatry. 2004;12:527–530. doi: 10.1176/appi.ajgp.12.5.527. [DOI] [PubMed] [Google Scholar]
- 17.Nyehius DL, Stern RA, Yamamoto C, et al. Standardization and validation of the Visual Analog Mood Scales. The Clinical Neuropsychologist. 1997;11:407–415. [Google Scholar]
- 18.Arruda JE, Stern RA, Somerville JA. Measurement of mood states in stroke patients: Validation of the visual analogue mood scales. Archives of Physical Medicine and Rehabilitation. 1999;80:676–680. doi: 10.1016/s0003-9993(99)90171-5. [DOI] [PubMed] [Google Scholar]
- 19.Ashendorf L, Jefferson AL, O'Connor MK, et al. Trail Making Test errors in normal aging, mild cognitive impairment, and dementia. Archives of Clinical Neuropsychology. 2008;23:129–137. doi: 10.1016/j.acn.2007.11.005. [DOI] [PMC free article] [PubMed] [Google Scholar]
- 20.Jefferson AL, Wong S, Bolen E, et al. Cognitive correlates of HVOT performance differ between individuals with mild cognitive impairment and normal controls. Archives of Clinical Neuropsychology. 2006;21:405–412. doi: 10.1016/j.acn.2006.06.001. [DOI] [PMC free article] [PubMed] [Google Scholar]
- 21.McKhann G, Drachman D, Folstein MF, et al. Clinical diagnosis of Alzheimer's disease: Report of the NINCDS-ADRDA Work Group under the auspices of the Department of Health and Human Services Task Force on Alzheimer's disease. Neurology. 1984;34:939–944. doi: 10.1212/wnl.34.7.939. [DOI] [PubMed] [Google Scholar]
- 22.Morris JC. The clinical dementia rating (CDR): Current version and scoring rules. Neurology. 1993;43:2412–2414. doi: 10.1212/wnl.43.11.2412-a. [DOI] [PubMed] [Google Scholar]
- 23.Ready RE, Vaidya JG, Watson D, et al. Age group differences in the structure of positive and negative affect. doi: 10.1080/13607863.2011.562184. In preparation. [DOI] [PubMed] [Google Scholar]
- 24.Stern RA. Visual Analog Mood Scales (VAMS) Professional Manual. Odessa, FL: Psychological Assessment Resources, Inc.; 1997. [Google Scholar]
- 25.Folstein MF, Folstein SE, McHugh PR. 'Mini-Mental State' A practical method for grading the cognitive state of patients for the clinician. Journal of Psychiatry Research. 1975;12:189–198. doi: 10.1016/0022-3956(75)90026-6. [DOI] [PubMed] [Google Scholar]
- 26.Hughes CP, Berg L, Danziger WL, et al. A new clinical scale for the staging of dementia. British Journal of Psychiatry. 1982;140:566–572. doi: 10.1192/bjp.140.6.566. [DOI] [PubMed] [Google Scholar]
- 27.Lawton MP, Brody EM. Assessment of older people: Self-maintaining and instrumental activities of daily living. The Gerontologist. 1969;9:179–186. [PubMed] [Google Scholar]
- 28.Sheikh JI, Yesavage JA. Geriatric Depression Scale (GDS): Recent evidence and development of a shorter version. Clinical Gerontologist. 1986;37:819–820. [Google Scholar]
- 29.Arthur A, Jagger C, Lindesay J, et al. Using an annual over-75 health check to screen for depression: Validation of the short Geriatric Depression Scale (GDS15) within general practice. International Journal of Geriatric Psychiatry. 1999;14:431–439. [PubMed] [Google Scholar]
- 30.Almeida OP, Almeida SA. Short versions of the geriatric depression scale: A study of their validity for the diagnosis of a major depressive episode according to ICD-10 and DSM-IV. International Journal of Geriatric Psychiatry. 1999;14:858–865. doi: 10.1002/(sici)1099-1166(199910)14:10<858::aid-gps35>3.0.co;2-8. [DOI] [PubMed] [Google Scholar]
- 31.Pedraza O, Dotson VM, Willis FB, et al. Internal consistency and test-retest stability of the Geriatric Depression Scale-Short Form in African American older adults. Journal of Psychopathology and Behavioral Assessment. 2009;31:412–416. doi: 10.1007/s10862-008-9123-z. [DOI] [PMC free article] [PubMed] [Google Scholar]
- 32.Aikman GG, Oehlert ME. Geriatric Depression Scale: Long form versus short form. The Journal of Aging and Mental Health. 2001;22:63–70. [Google Scholar]
- 33.Gorsuch RL. Factor Analysis. 2nd Edition. Hillsdale, NJ: Erlbaum; 1983. [Google Scholar]
- 34.Everett JE. Factor comparability as a means of determining the number of factors and their rotation. Multivariate Behavioral Research. 1983;18:197–218. doi: 10.1207/s15327906mbr1802_5. [DOI] [PubMed] [Google Scholar]
- 35.Watson D, Clark LA, Weber K, et al. Testing a tripartite model: II. Exploring the symptom structure of anxiety and depression in student, adult, and patient samples. Journal of Abnormal Psychology. 1995;104:15–25. doi: 10.1037//0021-843x.104.1.15. [DOI] [PubMed] [Google Scholar]
- 36.Dindo L, McDade-Montez E, Sharma L, et al. Development and initial validation of the Disinhibition Inventory (DIS-I): A multifaceted measure of disinhibition. Assessment. 2009;16:274–291. doi: 10.1177/1073191108328890. [DOI] [PubMed] [Google Scholar]
- 37.Watson D, Clark LA, Chmielewski M. Structures of personality and their relevance to psychopathology. II. Further articulation of a comprehensive unified trait structure. Journal of Personality. 2008;76:1545–1586. doi: 10.1111/j.1467-6494.2008.00531.x. [DOI] [PubMed] [Google Scholar]
- 38.Watson D, Clark LA. On traits and temperament: General and specific factors of emotional experience and their relations to the five factor model. Journal of Personality. 1992;60:443–476. doi: 10.1111/j.1467-6494.1992.tb00980.x. [DOI] [PubMed] [Google Scholar]
- 39.Petersen RC, Morris JC. Mild Cognitive Impairment as a Clinical Entity and Treatment Target. Archives of Neurology. 2005;62:1160–1163. doi: 10.1001/archneur.62.7.1160. [DOI] [PubMed] [Google Scholar]