Abstract
Efficacy exposure–response relationships of the CCR5 antagonist maraviroc were evaluated across two phase III clinical trials. This post-hoc analysis used 48-week efficacy data from 841 treatment-experienced patients infected with CCR5-tropic human immunodeficiency virus type 1 (HIV-1), identified by the enhanced sensitivity Trofile assay. Probability of treatment success (viral RNA <50 copies/ml) was modeled using generalized additive logistic regression, testing exposure, clinical, and virologic variables. Prognostic factors for treatment success (in decreasing order of Akaike information criterion (AIC) change) were: maraviroc treatment, high-weighted overall susceptibility to background treatment, absence of an undetectable maraviroc concentration, high baseline CD4 count (BCD4), low viral load (VL), race (other than black), absence of non-R5 baseline tropism (BTRP), and absence of fosamprenavir (FPV). No concentration–response relationship was found with treatment (maraviroc vs. placebo) and presence/absence of undetectable maraviroc concentration (adherence marker) in the model. The maraviroc doses studied (300 or 150 mg with potent CYP3A4 inhibitors once (q.d.)/twice daily (b.i.d.)) deliver concentrations near the top of the concentration–response curve.
Maraviroc is a reversible and selective antagonist of the human chemokine receptor CCR5.1 It is the only entry inhibitor that has been approved in combination with other antiretroviral agents to treat patients infected with CCR5-tropic human immunodeficiency virus type 1 (HIV-1). This approval was based on two studies, MOTIVATE 1 (NCT00098306) and MOTIVATE 2 (NCT00098722).2 The studies were conducted in heavily treatment-experienced patients who not only had complex medical and treatment histories but also were taking many concomitant medications (including optimized background therapy) with potential pharmacokinetic (PK) and pharmacodynamic (PD) interactions, which could affect exposure–response relationship and clinical outcome.
The term “curse of dimensionality” was coined by Richard Bellman to describe the problem caused by the exponential increase in volume associated with adding dimensions to a mathematical space.3 In the context of building a model to predict clinical response to antiretrovirals and other anti-infectives, including maraviroc, the curse of dimensionality means that as the number of potential predictors increases it becomes harder to find the best model. By convention, established PK/PD analysis methods/models assume that concentration is the main driver of response. This might not necessarily be the case, especially if the dose(s) deliver concentrations toward the top (or bottom) of the concentration–response curve. It has long been recognized that clinical response is not solely dependent on PK, but there are many other factors relating to the status of the HIV-positive patient that also play a role.4,5 This has clearly been shown to be the case for maraviroc particularly when focusing on overall virologic success.2 For this reason, generalized additive models (GAMs) were employed to characterize the influence of prognostic factors (including exposure parameters) on sustained virologic response and incidence of anemia in patients with chronic hepatitis C6 and in HIV-1–infected patients in the etravirine phase III clinical studies.7 GAMs allow potential predictors to enter linearly or nonlinearly, as appropriate for each case.
In the MOTIVATE 1 and MOTIVATE 2 studies, after 48 weeks' treatment, more patients receiving maraviroc once (q.d.) or twice daily (b.i.d.) with optimized background treatment (OBT) had HIV-1 RNA levels <50 copies/ml than those treated with OBT alone (MOTIVATE 1: 42 and 47% vs. 16% MOTIVATE 2: 45 and 45% vs. 18%, respectively).2 Subgroup analyses of the data pooled from both the MOTIVATE studies were performed and the results of the multivariate logistic regression modeling showed that virologic response at week 48 of maraviroc administration was significantly related to race, viral load (VL) at screening, CD4 cell count, and OBT containing enfuvirtide (first use).8 Subgroup analysis of the MOTIVATE studies was extended to examine weighted OBT susceptibility score category (WOBTSSC), derived by combining genotypic or phenotypic resistance data with prior drug use, to assess OBT activity.9 This logistic regression analysis showed that genotypic and phenotypic weighted scores were better at predicting response than counting active drugs. However, no measures of maraviroc PK/exposure were included in these published subgroup analyses.
A previously reported prespecified GAM analysis (performed at 24 weeks) for the endpoint of probability of failure (HIV RNA >50 copies/ml; missing = failure) found a sigmoid-type exposure–response relationship in addition to other disease and virologic factors.10 This analysis did not, as planned, use pill counts as an adherence measure in the models because available pill-count data were thought to be unreliable. The objectives of this post-hoc 48-week GAM analysis were to assess exposure–response relationship and other possible predictive factors, as before. However, the concentration-based variables were derived without PK samples below the limit of quantification (BLQ) and an additional covariate, presence/absence of one or more such samples (assumed to result from ≥3 consecutive/clustered missed doses) was included to account for poor adherence.
Results
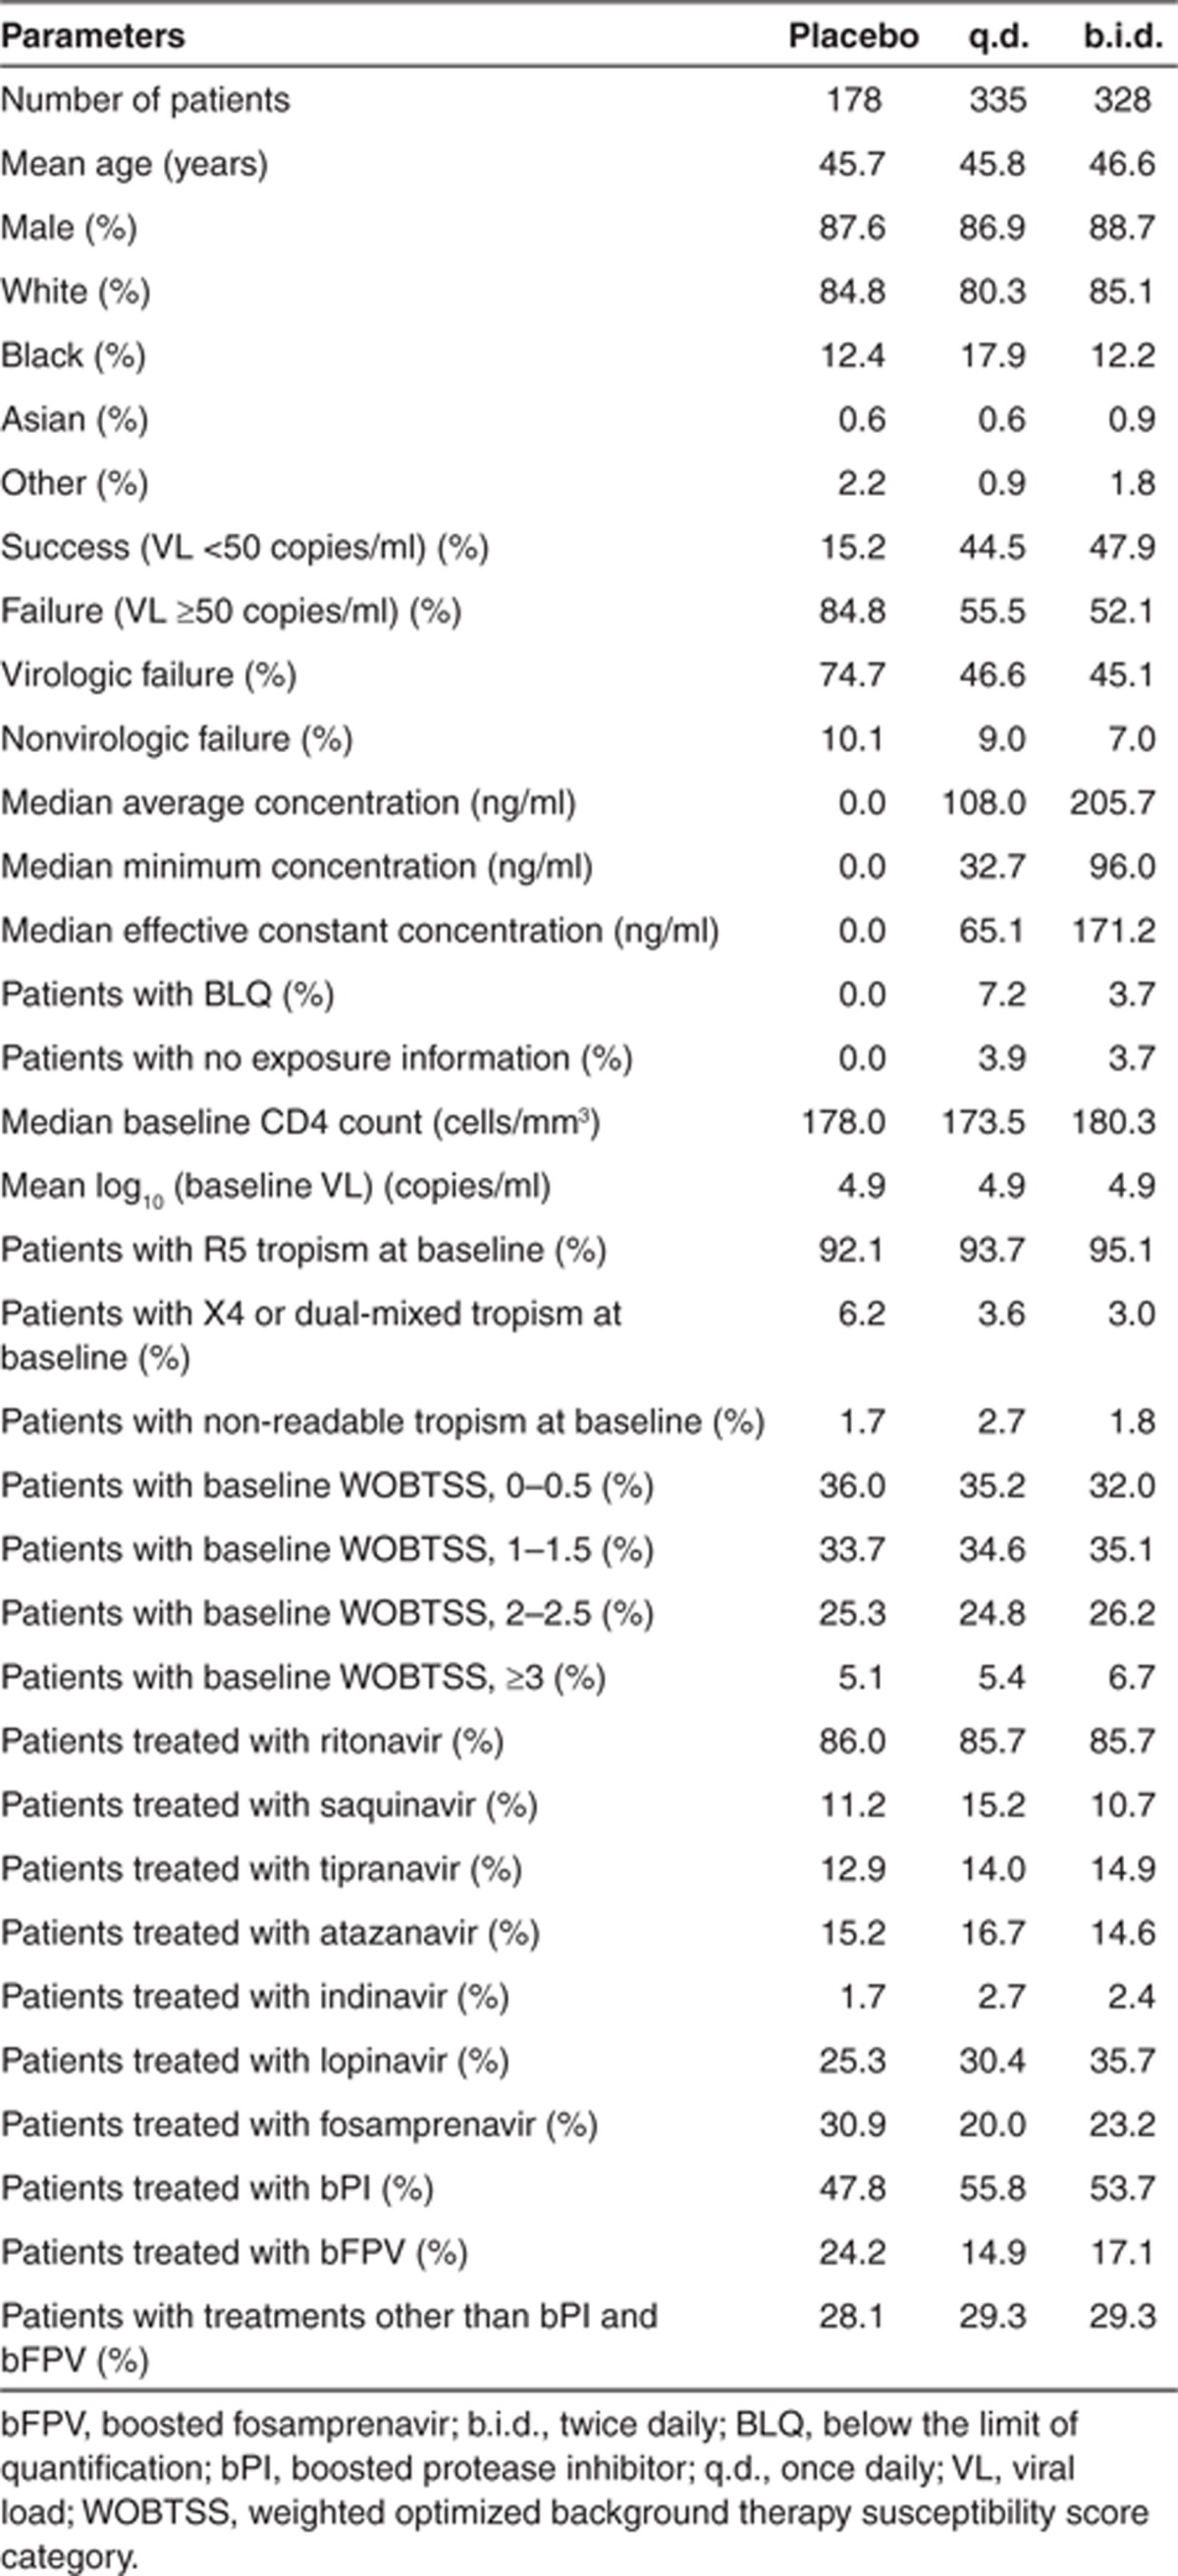
The analysis was performed using an endpoint where all patients with missing 48-week efficacy data (i.e., missing or discontinued to week 48) were treated as failures (MD = F) (total n = 841 including 178 placebo-treated patients). Information on prognostic factors by treatment group for this dataset is shown in Table 1. Patients with one or more missing categorical or continuous prognostic factors listed in Table 1 were removed before running the step-wise GAM process, which left 782 patients. Twenty-five maraviroc-treated patients had no usable maraviroc concentration data and therefore were also excluded. After selection of the final model, those patients with missing data for covariates that had not been selected for inclusion in the model were returned to the final dataset (n = 801) before re-running the final model.
Table 1. Description of the prognostic factors used in the analysis by treatment group.
Exploratory exposure–response analysis
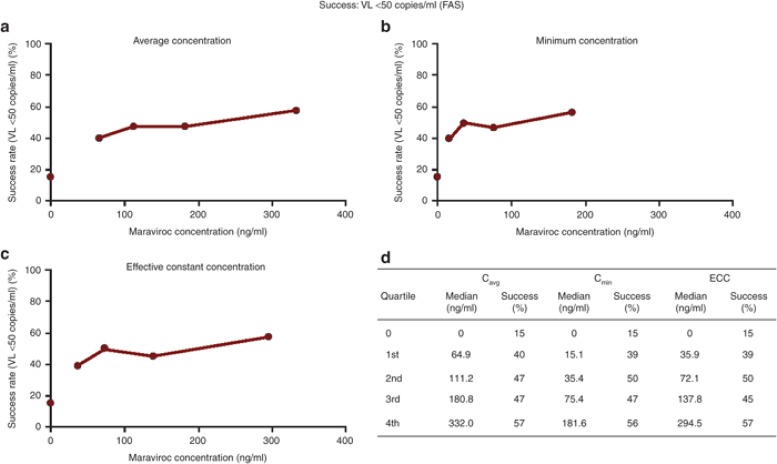
A graphical analysis of the relationship between average plasma concentration (Cavg), minimum plasma concentration (Cmin), and effective constant concentration (ECC = the constant concentration giving the same average viral inhibition as the time varying concentration) demonstrated, not unexpectedly, that they were highly correlated (data not shown).
A graphical analysis of the virologic success (VL <50 copies/ml) rate by ECC exposure quartile indicated a marked increase between the placebo rate (15%) and the first quartile (39%), a less pronounced increase between the first and the second quartiles (50%), and a slight further increase from the second to the fourth quartile (57%) (Figure 1). This apparent relationship between the success rate and exposure was further investigated by logistic regression with GAM to allow adjustment for other factors in making this assessment.
Figure 1.
(a,b,c) Graphical and (d) tabular display of quartile analysis of response rates by Cavg, Cmin, and ECC. Cavg, average plasma concentration; Cmin, minimum plasma concentration; ECC, effective constant concentration; VL, viral load.
GAM analysis of virologic success
Supplementary Table S1 online shows the prognostic factors (and relevant coding) for testing in the GAM analysis.
The results of the automated step-wise searches for the prognostic factors of virologic success (VL <50 copies/ml; MD = F) at week 48 are given in Table 2. The initial search (Model 1) tested the following factors: baseline CD4 count (BCD4); baseline VL (BVL); treatment group (TRT); baseline tropism (BTRP); WOBTSSC; protease inhibitor group (PIGRP); presence of ritonavir, saquinavir, tipranavir, atazanavir, indinavir, lopinavir, and fosamprenavir (FPV) in the OBT; one or more concentrations BLQ; age; sex; and race. The retained prognostic factors were: BCD4, BVL, TRT, WOBTSSC, RACE, and BLQ.
Table 2. Generalized additive models and Akaike criteria obtained at the end of automated step-wise searches for prognostic factors of virologic success (VL <50 copies/ml) at week 48 in HIV patients from MOTIVATE 1 and MOTIVATE 2 studies (final Model 8 in bold).
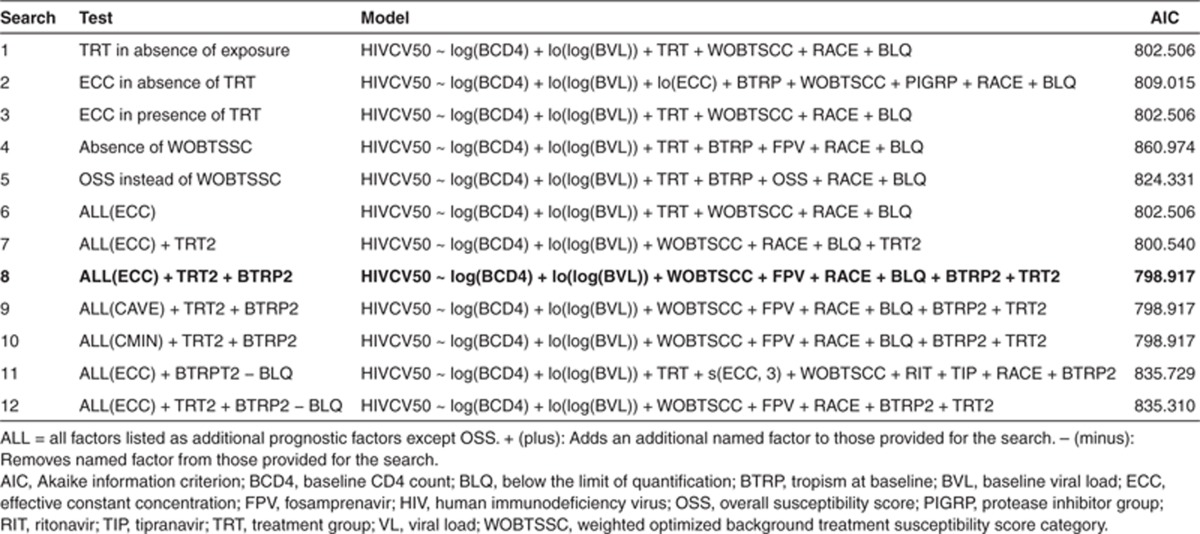
Model 2 included all the previous prognostic factors except for TRT, but included ECC instead. In this search, the same prognostic factors as in Model 1 were retained with the addition of ECC (probably in place of TRT), BTRP, and PIGRP. However, the Akaike information criterion (AIC) was higher than in Search 1 (809.015 vs. 802.506).
Model 3 tested all the previous prognostic factors including TRT and ECC with identical results to the first search indicating that TRT was more predictive than ECC.
In Model 4, WOBTSSC was removed from the list of prognostic factors tested. The resulting model indicated that BTRP and FPV only partially accounted for response differences explained by WOBTSSC, as AIC was markedly higher (860.974).
Model 5 investigated the use of OBT overall susceptibility score category (OSS) instead of WOBTSSC. OSS and BTRP were selected but AIC (824.331) was higher than when WOBTSSC was included.
Model 6 included all previous prognostic factors in the search with ECC as the concentration variable. The result was identical to Models 1 and 3, confirming that TRT and WOBTSSC are better prognostic factors than ECC and OSS, respectively.
TRT may be a better prognostic factor than ECC because the information about placebo and/or the maraviroc regimen (q.d. and b.i.d.) contained in TRT was similar or superior to ECC in explaining study outcome. This raised the question of whether the distinction between maraviroc q.d. and b.i.d. is informative or necessary. Therefore prognostic factor TRT2, which contains only placebo and maraviroc (q.d. and b.i.d. combined) categories, was added to the search. In this search (Model 7), TRT2 was selected instead of TRT and AIC was slightly lower (800.540 vs. 802.506) than when TRT was selected, suggesting no difference between maraviroc q.d. and b.i.d. when the other prognostic factors were taken into account.
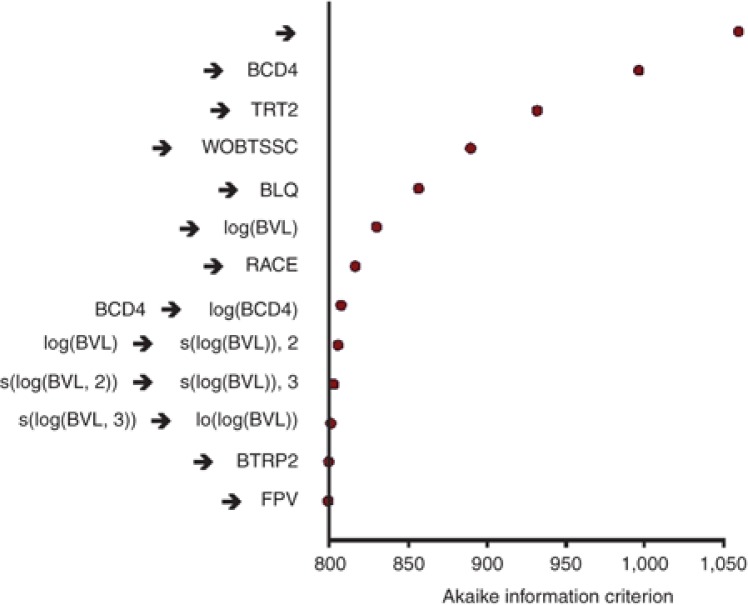
In the current analysis, BTRP was not consistently selected, whereas it was a significant prognostic factor in all models tested in the previous MOTIVATE 24-week analyses10 where subjects were screened with the original Trofile assay. This is probably because the signal is weaker in this analysis with fewer patients with non-R5 virus at baseline as some were screened out by the more discriminating enhanced sensitivity Trofile assay. Therefore, prognostic factor BTRP2, categorizing only maraviroc-treated patients for BTRP was derived and added in Search 8. BTRP2 and FPV were selected in addition to the factors already selected in Search 7, but with a slightly lower AIC (798.917 vs. 800.540) and with very small contributions to the AIC changes (Table 2; Figure 2). This is consistent with a small differential effect of BTRP in predicting outcome in subjects in maraviroc groups as compared with placebo.
Figure 2.
Results of the automated step-wise search for prognostic factors of virologic success (viral load (VL) <50 copies/ml) at week 48 in human immunodeficiency virus patients from the MOTIVATE studies (Search 8 in Table 2). BCD4, baseline CD4 count; BLQ, below the limit of quantification; BVL, baseline VL; TRT, treatment group; WOBTSS, weighted optimized background therapy susceptibility score category. → a, indicates addition of variable a; a→b, indicates the replacement of variable a with b. BTRP, baseline tropism; FPV, fosamprenavir.
As ECC was not selected in the previous search, Searches 9 and 10 were performed to check whether Cmin or Cavg may be better predictors of response than ECC. The results again showed that neither Cmin nor Cavg was more informative than TRT2 and BLQ.
In the best model obtained at this stage (Searches 8, 9, and 10 yielding identical models), BLQ was the only concentration-related parameter retained as a prognostic factor. In order to test whether BLQ was preventing other exposure variables from entering the model, BLQ was removed and two new searches were conducted: one with all prognostic factors and TRT (Search 11) and another with all prognostic factors and TRT2 (Search 12). ECC was selected in the search with TRT, but not in the search with TRT2. The AICs were higher than that obtained in Search 8 (835.729 and 835.310 vs. 798.917). This indicated that BLQ was the most informative concentration-related parameter. It is important to note that the concentration variables were derived in the PK analysis with BLQ excluded from the PK dataset, thus exposure variables were complementary to BLQ. Search 8 was therefore chosen as the final model. The sequence of prognostic factors entering this model during the search is given in Figure 2. In Table 3, the contribution of the individual prognostic factors to the AIC change derived by removing the parameters one at a time is shown in descending order of AIC change together with the direction of change. In order of importance, the prognostic factors associated with success were: treatment with maraviroc (vs. placebo), higher WOBTSSC, absence of a maraviroc BLQ (good adherence), higher CD4 count, lower BVL, race (other than black) with only very minor changes in AIC associated with tropism, and absence of FPV. Odds ratios for categorical and linear terms are included to indicate the magnitude of their effects.
Table 3. Contribution of each prognostic factor to the AIC in the final model (from Search 8 in Table 2) obtained by removing factors from Model one at a time.

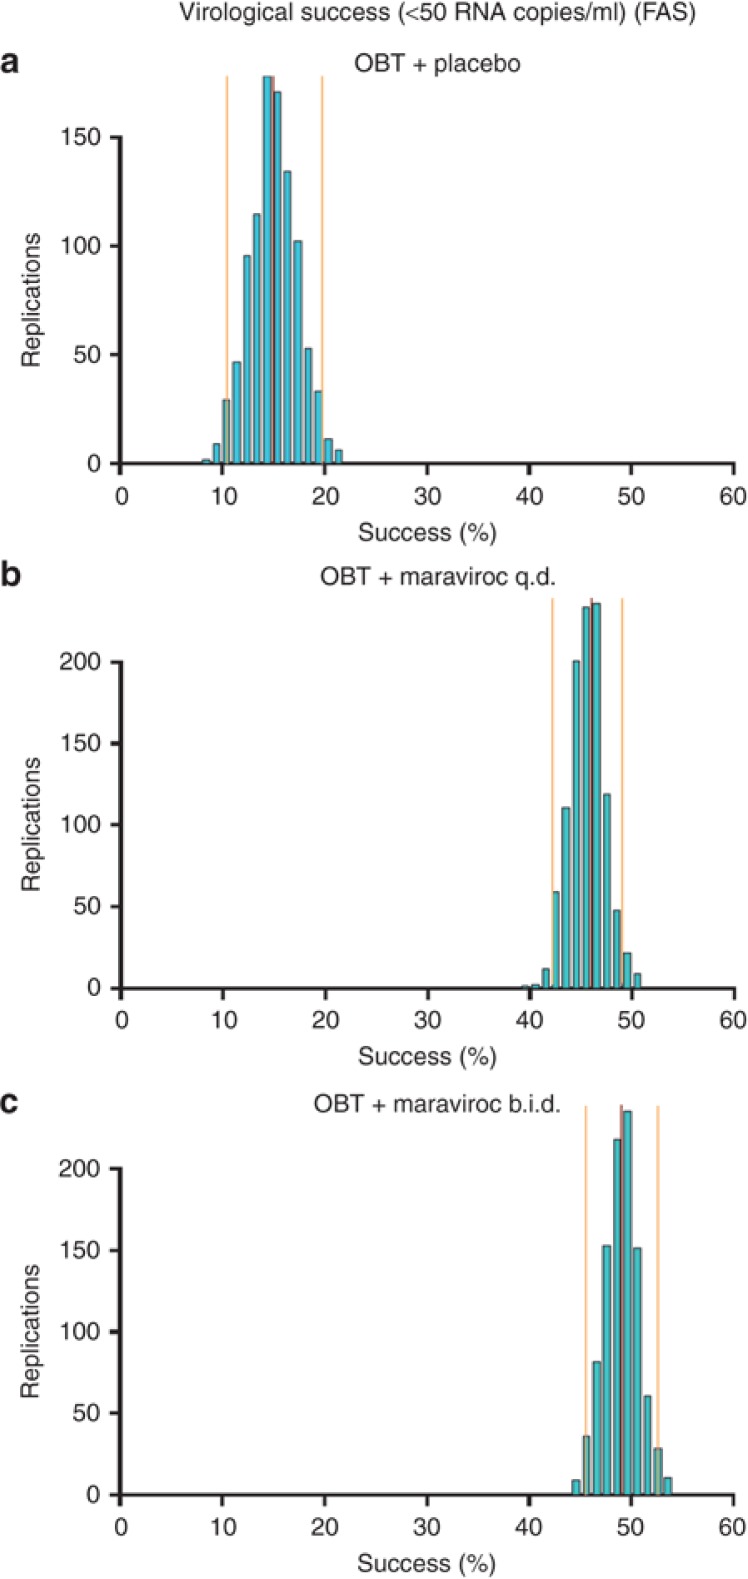
Figure 3 depicts the uncertainty of the predicted percentage of success in the investigated patient population. The narrow distributions indicate that the model parameters were estimated with acceptable uncertainty. The predictive performance of the GAM to simulate trial outcomes was also successful as evaluated by a visual predictive check and where the trial simulations accounted for both the parameter uncertainty (from 1,000 bootstraps) as well as the residual error (data not shown).
Figure 3.
Visual predictive check of the generalized additive model for virologic success (viral load <50 copies/ml at week 48) in the MOTIVATE studies by dose group. The central red line represents the observed success rate in the studies. The side orange lines represent the 95% confidence intervals of the predictions. b.i.d., twice daily; FAS, full analysis set; OBT, optimized background therapy; q.d., once daily.
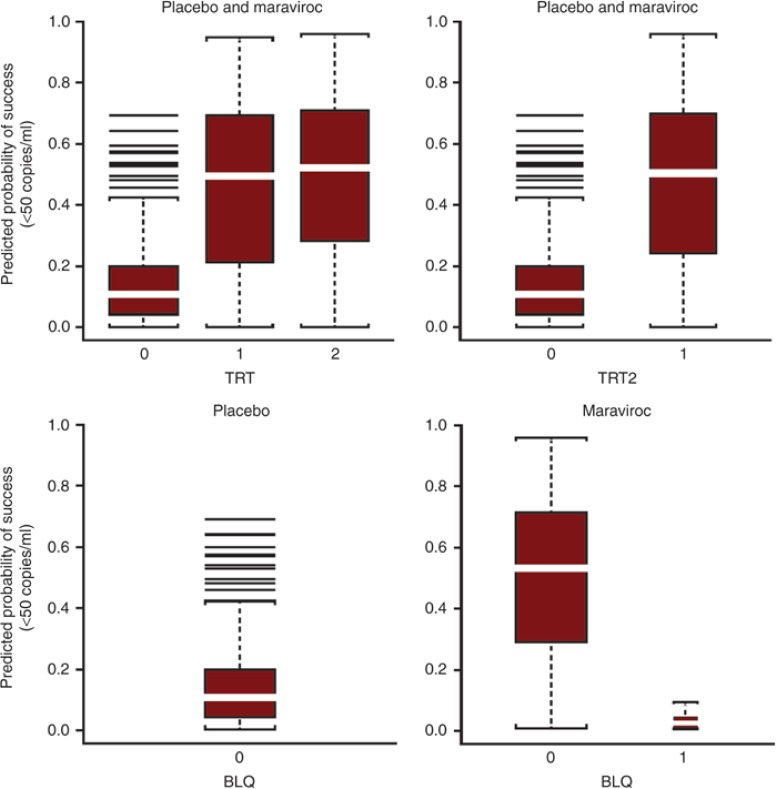
Figure 4 represents the predicted probability of success (VL <50 copies/ml) at week 48 using the final GAM (Model 8 in Table 3) showing the effects of the exposure covariates. Figure 4 (top row, left) shows mean predicted (and observed) probability of success at week 48, with 15% probability of success for placebo vs. 46% for maraviroc q.d. and 49% for maraviroc b.i.d. In the two-treatment category model (top, right), the predictions (and observed values) are 47.4% for maraviroc (q.d. + b.i.d.) vs. 15% for placebo. In the bottom row (right), taking the BLQ variable into account for the maraviroc group (q.d. + b.i.d.), the predicted probability of success increased to 50% for those without an observed BLQ whereas the probability of success for those with one or more BLQ values on maraviroc was only 3%, lower than that for placebo at 15% (bottom, left).
Figure 4.
Predicted probability of success (VL <50 copies/ml) at week 48 using the final generalized additive model (Model 8 in Table 2) in patients from the MOTIVATE studies. Top row is by TRT group and TRT2 group, bottom row is by BLQ category. b.i.d., twice daily; BLQ, below the limit of quantification; MVC, maraviroc; q.d., once daily; TRT, treatment group: placebo, MVC q.d., MVC b.i.d.; TRT2, treatment group: placebo, MVC q.d. and b.i.d. combined; VL, viral load.
Discussion
The many potential predictors and the resulting curse of dimensionality present in the treatment of HIV infection are challenging in terms of both the range of potential predictors and the choice of methodology for finding the best model that includes predictors of clinical success. Different analysis methods are available when analyzing data with multiple potential predictors, these include tree analysis,11 neural networks,12 and the more traditional approach of regression modeling.13 In the present analysis, logistic regression analysis with GAMs was the method chosen to analyze the VL data as it has been successfully used previously in the analysis of treatment success in chronic hepatitis C-infected patients and in HIV.7,8,10
The current analysis included PK measures as potential predictors but cannot be considered as a classical PK/PD analysis. PK/PD analysis of VL endpoints in treatment-experienced HIV-1–infected patients with OBT is complex, mainly because (i) the investigated drug is given in combination with various OBT combinations for which the PK and PD interactions are not fully understood; (ii) left censoring of the HIV-1 RNA levels due to the lower limit of quantification; (iii) numerous strong nonlinear covariate effects related to the disease state; and (iv) dropout. In the present analysis, VL was transformed into a binary endpoint (success or failure) and logistic GAMs were used to evaluate the effect of maraviroc exposure and possible interacting prognostic factors. The binary endpoint used for the GAM approach partly resolves the left censoring of the VL measurements and allows the combination of prognostic factors as categorical, linear, or nonlinear terms without making too many assumptions about the shape of the factor–effect relationship. With respect to the binary endpoint, all patients who discontinued for any reason before 48 weeks were regarded as treatment failures thereby dealing with dropout to some extent. A sensitivity analysis without nonvirologic failure patients led to the selection of identical prognostic factors (data not shown).
The results of this analysis of maraviroc at the 48-week milestone indicate, in addition to the well-recognized prognostic factors such as BCD4-positive T-cell count, BVL, baseline WOBTSS, other factors including treatment vs. placebo group, presence of a maraviroc concentration BLQ in maraviroc-treated patients, and race (Caucasians and others vs. black race) were prognostic factors of virologic success. In addition, virus BTRP in maraviroc-treated patients and absence of FPV in the OBT were also identified as prognostic factors, but with a very small AIC change. These results are generally in agreement with other analyses of the MOTIVATE data.2,8,9,10
The finding that a binary treatment variable (placebo vs. maraviroc and no difference between maraviroc q.d. and b.i.d.) was preferred to concentration variables, suggests that success is similar across the concentration range covered by both the q.d. and b.i.d. treatments and dose levels in the present data set after accounting for other prognostic factors. It should be noted that ~70% of the patients were comedicated with boosted PIs, which increase maraviroc area under the concentration vs. time curve (AUC) by two- to eightfold (dependent on the PI) because of CYP3A4/P-glycoprotein inhibition. Maraviroc doses used in the MOTIVATE studies appear to have delivered concentrations high on the Emax (inhibitory maximum effect) exposure–response relationship consistent with maraviroc monotherapy dose-ranging studies14 and the modeling of these data.15
In contrast to the previous analysis of the MOTIVATE 24-week efficacy data,10 none of the concentration-based exposure variables (Cavg, Cmin, and ECC) were significant factors in this analysis, in the presence of the treatment group and maraviroc BLQ. The earlier identification of a sigmoid relationship for concentration-based exposure variables10 is highly dependent on the presence of the placebo group (zero maraviroc concentration). This can also be seen from the quartile analysis (Figure 1) in the present study, with fairly flat relationships across the wide maraviroc exposure ranges but a sharp increase in success from the placebo group to the first quartile.
Another important learning is that inclusion of BLQ values (set to 0.5 × lower limit of quantification) derived from sparse PK sampling may introduce a bias in the population PK modeling if adherence is not independently identified and utilized in the analysis. This may result in the derivation of incorrect and/or misleading exposure–response relationships. Having a maraviroc BLQ associated with the dosing regimens used in the MOTIVATE studies is deemed a good surrogate for a treatment interruption of at least 2–3 days. This is based on maraviroc PK from phase I/IIa studies where concentrations were measurable 48–72 h after oral doses of 300 mg q.d. or 100 mg b.i.d. and the slow terminal elimination phase of maraviroc seen after intravenous dosing with 30 mg (terminal half-life of 13 h).16 In this analysis, we have found using BLQ as a separate prognostic surrogate factor for adherence and not including BLQ in the PK analysis provides a clear understanding of the most likely prognostic factors. Our analysis indicates that cases of maraviroc BLQ identify poor adherence (probably to all antiretrovirals) as the response rate is only 3 vs. 15% for the placebo treatment group.
Consecutive/clustered missed doses are the most likely pattern of poor adherence to cause treatment failure/viremia in HIV-1–infected patients. Only 2 of the 36 patients with ≥1 BLQ values in the data set had a VL <50 copies/ml at week 48 with only 4 having discontinued for reasons unrelated to virologic failure. The observed imbalance in the number of patients with BLQ observations in the maraviroc q.d. (7.2%) vs. b.i.d. (3.7%) arms may be attributed to one or more of the following: (i) patients in the q.d. arm received half the daily maraviroc dose of the b.i.d. arm (maraviroc 150/300 mg depending on OBT vs. 300/600 mg); (ii) the consequences of one missed q.d. dose is equivalent to two to three missed b.i.d. doses;17 (iii) the active dose in the double-dummy dosing scheme for q.d. was given in the evening and there is some evidence to suggest that patients prefer to take medication in the morning.18
PK measurements were only performed up to and including the 24-week visit and this may be regarded as a shortcoming of the present analysis. However, the first 12–24 weeks of treatment are the most important in reducing viral RNA and when adequate treatment and very high adherence to treatment are critical. This is supported by the similar response rates seen in the maraviroc arms at 24- and 48-week timepoints for <50 copies/ml viral RNA.2 Therefore, the information and adherence behavior collected early in the study can probably be safely extrapolated to later timepoints for patients remaining in the study from 24 to 48 weeks. The biggest drawback of the PK/PD analysis in these studies is that the accuracy of the PK/exposure covariates relies entirely on the accuracy of the patient-reported dosing information gathered at each visit.19 Longitudinal single or even duplicate PK measurements at multiple clinic visits dependent on patient-reported dosing history are not an efficient way of determining exposure–response relationships nor do they indicate the need for concentration monitoring. Electronic monitoring is a much more informative way of capturing adherence on an ongoing basis including between clinic visits, especially in HIV where sustained high adherence is required.19 Pill-count data are probably the least informative way to measure adherence, especially where clustered missed dosing may be critical, as in HIV therapy. Attempts were made to use pill-count data in the 24-week analysis of the MOTIVATE studies. Pill counts were, however, not pursued in the step-wise GAM because a univariate analysis showed a bell-shaped relationship with the highest efficacy centered on 100%. Pill counts >100% arise when patients do not bring back any pills. In this scenario, it is often assumed that patients have good adherence while indeed this could be indicative of poor adherence.
FPV in the OBT is somewhat over-represented in the placebo group (Table 1) and this may be responsible for its appearance as a minor covariate. It has been shown across a number of studies of antiretroviral drugs in treatment-naive patients that black patients generally show a worse response than other races. A recent meta-analysis across six studies for four antiretrovirals showed a 48% lower chance of achieving VL <50 copies/ml at 96 weeks in black patients.20 The researchers questioned whether this is because of adherence issues or other factors, such as differences in PK or psychosocial barriers. In the MOTIVATE PK covariate analysis, black patients appeared to have slightly higher PK concentrations than other patients.21
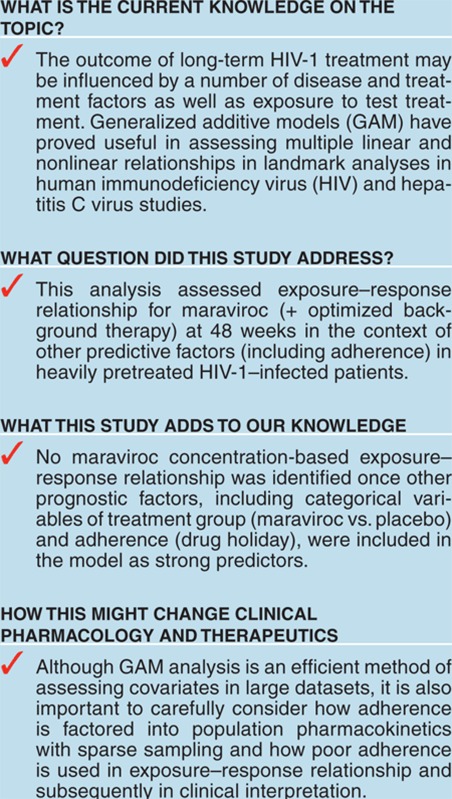
In conclusion, provided datasets are large enough, the use of GAM-type modeling is an efficient method of assessing multiple covariates with possible linear and nonlinear relationships (including exposure variables) in landmark analyses. However, it is also important to carefully consider how adherence is factored into population PK with sparse sampling and how this is subsequently used in exposure–response assessments.
It appears that the maraviroc doses used in the MOTIVATE studies delivered concentrations high on the Emax exposure–response relationship. Therefore, no concentration-based exposure–response relationships were identified once other prognostic factors, including treatment group (maraviroc vs. placebo) and adherence (presence/absence of measurable maraviroc concentrations), were taken into account.
Methods
Studies analyzed. This analysis used 48-week efficacy data from two previously reported2 placebo-controlled phase IIb/III studies (MOTIVATE 1 and MOTIVATE 2) of maraviroc and OBT in treatment-experienced patients infected with CCR5-tropic HIV-1. The study protocols were approved by institutional review boards or independent ethics committees at each study center. Patients reported as being infected with CCR5-tropic HIV-1 in the MOTIVATE 1 and 2 studies were rescreened with the enhanced sensitivity Trofile assay22 (total n = 841 with 208 censored from the original 1,049 for being non-CCR5). Maraviroc was given at a dose of 150 mg q.d. or b.i.d. when administered with PIs (except tipranavir/ritonavir) or delavirdine, otherwise 300 mg (q.d. or b.i.d.) was administered.
VL was measured using the Amplicor HIV-1 monitor v1.5 assay (Roche Diagnostics, Basel, Switzerland). OSS to the selected OBT (except for enfuvirtide) was assessed by genotypic and phenotypic sensitivity (Phenosense GT assay; Monogram Biosciences, San Francisco, CA) with a simple binary score of 1 for full sensitivity and 0 for any reduced susceptibility. For enfuvirtide, gp41 sequencing was performed (British Columbia Centre for Excellence in HIV/Aids, Vancouver, British Columbia, Canada). The WOBTSS (genotypic) excluded agents recycled from the pre-study regimen. All agents to which the screening virus was ranked as “sensitive” scored 1.0 except for nucleoside reverse transcriptase inhibitors, which scored 0.5. PIs with an “intermediate” ranking (whether boosted or not) scored 0.5, whereas all other drugs ranked as “intermediate” scored 0.
Exposure variables. Maraviroc exposure parameters, Cavg (AUC divided by dose interval: AUC/τ), Cmin, and ECC, were obtained using a Bayesian feedback procedure, as described previously.21 ECC was defined as the constant concentration that gave the same average inhibition as the time varying concentration over a dosing interval and was calculated using an in vivo half-maximal inhibitory concentration (IC50) of 7.65 ng/ml.15 ECC is theoretically the most appropriate exposure variable when comparing different dosing frequencies (q.d. vs. b.i.d.) and/or different-shaped maraviroc concentration–time curves, such as seen with inducers, inhibitors, or neutral agents.23 Exposure variables were calculated excluding BLQ concentrations. The BLQ information was reported as a separate variable as it was considered to be the result of poor adherence rather than insufficient dosing.
Exploratory analysis. An exploratory graphical analysis was performed of the efficacy–concentration data in maraviroc-treated patients. The success rate per quartile of exposure was also tabulated and plotted.
Modeling. Viral RNA, with treatment success defined as VL <50 copies/ml at 48 weeks, was analyzed as a binary variable using GAMs in which the effect of prognostic factors was examined.
A commonly used statistical model for binary data is the logistic regression model. In the frequently used linear logistic regression model, it is assumed that the log-odds of the probability of an event are linear given the prognostic factors xi1, xi2, … xip:
 |
Although attractively simple, these traditional linear logistic regression models might fail, because real-life effects are generally not linear. For this reason, the more general method of GAMs24 has been used for analyzing clinical endpoints in HIV patients and their relationship with maraviroc exposure and prognostic factors.
In the generalized additive logistic model, a more general functional form can replace each linear term:
 |
where fj can be an unspecified (“nonparametric”) function, which is estimated in a flexible manner using an algorithm whose basic building block is a scatter plot smoother (e.g., locally weighted scatterplot smoothing). A smoother is a tool for summarizing the trend of a response variable as a function of one or more predictors. It produces an estimate of the trend that is less variable than the response variable (y). Smoothing takes place by local averaging of y-values of observations having predictor values close to the target values. A simple example of a smoother is a running mean or moving average. However, in a GAM not all of the functions need to be nonlinear, and linear parametric forms can be easily mixed with nonlinear terms.
The GAMs were built using the automated step-wise search developed in S-PLUS (version 6.2; Insightful, Seattle, WA). The automated step-wise search selects the best GAM using alternating forward selection and backwards deletion given the range of models. A series of candidate relationships (e.g. linear, log-transformation, spline, locally weighted scatterplot smoothing) that describe how each particular prognostic factor might enter the model is defined for every prognostic factor. The final models were built by evaluating all the candidate forms for each prognostic factor in a step-wise manner (Supplementary Data online has Splus code for the final-step GAM model and a specimen part data set). The prognostic factors considered for inclusion in the GAMs are listed in Supplementary Table S1 online.
The uncertainty in the GAMs for efficacy endpoints was quantified using a bootstrap technique.25 The data set for the GAM analysis of the clinical efficacy endpoint was bootstrapped 1,000 times. For every bootstrap sample, the relevant final GAM was fitted providing 1,000 sets of GAM parameters for each clinical endpoint and the median; 95% confidence intervals of the predicted clinical endpoints for the 1,000 bootstrapped data sets were compared against the observed clinical endpoints. The predictive performance of the final GAMs was judged acceptable if the observed values fell within the predicted distributions.
A description of how trial simulations were performed is available in Supplementary Data online (Trial outcome simulations).
Conflict of interest
P.J., E.S., and J.R.W. were paid consultants to Pfizer Ltd. B.W. is a paid consultant to Pfizer Global Research and Development, Sandwich, Kent, UK. S.M. and L.M. are employees of Pfizer Ltd.
Author contributions
L.M., P.J., J.R.W., B.W., E.S., and S.M. wrote manuscript. L.M., P.J., B.W., and S.M. designed research. P.J., J.R.W., and E.S. performed research. L.M., P.J., J.R.W., B.W., and E.S. analyzed data. P.J., E.S., and J.R.W. from Exprimo NV were contracted to perform the modeling work and analysis on behalf of Pfizer Ltd.
Study Highlights
Acknowledgments
Editorial assistance was provided by Caroline Shepherd from Complete Medical Communications and was funded by ViiV Healthcare.
Supplementary Material
References
- Wood A., Armour D. The discovery of the CCR5 receptor antagonist, UK-427,857, a new agent for the treatment of HIV infection and AIDS. Prog. Med. Chem. 2005;43:239–271. doi: 10.1016/S0079-6468(05)43007-6. [DOI] [PubMed] [Google Scholar]
- Gulick R.M., MOTIVATE Study Teams et al. Maraviroc for previously treated patients with R5 HIV-1 infection. N. Engl. J. Med. 2008;359:1429–1441. doi: 10.1056/NEJMoa0803152. [DOI] [PMC free article] [PubMed] [Google Scholar]
- Bellman R.E. Adaptive Control Processes. Princeton University Press, Princeton, NJ; 1961. [Google Scholar]
- Le Moing V., APROCO Study Group et al. Clinical, biologic, and behavioral predictors of early immunologic and virologic response in HIV-infected patients initiating protease inhibitors. J. Acquir. Immune Defic. Syndr. 2001;27:372–376. doi: 10.1097/00126334-200108010-00007. [DOI] [PubMed] [Google Scholar]
- Paredes R., et al. Predictors of virological success and ensuing failure in HIV-positive patients starting highly active antiretroviral therapy in Europe: results from the EuroSIDA study. Arch. Intern. Med. 2000;160:1123–1132. doi: 10.1001/archinte.160.8.1123. [DOI] [PubMed] [Google Scholar]
- Snoeck E., Wade J.R., Duff F., Lamb M., Jorga K. Predicting sustained virological response and anaemia in chronic hepatitis C patients treated with peginterferon alfa-2a (40KD) plus ribavirin. Br. J. Clin. Pharmacol. 2006;62:699–709. doi: 10.1111/j.1365-2125.2006.02741.x. [DOI] [PMC free article] [PubMed] [Google Scholar]
- Kakuda T.N., et al. Pharmacokinetics and pharmacodynamics of the non-nucleoside reverse-transcriptase inhibitor etravirine in treatment-experienced HIV-1-infected patients. Clin. Pharmacol. Ther. 2010;88:695–703. doi: 10.1038/clpt.2010.181. [DOI] [PubMed] [Google Scholar]
- Fätkenheuer G., MOTIVATE 1 and MOTIVATE 2 Study Teams et al. Subgroup analyses of maraviroc in previously treated R5 HIV-1 infection. N. Engl. J. Med. 2008;359:1442–1455. doi: 10.1056/NEJMoa0803154. [DOI] [PubMed] [Google Scholar]
- Schapiro J.M., et al. Baseline CD4(+) T-cell counts and weighted background susceptibility scores strongly predict response to maraviroc regimens in treatment-experienced patients. Antivir. Ther. (Lond.) 2011;16:395–404. doi: 10.3851/IMP1759. [DOI] [PubMed] [Google Scholar]
- McFadyen L., Jacqmin P., Wade J.R., Weatherley B., Chan P.L.S.Maraviroc (MVC) exposure-efficacy relationship in treatment experienced HIV-1 infected subjectsPoster P4.1/06 presented at the 11th European AIDS Conference, Madrid, Spain; 2007 [Google Scholar]
- Breiman L., Friedman J.H., Olshen R.A., Stone C.J. Classification and Regression Trees. Wandsworth International, Belmont, California; 1984. [Google Scholar]
- Gurney K. An Introduction to Neural Networks. Taylor & Francis, Inc, Bristol, PA; 1997. [Google Scholar]
- Harrell F.E., Jr . Regression Modelling Strategies. Springer, New York, NY; 2001. [Google Scholar]
- Fätkenheuer G., et al. Efficacy of short-term monotherapy with maraviroc, a new CCR5 antagonist, in patients infected with HIV-1. Nat. Med. 2005;11:1170–1172. doi: 10.1038/nm1319. [DOI] [PubMed] [Google Scholar]
- Rosario M.C., Poland B., Sullivan J., Westby M., van der Ryst E. A pharmacokinetic-pharmacodynamic model to optimize the phase IIa development program of maraviroc. J. Acquir. Immune Defic. Syndr. 2006;42:183–191. doi: 10.1097/01.qai.0000220021.64115.37. [DOI] [PubMed] [Google Scholar]
- Weatherley B., McFadyen L. Maraviroc modelling strategy: use of early phase 1 data to support a semi-mechanistic population pharmacokinetic model. Br. J. Clin. Pharmacol. 2009;68:355–369. doi: 10.1111/j.1365-2125.2009.03455.x. [DOI] [PMC free article] [PubMed] [Google Scholar]
- Comté L., Vrijens B., Tousset E., Gérard P., Urquhart J. Estimation of the comparative therapeutic superiority of QD and BID dosing regimens, based on integrated analysis of dosing history data and pharmacokinetics. J. Pharmacokinet. Pharmacodyn. 2007;34:549–558. doi: 10.1007/s10928-007-9058-0. [DOI] [PubMed] [Google Scholar]
- Moyle G. The Assessing Patients' Preferred Treatments (APPT-1) study. Int. J. STD AIDS. 2003;14 suppl. 1:34–36. doi: 10.1258/095646203322491860. [DOI] [PubMed] [Google Scholar]
- Blaschke T.F., Osterberg L., Vrijens B., Urquhart J. Adherence to medications: insights arising from studies on the unreliable link between prescribed and actual drug dosing histories. Annu. Rev. Pharmacol. Toxicol. 2012;52:275–301. doi: 10.1146/annurev-pharmtox-011711-113247. [DOI] [PubMed] [Google Scholar]
- Spencer D.E., Evans C., Kwakwa H., Walker I., Temme L., Rawlings M.K.A meta-analysis of the difference in ART virologic failure rates in randomized clinical trials: Do blacks consistently have lower ART efficacy and poor treatment outcomesAbstract presented at the XIX International AIDS Conference, Washington, DC; 22–27 July (2012 [Google Scholar]
- Weatherley B., McFadyen L., Chan P.L.S., Marshall S.Population pharmacokinetic covariate analysis of maraviroc in phase 2b/3 studies in treatment experienced (TE) HIV-1 infected subjects on optimized background therapy (OBT).Poster 17A presented at the 9th International Workshop on Clinical Pharmacology of HIV Therapy, New Orleans, LA; 7–9 April (2008 [Google Scholar]
- Wilkin T.J., et al. Reanalysis of coreceptor tropism in HIV-1-infected adults using a phenotypic assay with enhanced sensitivity. Clin. Infect. Dis. 2011;52:925–928. doi: 10.1093/cid/cir072. [DOI] [PMC free article] [PubMed] [Google Scholar]
- Jacqmin P., McFadyen L., Wade J.R. Basic PK/PD principles of drug effects in circular/proliferative systems for disease modelling. J. Pharmacokinet. Pharmacodyn. 2010;37:157–177. doi: 10.1007/s10928-010-9151-7. [DOI] [PMC free article] [PubMed] [Google Scholar]
- Hastie T.J., Tibshirani R.J. Generalized Additive Models. Chapman & Hall, New York, USA; 1990. [Google Scholar]
- Efron B., Tibshirani R.J. An Introduction to the Bootstrap. Chapman & Hall, San Francisco, USA; 1993. [Google Scholar]
Associated Data
This section collects any data citations, data availability statements, or supplementary materials included in this article.


