

Abstract
Human cytochrome P450 3A4 (CYP3A4) metabolizes a significant portion of clinically relevant drugs and often exhibits complex steady-state kinetics that can involve homotropic and heterotropic cooperativity between bound ligands. In previous studies, the hydroxylation of the sedative midazolam (MDZ) exhibited homotropic cooperativity via a decrease in the ratio of 1′-OH-MDZ to 4-OH-MDZ at higher drug concentrations. In this study, MDZ exhibited heterotropic cooperativity with the anti-epileptic drug carbamazepine (CBZ) with characteristic decreases in the 1′-OH-MDZ to 4-OH-MDZ ratios. To unravel the structural basis of MDZ cooperativity, MDZ and CBZ bound to CYP3A4 were probed using longitudinal T1 NMR relaxation and molecular docking with AutoDock 4.2. The distances calculated from the longitudinal T1 NMR relaxation were used during simulated annealing to constrain the molecules to the substrate-free X-ray crystal structure of CYP3A4. These simulations revealed that either two MDZ molecules or an MDZ molecule and a CBZ molecule assume a stacked configuration within the CYP3A4 active site. In either case, the proton at position-4 of the MDZ molecule was closer to the heme than the protons of the 1′-CH3 group. In contrast, molecular docking of a single molecule of MDZ revealed that the molecule was preferentially oriented with the 1′-CH3 position closer to the heme than the 4-position. This study provides the first detailed molecular analysis of heterotropic and homotropic cooperativity of a human cytochrome P450 from an NMR-based model. Cooperativity of ligand binding through direct interaction between stacked molecules may represent a common motif for homotropic and heterotropic cooperativity.
Keywords: homotropic and heterotropic cooperativity, paramagnetic relaxation enhancement, cytochrome 3A enzymes, nuclear magnetic resonance (NMR), benzodiazepines
Human cytochrome P450 3A4 (CYP3A4) is found primarily in the liver and intestine and metabolizes more clinically relevant drugs than any other human P450 (1–3). CYP3A4 exhibits complex in vitro steady-state kinetics (2), which has been associated with cooperativity between bound ligands of the same (homotropic) or different (heterotropic) molecular species (4). In both cases, stimulation or inhibition of metabolism may result. Despite several X-ray crystal structures (5–8) and a number of metabolic studies (e.g. 9, 10–12), the molecular mechanism of cooperativity in CYP3A4 remains to be elucidated.
Cooperativity in ligand binding and catalysis has been proposed to result from interaction between multiple ligands bound simultaneously within a single cytochrome P450 (CYP) active site or due to conformational heterogeneity of the enzyme. Ligands(s) can occupy non-catalytic binding site(s) that are near or far from the heme and function as effectors of CYP metabolism (6, 13–17). Effectors that bind near to the heme modulate kinetics and substrate binding via direct interligand interactions or by altering the active site volume and dynamics (16, 17). In contrast, effectors far from the heme can affect the properties of substrates in the active site by long-range allosteric interactions (13, 14, 18). In addition to multiple-ligand binding to a single P450, conformational heterogeneity due to oligomerization has been proposed to lead to CYPs with differential affinities for substrates and inhibitors (19, 20).
Some structural insight into multiple-ligand binding to CYP3A4 has been provided by X-ray crystal structures (5, 6, 8). In one case, a progesterone molecule was bound far from the active site, although none was found in the active site (6). The authors proposed that binding of the remote progesterone modulated activity toward progesterone within the active site. In another X-ray crystal structure of CYP3A4, two ketoconazole molecules were stacked against each other in the active site (8). Together these studies suggest that multiple ligand binding can alter catalytic properties by more than one mechanism.
The anticonvulsant carbamazepine (CBZ) and the sedative midazolam (MDZ) are both primarily metabolized by CYP3A4 (21, 22) (Scheme 1). The homotropic cooperativity of MDZ metabolism is manifested by significant differences in the KM and Vmax values for formation of 1′-hydroxy MDZ (1′-OH-MDZ) and 4-hydroxy MDZ (4-OH-MDZ) (23–25). Formation of 1′-OH-MDZ is also inhibited at higher [MDZ] (23, 24). As a result of the substrate inhibition and homotropic cooperativity, the ratios of 1′-OH-MDZ to 4-OH-MDZ decreased at higher concentrations of MDZ (24, 25). MDZ metabolism also exhibits heterotropic cooperativity with α-naphthoflavone (α-NF) and testosterone (TST) (25). Conversely, CBZ is metabolized to the 10,11-epoxide by CYP3A4 (26) and forms covalent adducts to CYPs (22, 27). Kinetics of CBZ metabolism by purified CYP3A4 is hyperbolic (26), suggesting a single binding site. On the other hand, CBZ also exhibits heterotropic cooperativity with a variety of ligands including steroids and α-naphthoflavone (28).
Scheme 1.
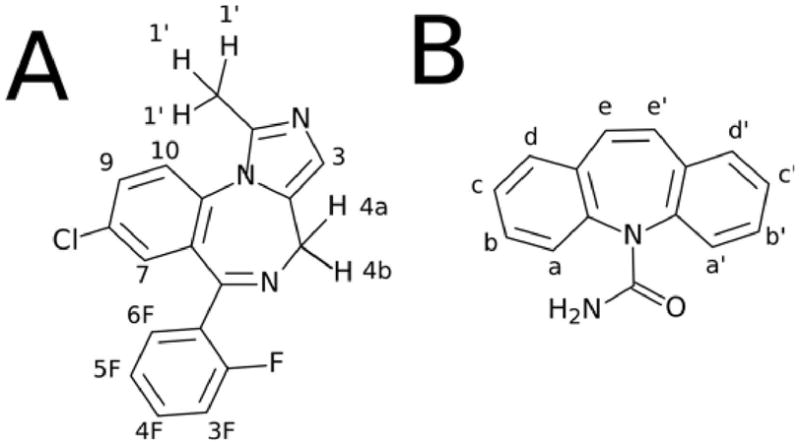
Molecular Structures of A) Midazolam (MDZ) and B) Carbamazepine (CBZ).
Proton letter and number assignments are shown.
In this study, the effect of CBZ on the CYP3A4-mediated hydroxylation of MDZ was examined. The interactions between these ligands and CYP3A4 were probed using T1 longitudinal NMR relaxation and molecular docking. The distances calculated from the NMR relaxation were used to restrain the drugs in the active sites of CYP3A4 during the simulated annealing simulations. The singly-bound MDZ CYP3A4 complex (CYP3A4•MDZ) could not probed by NMR, so molecular docking was performed with AutoDock 4.2. Simulated annealing simulations and the molecular docking provided models of homotropic and heterotropic cooperativity of MDZ metabolism by CYP3A4. This combination of results provided, for the first time, a detailed NMR-based structural model of homotropic and heterotropic cooperativity of a human CYP.
Materials and Methods
Materials
MDZ maleate, CBZ, NADPH, δ-aminolevulinic acid (δ-ALA), isopropyl β-D-1-thiogalactopyranoside (IPTG), SigmaFast™ protease inhibitor cocktail tablet, 1′-OH-MDZ, and 4-OH-MDZ were obtained from Sigma-Aldrich (St. Louis, MO). Isotopically-labeled 15N3-midazolam was kindly provided by Roche Laboratories (Nutley, NJ). 15N3-labeled MDZ metabolites (i.e., 1′-OH-MDZ and 4-OH-MDZ) were prepared in house as described previously (29). N-methyl-N-(t-butyl-dimethylsilyl) trifluoracetamide (MTBSTFA) was purchased from Pierce Biotechnology (Rockford, IL). The detergent Anapoe C12E10 and the ProBond™ Ni2+ affinity resin were purchased from Affymetrix (Santa Clara, CA) and Invitrogen (Carlsbad, CA), respectively. Supersomes™ expressing membrane-bound human CYP3A4, membrane-bound NADPH cytochrome P450 reductase and cytochrome b5 were purchased from BD Biosciences (Woburn, MA).
Incubations of Supersomes™ with CBZ and MDZ
Incubation mixtures (0.5 mL final volume) containing 50 μg of Supersomes™ and drugs in 100 mM potassium phosphate buffer (KPi) (pH 7.4) were preincubated at 37°C for 5 min. NADPH (1 mM final concentration) was added to initiate the reaction. Reactions were terminated after 2 min. by addition of 0.5 mL ice-cold 0.1 M sodium carbonate buffer (pH 11) before a significant amount of the CYP3A4-CBZ adduct formed (22). The 15N3-labeled metabolite internal standards were added to the samples and standards. The metabolites were extracted with 5 mL ethyl acetate. The organic phase was transferred to a clean tube, blown to dryness with N2 gas and reconstituted in 100 μL of derivatizing reagent (10% MTBSTFA in acetonitrile). Samples were transferred to autosampler vials and heated to 80°C for 2 hr. The samples were analyzed for 1′-OH-MDZ and 4-OH-MDZ by negative chemical ionization gas chromatography-mass spectroscopy (GC-MS) as previously described (29).
The kinetics were fit with the Michaelis-Menten (eq 1, (30)) or the substrate inhibition equations (eq 2, (31)) using the scientific analysis package Igor 6.1 (Wavemetrics, Inc., Lake Oswego, Oregon).
| (1) |
| (2) |
where k is the velocity (v)/enzyme concentration ([E]), kcat is the maximal velocity (Vmax)/[E], [S] is the substrate concentration, Km is the Michaelis-Menten constant and Ki is the inhibitory constant.
Expression and Purification of Recombinant CYP3A4
DL39 Escherichia coli (E. coli) were transformed with the CYP3A4 NF14 plasmid constructs by the heat shock method (32, 33). Luria Broth (LB) media (30 mL) with 100 μg mL−1 ampicillin inoculated with the transformed E. Coli and incubated overnight at 37°C and 150 rpm. Terrific Broth (TB) media (1L) with 100 μg mL−1 ampicillin and 50 μM testosterone was inoculated with the overnight culture and incubated at 30°C and 150 rpm, until OD600 reached ~1 (3–4 hours). Then IPTG and δ-ALA were added to the 1L cultures to a concentration of 1 mM. The bacterial growth was continued for ~48 h at 30°C and 150 rpm. The cells were harvested after 15 min. of centrifugation at 1600g (~3500 rpm) in a Sorval RC 3C plus centrifuge and a H6000A swinging bucket rotor. The cell pellets were resuspended in ~50 mL of buffer A (100 mM Tris-HCl, 20% glycerol, 200 μM testosterone, 1 SigmaFast™ protease inhibitor cocktail tablet, pH 7.4) per L of culture. DNase I and lysozyme was added to the solution to a final concentration of 1 unit DNase mL−1 and 5 mg mL−1, respectively. This was stirred for an hour at 4°C. The broken cells were pelleted by 10 min. of centrifugation at ~18,000g (10,000 rpm) in a Beckman J21 centrifuge with JA-14 rotor. The pellet was resuspended and homogenized in ~50 mL resuspension buffer with a Dounce tissue grinder. The detergent Anapoe C12E10 was added to the resuspended cells to 2% concentration and the solution was stirred for another hour at 4°C. The solution was then centrifuged at 130,000g (34,000 rpm) in a Beckman 50 Ti rotor for 40 min at 4°C using a Beckman L8-70 ultracentrifuge. The supernatant was pooled and applied to a column containing ProBond™ Ni2+ affinity resin at 4°C. After equilibration with several columns of Buffer A, the column was then washed with 10 column volumes of Buffer B (100 mM Tris-HCl, 20% glycerol, 40 mM imidazole, 0.05% cholic acid, pH 7.4). The protein was then eluted with 2 column volumes of Buffer C (100 mM Tris-HCl, 20% glycerol, 300 mM histidine). The red fractions were pooled and Buffer C was replaced with 100 mM KPi (pH=7.4) with 20% glycerol using Amicon Ultra-15 30 kDa concentrators (Millipore). The purity was >95% by sodium dodecyl sulfate polyacrylamide gel electrophoresis (SDS-PAGE) analysis. The [P450] was determined by measuring the amplitude at 450 nm (ε450 of 91 mM−1 cm−1) from the difference between the CO-Fe2+ and Fe2+ heme absorbance spectra (34). No P420 was detected from the difference absorbance spectrum. CYP3A4 was stored in 100 mM KPi (pH 7.4) with 20% glycerol at −80°C.
Size-Exclusion Chromatography of Recombinant CYP3A4
Size-exclusion chromatography (SEC) was used to determine the aggregation state of CYP3A4 in 100 mM KPi (pH 7.4) in the presence and absence of Anapoe C12E10. SEC was performed on a Shimadzu VP Series high-performance liquid chromatography (HPLC) system equipped with a Pharmacia Superose 6 HR10/300 column and EZStart version 7.2.1. The flow rate was maintained at 0.5 mL min.−1 with a maximum allowed pressure of 215 psi. The UV-visible absorbance was monitored between 200 and 600 nm. CYP2C9 samples were calibrated against the 670, 158, 44, 17, and 1.35 kDa gel filtration standards (Bio-Rad, Hercules, CA). The results of the SEC are shown in the Results and Figure S2 in the Supporting Information. The size-exclusion chromatograms were analyzed as described in (35). Analysis of the chromatograms revealed that CYP3A4 is primarily a tetramer and a monomer in the absence and presence of 2% Anapoe C12E10, respectively.
UV-visible Spectroscopy of CYP3A4 with MDZ and CBZ
Absorbance difference and absolute absorbance spectra of the CYP3A4 heme were collected using a Cary 3E absorbance spectrophotometer (Varian Scientific Instruments, Inc. Lake Forest, CA), or an Olis Modernized Aminco™ DW-2 (Olis, Inc., Bogart, GA) as previously described (34, 36, 37). To probe MDZ occupancy of CYP3A4 at low [MDZ], “titration-by-dilution” experiments were carried out on a with a S2000 single channel charged-coupled device (CCD) rapid scanning spectrometer (Ocean Optics, Inc., Dunedin, FL.) with L7893 deuterium and halogen light source with fiber optic cable (Hamamatsu, Inc., Bridgewater, NJ) (38). In these experiments, MDZ-induced CYP3A4 spin-state changes were monitored with increasing volume and constant amounts of MDZ and CYP3A4. All samples contained 100 mM KPi (pH 7.4, 25°C) and were titrated with ligand dissolved in ethanol to a maximum concentration of 2%. The concentration-dependent titration and the “titration-by-dilution” curves were fit with the scientific analysis package Igor 6.1 to the equation for the equilibrium of bimolecular association (eq 3, (39)):
| (3) |
where A is the absorbance amplitude in units of molar extinction coefficient (μM−1 cm−1), Amax is the maximum absorbance amplitude in units of molar extinction coefficient (μM−1 cm−1), [L] is the ligand concentration, KD is the dissociation constant and an Offset is a value that compensates for small errors in the absorbance measurement. Because of multiple MDZ binding to CYP3A4, the concentration-dependent titration curves of MDZ and MDZ with CBZ were fit using the biochemical simulation program GEPASI (40) and the equilibrium binding models shown in Scheme 2. In addition to fitting the titrations, the CYP3A4 absorbance spectra with MDZ and CBZ were fit by least squares method using software written in the Python programming language (Version 2.6) to a linear combination of low spin (LS) and high spin (HS) heme spectral standards (41–43). Unlike previous studies (41–43), the spectra were fit without a ferric P420 (P420) spectral standard, because no P420 was detected in the CO-reduced spectra and good fits could be obtained without it.
Scheme 2.
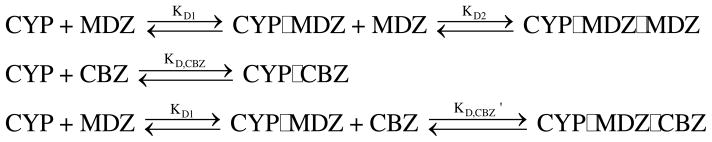
Proposed Equilibria of Midazolam (MDZ) and Carbamazepine (CBZ) binding to CYP3A4.
Longitudinal (T1) Relaxation of CBZ and MDZ Bound to Recombinant CYP3A4
The T1 relaxation experiments were performed on a 500 MHz Unity Inova NMR spectrometer (Agilent Technologies, Santa Clara, CA), using a three channel 1H{13C/15N} probe with a pulse field gradient. The T1 relaxation was measured using a pulse sequence containing a 180° inversion pulse followed by a WATER suppression by GrAdient Tailored Excitation (WATERGATE) (44) or by excitation sculpting ulse sequence (45) on samples containing >99% D2O with relaxation delays of 15s. The NMR samples contained 1 μM CYP3A4 and 260 μM MDZ or CBZ in 100 mM KPi pD 7.4 with 1% D6-ethanol as a co-solvent for MDZ or CBZ. For paramagnetic samples, the heme of the CYP is in the Fe3+ state. It was prepared by purging the samples for 2 hours under highly pure argon in sealed 5 mm NMR tubes. Diamagnetic samples with the CYP in the Fe2+ state were made by gently bubbling with CO for a minute. Then a small amount of dithionite was added to the sample under a flow of argon. As a measure of anaerobicity, a BD Dry Anaerobic indicator strip for GasPak jar systems (BD Biosciences, San Jose, CA) was dipped in a dithionite solution prior to insertion into the NMR tube. NMR samples, where the inserted anaerobic strips turned blue because of oxygen, were excluded from the analysis. Shifts in the MDZ and CBZ NMR proton peaks in the presence of oxidized and reduced CYP3A4 showed that the binding of these ligands was in fast exchange (see the Results and Figure S4 of the Supporting Information).
Processing, Background Subtraction, and Deconvoluting NMR spectra
NMR spectra were processed using the advanced NMR processing package iNMR (http://www.inmr.net). The NMR spectra were then translated into the ASCII text format and imported into the scientific analysis package Igor Pro 6.1 (Wavemetrics, Inc., Lake Oswego, Oregon). The background and baseline were subtracted from the NMR spectra using software written in the Python programming language and integrated into Igor Pro 6.1. The NMR spectra were fitted using previously-described methods (e.g. 46, 47–49). Curve fitting was accomplished in two steps. First, the position of the peak was estimated by analyzing the spectra under different conditions including different protein concentrations and different solvent conditions (see Fig. 1) and by analyzing the NMR spectra by principal component analysis (PCA) (50–52). The latter PCA analysis was accomplished using software written in the Python programming language with the numerical python module named numpy and integrated into Igor Pro 6.1. Using the peak positions determined from the previous analyses, the data were fit to a linear combination of Gaussian, Lorenzian or Voigt line shapes (see 46, 47, 48, 53) by the multiple peak fitting package (Version 2.0) of Igor 6.1 and a least-squares fitting program written in the Python programming language using the numpy Python module.
Figure 1. The effect of carbamazepine (CBZ) on midazolam (MDZ) metabolism by CYP3A4 in Supersomes™.

The enzyme normalized velocities (k) of A) 1′-OH midazolam (1′-OH-MDZ) and B) 4-OH midazolam (4-OH-MDZ) formation are shown in the absence (closed squares and solid lines) and presence of 240 μM CBZ (open circles and dashed lines). The ratio of 1′-OH-MDZ versus 4-OH-MDZ formation in the absence (closed squares and solid lines) and presence of 240 μM CBZ (open circles and dashed lines) are illustrated in C).
Singular Value Decomposition (SVD) Analysis of the NMR Relaxation Measurements
Singular value decomposition (SVD) has been used to analyze NMR relaxation data with multiple phases (54), deconvolute complex mixtures (55, 56) and analyze 2D NMR spectra (57, 58). In this study, SVD analysis was used to measure amplitudes of the NMR peaks using reference peak standards simulated from the curve fitting (59–61). The NMR peak standards were selected by three criteria. 1) Fitting the experimental data by the least-squares method with the standards gave very low residuals. 2) The simulated first and second principal components (PCs) constructed from the standards had correlation coeffients close to 1, when compared with the experimental PCs. 3) The SVD-determined relaxation curves had low X2 to the inversion recovery equation (62):
| (4) |
where MZ is the z component of nuclear spin magnetization, MZ,eq is the MZ at thermal equilibrium, T1 is the spin-lattice decay constant and t is time.
The SVD algorithm was written in Python programming language with the numeral python module, numpy, and integrated into Igor Pro 6.1. The SVD-derived curves were fit using eq 4 in Igor Pro 6.1.
The T1 paramagnetic relaxation rate (RP) was experimentally determined by measuring the differences between the NMR longitudinal relaxation rate of oxidized P450, where the heme was in the Fe3+ state, and reduced P450, where the heme was in the Fe2+ state. This relationship is represented mathematically by RP = RFe3+ − RCO-Fe2+, where RP is the paramagnetic relaxation rate, RFe3+ is the relaxation rate of the oxidized P450 and RCO-Fe2+ is the relaxation rate of CO-reduced P450. The fraction of bound ligand (α) with respect to total [L] is equal to ([E]/(KD+[L]), assuming a single ligand binding model, where KD is the dissociation constant. For doubly occupied CYP3A4, the sequential ordered binding model was used.
where KD1 and KD2 are the dissociation constants, and the EL and ELL are singly-bound and doubly-bound enzyme complexes. As previously described (eq 4, (63)), the α is shown below:
| (5) |
The RP is related to distance by the Solomon-Bloembergen equation (SI Units) (62, 64–67):
| (6) |
where μ0 is the magnetic permeability of free space, γN is the nuclear gyromagnetic ratio, ge is the electronic g-factor, μB is the Bohr magneton, rapp is the apparent time-averaged electron-nuclear distance, τC is the correlation time for the nuclear-electron interaction vector, which is dominated by the electron spin relaxation rates, S is the electronic spin quantum number, and ωN and ωE are the radial frequencies of the nucleus and electron, respectively. Because the τC value is primarily affected by the spin relaxation time (τS), the CYP3A4 aggregation state will have little effect on the calculated distance (66, 67). The S(S+1) term accounts for the fractional spin state of the P450. For mixed spin state systems (63), S(S+1) is equal to 8.75fHS+0.75fLS, where fHS and fLS are the fraction of HS and LS states (68, 69).
Eq 6 neglects the chemical equivalence of the protons with the implicit assumption that all protons associated with an NMR peak are exactly the same distance from the heme. The relationship between the rapp and the distances of the individual protons is shown below with n and rn representing the number and the distances of those chemically-equivalent protons (eq 6, (43)), respectively.
| (7) |
The rmin is the minimum distance of a proton from group of chemically equivalent protons. In eq 7, the rmin−6 is approximately equal to the sum of rn−6, since longer distances have a negligible contribution to the sum.
The Effect of Ligand Dynamics on RP, rapp and ravg
Because of ligand dynamics and the fast exchange requirement for these measurements, the distances calculated from this analysis are not likely to represent absolute distances, but time-averaged distances weighted toward the shortest distance. In this study, the time averaging of distances of mobile nuclei and paramagnetic species was accomplished using the ensemble approach (70–72). The time-dependent ensemble averaging equations of the RP and rapp are shown in eq 8, where Δtn is the fraction of time, t is the total time and ft is the fraction of time at an individual distance. The left part of eq 9 shows that RP is linear to the individual relaxation rates, whereas the rapp has r6 dependence in the right part. This will cause the rapp to be skewed toward the shortest distance, whereas the RP will remain linear. For a molecule that fluctuates, the average distance (ravg, eq 9) is quite different from rapp. Like RP and RM, the ravg is linear with respect to the individual distances (rn). To demonstrate the effect of time averaging on rapp, a simulation of rapp, ravg and RP is presented in the Supporting Information.
| (8) |
| (9) |
Molecular Docking of MDZ and CBZ
Molecular docking was used to find the orientations of a single MDZ molecule and for starting positions of CBZ and MDZ for the simulated annealing simulations within CYP3A4. To dock MDZ and CBZ to CYP3A4, the molecular docking software package AutoDock 4.2 (73) and the X-ray crystal structure of CYP3A4 without ligands (PDB ID: 1TQN (5)) were used. Residues that were missing from the X-ray crystal structure were added using the homology modeling program Modeller (74) and the CYP3A4 amino acid sequence (5). MDZ and CBZ were built using Avogadro (Version 1.01) and energy minimized by the steepest descent approach using the MMFF94 force field (75). AutoDockTools 1.4.6 (The Scripps Research Institute, La Jolla, CA) was then used to add Gasteiger charges to the CYP3A4 coordinates and the drugs. Heme charges previously used for simulations of P450CAM (76) were added to the CYP3A4 coordinates using a script written in the Python programming language. During the simulation, the protein was kept rigid, while the ligands were allowed to be flexible. For rough docking of MDZ and CBZ to CYP3A4 for the distance-restrained simulated annealing simulations, the molecules were simulated in a box centered 10 Å orthogonally from the heme iron with 20 Å per axis using default parameters. For simulations of a single molecule of MDZ to CYP3A4, the molecule was confined to a 10×10×10 Å box from the heme iron to be sensitive to MDZ binding modes that were close to the heme. For each docking simulation, 20 separate simulation runs were performed with 25 million energy evaluations per run.
Distance-Restrained Simulated Annealing Simulations of MDZ and CBZ bound to CYP3A4
Distance-restrained simulated annealing is used in the refinement of NMR structures and complexes (77, 78). The technique was used here to determine the preferred orientations of MDZ and CBZ in the active site of CYP3A4 using the distances calculated from the RPs and eq 6 (43, 79–81). Distance-restrained simulated annealing and energy minimization of CYP3A4 and the drugs were performed with the software package Groningen MAchine for Chemical Simulation (GROMACS) Version 4.07 (82). The CYP3A4-drug complexes were simulated with the GROMOS 96 53a6 force field (83). A derivation of the force field parameters and charges of the heme with a spherical iron in the GROMOS 53a6 forced field are described in (84). The particle mesh Ewald (85) method was used for electrostatics with position restraints placed on the α-carbon backbone during the simulated annealing. The protons of CBZ and MDZ were restrained to CYP3A4 using the NMR calculated distances from Tables 1 and 2. For CYP3A4 models containing two molecules of MDZ, an additional 30 Å constraint was applied to prevent one of the molecules from vacating the active site. A time constant of 50 ps was applied to the distance restraint to allow the molecule to move in the active site during the simulation, since the calculated distances reflect multiple orientations of the substrates in the CYP3A4 active site. The CYP3A4 complexes were energy minimized using the steepest descent method to eliminate van der Waals contact. The system was then heated to 800 K and cooled to 300 K in 150 ps and allowed to equilibrate for 100 ps at 300 K. Snapshots of the molecules bound to CYP3A4 were taken during the last 50 ps of the MD simulation and used to show the binding modes of the molecules. These simulations were performed on the Multi-Tiered Proteomic Compute Cluster at the University of Washington.
Table 1.
Paramagnetic relaxation rates (RP) and calculated (rapp and rmin) of MDZ or CBZ bound to CYP3A4.
| Peak | RFe3+ (sec−1) | RFe2+-CO (sec−1) | RP (sec−1) | rappa (Å) | rmin (Å) |
|---|---|---|---|---|---|
| 260 μM Midazolam
| |||||
| 1′ | 2.18±0.02 | 1.53±0.04 | 0.65±0.05 | 9.15±0.22 | 7.62±0.18b |
| 3 | 1.88±0.04 | 1.45±0.18 | 0.43±0.18 | 9.79±0.71 | |
| 7 | 1.81±0.05 | 1.67±0.09 | 0.14±0.10 | 11.83±1.50 | |
| 9 | 2.97±0.17 | 1.65±0.12 | 1.31±0.20 | 8.14±0.27 | |
| 10 | 2.85±0.06 | 1.81±0.11 | 1.03±0.12 | 8.47±0.24 | |
| 3F | 1.60±0.07 | 1.46±0.20 | 0.14±0.21 | 11.84±2.95 | |
| 4F | 1.85±0.04 | 1.91±0.07 | −0.06±0.08 | - | 17.02c |
| 5F | 2.17±0.06 | 1.72±0.10 | 0.45±0.11 | 9.75±0.46 | |
| 6F | 1.88±0.05 | 1.83±0.11 | 0.05±0.12 | 14.13±6.01 | |
|
| |||||
| 260 μM Carbamazepine
| |||||
| aa′ | 2.44±0.24 | 1.67±0.11 | 0.77±0.26 | 7.88±0.45 | 7.02±0.40b |
| bb′ | 2.56±0.33 | 1.54±0.09 | 1.03±0.34 | 7.51±0.42 | 6.69±0.38b |
| cc′ | 2.38±0.23 | 1.59±0.10 | 0.79±0.25 | 7.84±0.41 | 6.98±0.37b |
| dd′ | 2.50±0.25 | 1.47±0.09 | 1.03±0.26 | 7.51±0.33 | 6.69±0.29b |
| ee′ | 2.22±0.20 | 1.52±0.09 | 0.71±0.22 | 7.99±0.41 | 7.12±0.37b |
rapp was calculated using eq 6.
rmin was calculated based on chemical equivalence (eq 7).
rmin was calculated using the highest RP.
Abbreviations: RFe3+, paramagnetic relaxation rate (sec−1) of oxidized CYP3A4; RFe2+-CO, paramagnetic relaxation rate (sec−1) of reduced CYP3A4 with CO; RP, paramagnetic relaxation rate (i.e. RP=RFe3+−RFe2+-CO). The distances were calculated with a τC of 3 × 10⁻¹⁰ sec, which is the average value of P450s under variety of conditions (31, 49). The NMR relaxation rates of 4a and 4b protons were omitted because of overlap of their NMR peaks with water and aliphatic proton NMR peaks.
Table 2. Paramagnetic relaxation rates (RP) and calculated (rapp and rmin) distances of MDZ and CBZ bound simultaneously to CYP3A4.
NMR peak assignments of overlapping peaks are based on peak positions determined in Figure 5.
| Peak | RFe3+ (sec−1) | RFe2+-CO (sec−1) | RP (sec−1) | rappa (Å) | rmin (Å) |
|---|---|---|---|---|---|
| 260 μM Midazolam
| |||||
| 1′ | 2.13±0.04 | 1.57±0.04 | 0.56±0.06 | 9.03±0.15 | 7.52±0.13b |
| 3 | 1.82±0.06 | 1.44±0.12 | 0.38±0.13 | 9.64±0.57 | |
| 7 | 1.70±0.05 | 1.41±0.06 | 0.29±0.08 | 10.08±0.45 | |
| 9 | 2.37±0.07 | 1.26±0.07 | 1.11±0.10 | 8.06±0.12 | |
| 10 | 2.69±0.06 | 1.76±0.09 | 0.93±0.11 | 8.30±0.16 | |
| 3F | 2.04±0.05 | 1.54±0.18 | 0.50±0.19 | 9.21±0.57 | |
| 4F | 1.08±0.05 | 1.01±0.11 | 0.07±0.12 | 12.78±3.68 | |
| 5F | 1.05±0.04 | 1.16±0.19 | −0.11±0.19 | 12.39c | |
| 6F | 1.69±0.24 | 1.76±0.13 | −0.07±0.27 | 10.70c | |
|
| |||||
| 260 μM Carbamazepine
| |||||
| aa′ | 1.23±0.02 | 1.19±0.04 | 0.04±0.04 | 13.88±2.59 | 12.37±2.30b |
| bb′ | 1.11±0.12 | 1.15±0.13 | −0.04±0.18 | 10.08c | |
| cc′ | 1.10±0.03 | 1.20±0.13 | −0.10±0.13 | 12.75c | |
| dd′ | 1.12±0.02 | 1.20±0.11 | −0.08±0.11 | 12.85c | |
| ee′ | 1.27±0.05 | 1.25±0.03 | 0.02±0.06 | 15.58±7.57 | 13.88±6.75 |
The footnotes are explained in Table 1.
Results and Discussion
MDZ Metabolism Exhibits Both Homotropic and Heterotropic Cooperativity in Supersomes™
The metabolism of MDZ by CYP3A4 in the absence and presence of CBZ is shown in Figure 1. As reported previously, CYP3A4 exhibited substrate inhibition with biphasic kinetics for the formation of 1′-OH-MDZ (23, 86, 87). The velocity of 1′-OH-MDZ formation reaches a maximum at 25 μM and decreases at higher [MDZ]. Fitting the velocity of 1′-OH-MDZ formation to eq 2 gives a Km and Ki of 5.0 ± 0.7 μM and 1001 ± 369 μM, respectively. The kcat extracted from the fit was 25.2 ± 1.2 nmol min−1 nmol CYP3A4−1. In contrast, the formation of 4-OH-MDZ was hyperbolic with a kcat of 22.9 ± 0.9 nmol min−1 nmol CYP3A4−1 and a Km of 47.5 ± 6.8 μM by fitting to eq 1. The biphasic kinetics of 1′-OH-MDZ formation and the differences in the Km values between 1′-OH and 4-OH-MDZ formation suggested that multiple MDZ molecules were bound simultaneously to CYP3A4. All the values derived from fitting the velocity curves were in line with previous determinations (23, 86–88).
The effect of saturating 240 μM CBZ on the formation of 1′-OH and 4-OH-MDZ is shown in Figure 1B. In the presence of CBZ, 1′-OH-MDZ formation was practically monophasic and showed minimal substrate inhibition, implying that at least one of the MDZ molecules was displaced by CBZ. Fitting the velocity curve to eq 1 yielded a Km and kcat of 12.5 ± 2.1 μM and 18.2 nmol min−1 nmol CYP3A4−1, respectively. The addition of saturating CBZ only partially inhibited 1′-OH-MDZ formation at near saturating MDZ, which suggested that MDZ remained bound in the presence of CBZ. Formation of 4-OH-MDZ remained hyperbolic with a Km and kcat of 57.7 ± 2.1 μM and 19.4 nmol min−1 nmol CYP3A4−1, respectively, by fitting to eq 1. At low [MDZ] and 240 μM CBZ, CBZ appears to competitively inhibit both 1′-OH-MDZ and 4-OH-MDZ formation.
In the absence of CBZ, the ratio of 1′-OH/4-OH-MDZ is known to decrease significantly with increasing [MDZ] (23). Therefore, the effect of CBZ on the ratio of 1′-OH-MDZ/4-OH-MDZ was investigated (Figure 1C). In the absence of CBZ, the 1′-OH/4-OH-MDZ ratio was 7 at low [MDZ] and approached 1 at high [MDZ]. In the presence of saturating [CBZ], the ratio was 3 at low [MDZ] and approached 1 at high [MDZ]. The partial inhibition of 1′-OH-MDZ formation by CBZ and its effects on the 1′-OH/4-OH-MDZ ratios show that MDZ exhibits heterotropic cooperativity with CBZ.
Absorbance Titrations of CYP3A4 with MDZ and CBZ
The CYP3A4 heme absorbance was used to estimate spin state (41–43), determine active site occupancy (38) and measure ligand affinity to CYP3A4 (34, 36) as parameters for eq 6. To measure the spin state, the CYP3A4 absorbance spectra were fit to HS (+5/2) and LS (+1/2) absorbance spectra standards as described in the Materials and Methods (41–43). The affinity of MDZ and CBZ to CYP3A4 was determined by monitoring ligand-induced heme absorbance changes (34, 36).
The fitted absolute absorbance spectra of purified recombinant CYP3A4 in the presence and absence of MDZ and CBZ are shown in Figure 2. In all cases, the correlation coefficient of the fits was >0.996, indicating very accurate fits. CYP3A4 in the absence of ligands had 67% LS and 33% HS (Figure 2A). When 260 μM of MDZ was added to CYP3A4, the %HS increased to 70%. In contrast, the fits to the CYP3A4 heme absorbance with 260 μM of CBZ showed very little spin state change to 34% HS. When both 260 μM MDZ and 260 μM CBZ are added, fits revealed a shift to 55% HS. In this case, the measured MDZ-induced HS shift was ~40% less in the presence of CBZ than in its absence, implying that one of the MDZ molecules was displaced by CBZ.
Figure 2. Determination of HS and LS by least squares fitting of 1 μM recombinant CYP3A4 heme absorbance spectra in the presence of 260 μM MDZ and 260 μM CBZ.

Absolute absorbance spectra of 1 μM CYP3A4 heme in the A) absence of ligands and in the presence of B) 260 μM MDZ, C) 260 μM CBZ and D) 260 μM MDZ and CBZ.
A dilution titration experiment (38) was performed to determine the active site occupancy and the KDs at low [MDZ] (Figure 3). The protein adjusted absorbance difference spectra of CYP3A4 in the presence of MDZ are shown in Figure 3A. The amplitude of the absorbance difference spectra between 390 and 420 nm as a function of [MDZ] and [CYP3A4] is shown in Figure 3B. If only a single molecule of MDZ occupies the active site at low [MDZ], the titration curve shown in Figure 3B will fit well to eq 3. This is indeed the case with a X2 = 8.3 × 10⁻⁷ and an extracted KD value of 7.1±1.1 μM.
Figure 3. Dilution titration with 1 equivalent recombinant CYP3A4 and MDZ.

A) Absorbance difference spectra adjusted for protein concentration at various concentrations of CYP3A4 and MDZ. B) Titration curves (solid squares) derived from the amplitudes of A) and fitted to eq 3.
Figure 4 shows the absorbance difference of purified recombinant CYP3A4 in the presence of MDZ and CBZ in purified CYP3A4. The CYP3A4 heme absorbance difference spectra in the presence of MDZ and the MDZ titration curve are shown in Figure 4A. MDZ caused an increase at 390 nm and decrease at 420 nm, which is characteristic of a type I absorbance shift. The KD and Amax values were determined by fitting the MDZ titration curve with the equilibria defined in Scheme 2 and using GEPASI (18). The fits yielded correlation coefficients of >0.997 for the titration curves, indicating that Scheme 2 modelled the data well. In the absence of CBZ (Figure 4B, right panel), a KD1 of 5.5 ± 2.2 μM and a KD2 of 70.6 ± 29.0 μM were extracted from fitting the titration curve. The Amax of the MDZ titration curve was 0.0342 ± 0.0083 μM−1 cm−1. The KD values correlated well with the Km values of 1′-OH-MDZ (i.e. 5.0 μM) and 4-OH-MDZ (i.e. 47.5 μM) formation.
Figure 4. Absorbance difference of recombinant CYP3A4 in the presence of MDZ and CBZ.

The left and right panels show changes in the UV-visible of the CYP3A4 in the presence of A) MDZ, B) CBZ, C) MDZ and 120 μM CBZ and D) MDZ and 240 μM CBZ. The panels on the left show the absorbance difference and the panels on the right show the amplitudes (solid squares) and fits. The titration curves of A), C) and D) were simulated and fitted using GEPASI and the model in Scheme 2. The titration curve of B) was fit to eq 3.
In contrast, the CYP3A4 heme absorbance difference spectrum in the presence of CBZ shows very modest spin state changes, which is consistent with the least-squares fit of the heme absorbance with CBZ. However, the amplitude of the spin-state change was large enough to estimate a KD,CBZ of 35.5 ± 12.6 μM and Amax of 0.0049 ± 0.0007 μM−1 cm−1 by fitting the titration curve (Figure 4B, right panel) with eq 3. The KD,CBZ deviates somewhat from Km values of 10,11-epoxide formation, which vary between 119–442 μM (26, 89).
Addition of 120 μM CBZ reduces the Δε at 100 μM MDZ in the titration curve from ~0.025 μM−1 cm−1 to ~0.015 μM−1 cm−1 (Figure 4C). Doubling the concentration of CBZ to 240 μM CBZ reduced the Δε at 100 μM MDZ further to ~0.10 μM−1 cm−1 (Figure 4D). Fitting the titration curves with GEPASI using the equilibria shown in Scheme 2 gives a KD,CBZ’ of 22.0 ± 2.1 μM. MDZ was found to have similar effects on the absorbance difference spectra and have similar affinity in Supersomes™ overexpressing CYP3A4 (see Figure S3 of the the Supporting Information).
NMR Proton Assignments of MDZ and CBZ in the Presence of CYP3A4
The NMR peaks of MDZ and CBZ in the absence of CYP3A4 were assigned using the Specral Data Base System (SDBS) for organic compounds and (25). Because of broadening and shifting of NMR peaks by CYP3A4, the NMR peaks of MDZ and CBZ were also assigned at a range of CYP3A4 concentrations.
Figure 5A shows the NMR spectra of 260 μM MDZ in the presence of 0, 0.5 μM and 1 μM CYP3A4. At 0.5 μM of CYP3A4, the proton peaks of MDZ were broadened and shifted considerably from the MDZ proton NMR spectrum without CYP3A4. Increasing the [CYP3A4] to 1 μM shifted and broadened the peaks further. In this case, the proton NMR peaks labeled 9 and 10 on the chlorophenyl group formed a single broad peak. The position of the fluorophenyl proton NMR peaks labeled 4F and 6F are now on opposite sides from their positions at 0 μM CYP3A4. Even higher concentrations of CYP3A4 with MDZ were examined, but the broadening of the NMR peaks made analysis difficult (data not shown).
Figure 5. NMR assignments of MDZ and CBZ at various concentrations of recombinant CYP3A4.

A) MDZ and B) CBZ NMR spectra at 0 μM (top), 0.5 μM (middle) and 1 μM (bottom) CYP3A4.
Figure 5B shows the analogous CYP3A4-induced shifts of the CBZ proton NMR spectrum. The CBZ NMR proton NMR spectrum sharpened with increasing concentrations of CYP3A4.
Deconvolution of the NMR spectra with 260 μM MDZ and CBZ in the Presence of 1 μM Reduced CYP3A4
PCA is a powerful tool for deconvoluting and quantitating very complex overlapping NMR spectra (50–52, 61). In this study, PCA of the NMR spectra was performed using the NMR relaxation spectra as previously described (43, 61). In addition to observing the CYP3A4-induced shifts in the NMR peaks, the first and second principal components from this analysis helped to identify the approximate positions of the overlapping peaks (data not shown). These approximate NMR peak positions were used as starting points for peak fitting.
The deconvolution of 260 μM MDZ and CBZ in the presence of 1 μM reduced CYP3A4 is shown in Figure 6. Figure 6A shows the NMR spectrum with the background subtracted, which had a correlation coefficient of 0.996. Figure 6B shows NMR proton peak standards that were used to fit the proton NMR spectrum in Figure 6A. These NMR assignments were made by analyzing the protein-induced shifts of MDZ and CBZ (Figure 5). The difference between the fit and the data is shown in Figure 6C. The correlation and the lack of well-defined NMR peaks in the residual (Figure 6C) showed that the fit accurately represented the data.
Figure 6. Fitting of NMR Spectrum of 260 μM MDZ and 260 μM CBZ in the presence of 1 μM of reduced recombinant CYP3A4.
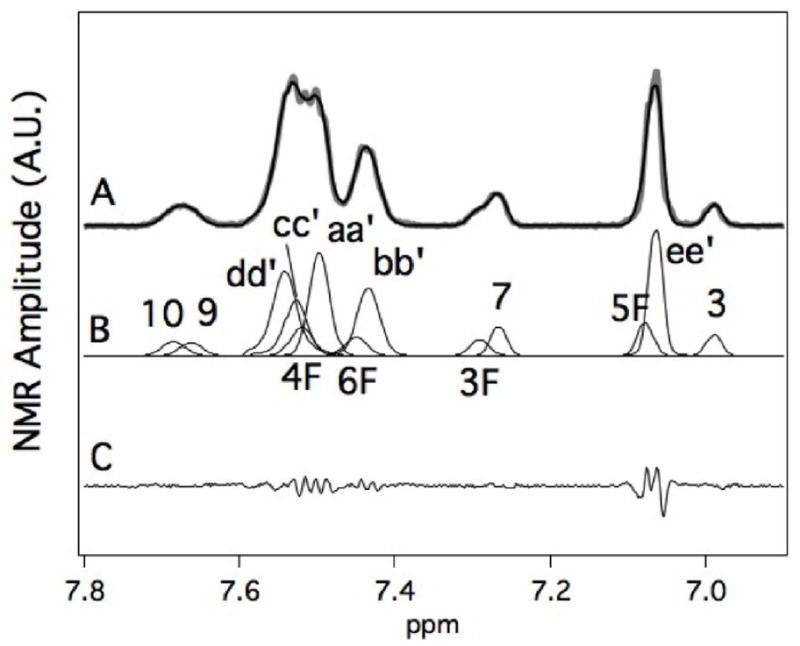
A) NMR spectrum (gray line) and the simulated fit (black line) of the spectrum. B) Simulations of the individual NMR peakes that comprise the CBZ and MDZ spectra. The numbering and lettering correspond to Scheme 1. C) Residual between the simulated fit and the NMR spectrum. The NMR assignments are based on NMR peak fitting of CBZ and MDZ with 1 μM CYP3A4 from Figure 5.
Paramagnetic Relaxation of MDZ and CBZ in the Presence of Recombinant CYP3A4
Paramagnetically-induced NMR relaxation of MDZ and CBZ in the presence of oxidized and reduced CYP3A4 was used to determine the relative orientation and distance of MDZ and CBZ from the heme as described previously (63).
Figure 7 shows the results of the NMR relaxation of 260 μM MDZ and CBZ in the presence of reduced 1 μM CYP3A4. A waterfall representation of individual 1D proton NMR spectra that comprise the NMR relaxation experiment (Figure 7A) shows that at short inversion recovery times the NMR peaks are positive, but decrease as the inversion recovery time is increased. At long inversion recovery times, the absolute NMR peak amplitude is similar to that at short inversion recovery times, but in the opposite direction. In Figure 7B, the 1D proton NMR spectra at 1s was fit by least squares method (46, 48–50, 53) using NMR peak standards from Figure 6. For all inversion recovery times, the correlation values of the fits were 0.99 or greater. Using the simulated peaks and inversion NMR spectra, the inversion recovery time was analyzed using SVD. To validate the NMR peak standards used for PCA analysis, the first and second principal components of the NMR relaxation spectra were determined and were simulated from the NMR peak standards (Figure 7C). The correlation of the experimental and simulated curves was 0.996 and 0.967 for the first and second principal components, respectively, indicating that the NMR standards were appropriate for PCA analysis. To show the robustness of the SVD method, the SVD-determined NMR relaxation curve of the buried 4F proton NMR peak is shown in Figure 7D. The curve fit well to a single exponential function with a rate of ~1 sec−1 and a χ2 of 0.1.
Figure 7. NMR inversion recovery experiment of 260 μM MDZ and CBZ in the presence of 1 μM recombinant CYP3A4.

A) Waterfall plot of NMR spectra of 260 μM MDZ and CBZ as a function of inversion recovery time. B) NMR spectrum (thick black line) from A) and least squares fit (thin black line) at an inversion recovery time of 1 sec with an arrow showing the position of the 4F proton peak. C) Experimentally-determined (thick black line) and simulated (thin black line) first (PC1) and second principal components (PC2) of the NMR relaxation spectra. D) SVD analysis of the inversion recovery of proton peak 4F (closed squares) and fit to a single exponential function (line) at the position shown by the arrow in panel B.
Tables 1 and 2 show the NMR relaxation rates and calculated distances between the protons of 260 μM MDZ and 260 μM CBZ to CYP3A4. The first two columns of these tables show the relaxation rates for oxidized Fe3+ CYP3A4 and reduced-CO Fe2+ CYP3A4. The calculated paramagnetic relaxation (RP) is in column 3. Using the Solomon-Bloembergen equation (eq 6) and treatment described in the Materials and Methods, the apparent time-averaged distances (rapp and rmin) were calculated in columns 4 and 5. Column 4 assumes that all the protons are equidistant, while column 5 assumes that only one of the protons is close to the heme iron.
The individual RP values of protons from MDZ or CBZ bound to CYP3A4 are shown in Table 1 and range from ~0 to 1.3 sec−1. The distances calculated from the RPs reveal that the chlorophenyl group of MDZ is oriented closer to the heme than the fluorophenyl group with average distances of ~10 and ~13 Å, respectively. Depending on the orientation, the distance of 1′-CH3 varied between 7.6–9.2 Å. For CBZ, there was only a 30% variation in the proton RPs and the calculated distances were approximately 7–8 Å on average.
The RPs and the calculated distances for MDZ and CBZ bound simultaneously to CYP3A4 are shown in Table 2. The orientation of MDZ and position in the presence of CBZ was similar to MDZ by itself with an important difference. The average RP of the fluorophenyl protons was 0.1 sec−1 versus 0.15 sec−1 with MDZ alone, indicating that the fluorphenyl group is farther away in the presence of CBZ. For CBZ, the RPs were considerably weaker (RP < 0.04) in the presence of MDZ, suggesting that MDZ displaces CBZ from the heme.
In an earlier study (25), there were very little differences in the calculated MDZ proton-CYP3A4 heme Fe distances, suggesting a parallel orientation of the molecule with respect to the heme. However, the study was done at low [CYP3A4], which will be relatively insensitive to MDZ orientation. To increase the sensitivity of the NMR relaxation measurement, the protein concentration was increased 5-fold to 1 μM CYP3A4 in this study. Curve fitting and PCA analysis improved sensitivity of the NMR relaxation studies further, but reliable measurements of the 4a and 4b proton NMR peaks could not be made at either concentration. Therefore, in this study, the 4a/4b proton-iron distances were determined from the distance-restrained molecular dynamics simulations of the molecule with CYP3A4.
Because of chemical equivalence and time averaging, Tables 1 and 2 only give a qualitative picture of the orientation and position of MDZ and CBZ molecules in the CYP3A4 active site. Therefore, the calculated distances were combined with computer modeling.
Molecular Docking and Distance-Restrained CYP3A4 Models Complexed with MDZ and CBZ
Distances calculated from the Rps were used to restrain MDZ and CBZ in the active site of CYP3A4. Distance restrained simulated annealing was then used to find the global minimum for these molecules. Unfortunately, NMR relaxation experiments with the CYP3A4•MDZ complex were not possible because of the high [MDZ] required for the NMR experiments. Therefore, molecular docking of a single molecule of MDZ to CYP3A4 was performed using AutoDock 4.2.
Figure 8 shows the CYP3A4-drug complexes deduced from molecular docking and simulated annealing simulations. The twenty binding modes of MDZ deduced from the AutoDock 4.2 simulation were clustered into a single binding orientation in Figures 8A with a calculated KD of 18–19 μM, which correlates fairly well to the experimental KM of 5–11 μM for 1′-OH-MDZ formation (23, 86–88). In this orientation, the protons at the 1′ and 4 positions are on average 4 Å and 6 Å from the heme iron, respectively. The fluorophenyl group of MDZ interacts within a hydrophobic pocket formed by F108, F213 and F304, and the fluorine interacts with S119. The chlorophenyl group interacts with I301, while the imidazole interacts with A370. The CH3 of the T309 interacts with 1′-CH3 of MDZ, keeping it close to the heme. This interaction may explain the observation that the T309F CYP3A4 mutant only produced the 1′-OH-MDZ product (88). The MDZ diazepine functional group is also stabilized by hydrogen bonding with R105 and R212.
Figure 8. Distance-restrained models of CYP3A4 with A) MDZ, B) CBZ, C) 2 MDZ and D) MDZ and CBZ in the active site of CYP3A4.

The left panels show stick models of the ligand, interacting residues (green) and the heme (red) with a cartoon (gray) representation of CYP3A4 in the background. The carbons of the active drug (MDZ or CBZ) are colored orange, while the carbons of the effector drug are colored magenta. When applicable to a specific model, R212, F304 and T309 are hidden for clarity. Cartoons of these panels are shown on the right with the heme as a line and a circle. The arrows denote interactions between active and effector drugs. Dotted lines indicate hydrogen bonds and arrows indicate interactions between molecules. Dashed lines with labeled distances show the average distance between the carbon at the 1′ or 4 positions of MDZ, and the heme iron.
The orientation and position of a single molecule of CBZ restrained in the active site of CYP3A4 is shown in Figure 8B. In the simulation, the CBZ molecule rotates around the azepine nitrogen and carboxyamide oxygen, which are hydrogen-bonded to R105 and R212, respectively. During the rotation, the phenyl groups interact with several hydrophobic residues, including F304 and the aliphatic parts of R372 and E374. The average proton-heme distance was ~7 Å for restrained protons, while the amide protons of the carboxyamide were ~10 Å from the heme iron.
Two MDZ molecules restrained in the active site of CYP3A4 are shown in Figure 8C. The MDZ molecules are stacked in a parallel orientation. Using the nomenclature described in (90), the closer of the two MDZ molecules to the heme in the model will be referred to as the active MDZ, while the other MDZ molecule will be referred to as the effector MDZ. The imidazole and the fluorophenyl functional groups of these molecules are stacked together, while the chlorophenyl group is stacked against the diazepam group of the respective MDZ molecule. The imidazole and diazepam groups of the effector MDZ were sequestered in a pocket formed by F47 and F215. The 1′-CH3 group of this molecule interacts with the alkyl parts of R372 and E374. The fluorophenyl group of this molecule occupies a hydrophobic pocket composed of F220, F108, F213 and F241. In contrast, the fluorophenyl group of the active MDZ fits into a hydrophobic pocket formed by F241, F304, S119, I120 and I301. Mutating I120 or F304 to tryptophan dramatically increases the 1′-OH-MDZ/4-OH-MDZ ratio, while mutating the S119 or F304 to alanine dramatically decreases this ratio (88). The 1′-CH3 interacts with another hydrophobic pocket on the opposite side of the molecule that is composed of I369, M371, A370 and I369. The functional group’s average proton distance is ~9 Å from the heme iron. The diazepine group is stabilized by hydrogen bonds from R212 and put the protons at position 4 are an average of 4 Å from the heme iron.
Stacking of molecules within the CYP active site has been observed in both bacterial and mammalian P450s (8, 15, 90). A computational study with diazepam found the molecules in a stacked parallel configuration in the CYP3A4 active site (90) similar to this study. A stacked parallel configuration was also observed for 9-aminophenanthrene and androstenedione in the X-ray crystal structure of P450eryF (15). In contrast, the ketoconazole molecules in the ketoconazole-bound X-ray crystal structure of CYP3A4 were in an antiparallel orientation (8).
In the model of CYP3A4 with MDZ and CBZ shown in Figure 8D, the CBZ molecule lies against the active MDZ molecule in the CYP3A4 active site. The presence of the MDZ molecule shifts CBZ away from the heme and the molecule no longer rotates freely in the active site. The phenyl groups of CBZ interact with the chlorophenyl, fluorophenyl, and the 1′-CH3 groups of MDZ. One phenyl group binds to a hydrophobic pocket formed by F108, F213 and F220. The other phenyl group interacts with hydrophobic residues, F57 and F215, and the alkyl groups of R372 and E374. The azepine nitrogen and the amide of CBZ form hydrogen bonds with R105 and R106, respectively. The diazapine group of MDZ was hydrogen-bonded to R212. The MDZ protons at position 4 were closer to the heme than the 1′-CH3 protons with average distances of 4 Å and 8 Å, respectively.
Heterotropic and Homotropic Cooperativity of Midazolam Metabolism by CYP3A4
A model of MDZ metabolism by CYP3A4 was derived from NMR and computational modeling and is shown in Scheme 3. AutoDock 4.2 revealed that MDZ is clustered into a single high affinity orientation, which is shown in Scheme 3B as a single molecule of MDZ with the protons at the 1′-CH3 closer to the heme than those at position 4. This is consistent with the experimental observation that the rate of 1′-OH-MDZ formation by CYP3A4 is higher at low [MDZ] than 4-OH-MDZ formation. 4-OH-MDZ is still produced in this orientation because position 4 is not far enough away from the heme to completely inhibit the reaction. At low [MDZ] and relatively high [CBZ], CBZ will competitively displace MDZ, forming the CYP•CBZ complex in Scheme 3C. Scheme 3D shows the effect of CBZ or higher concentrations of MDZ on the orientation of the active MDZ, forming either the CYP•MDZ•CBZ or CYP•MDZ•MDZ complexes. At these relatively high [MDZ], CBZ will not be able to displace the active MDZ because of its higher affinity to CYP3A4. In the NMR-derived models, the molecules form a stacked configuration in the CYP3A4 active site. In this configuration, the protons at position 4 of the active MDZ are shifted closer to the heme than protons at the 1′-CH3 position. Assuming that the rate of product formation is dictated by distance, the rate of 4-OH-MDZ formation will increase with respect to the formation of 1′-OH-MDZ. This will lead to a reduction in the 1′-OH/4-OH-MDZ ratios, which is in line with the observed kinetics. Experimentally, the absolute rate of 4-OH-MDZ formation did not exceed the rate of 1′-OH-MDZ formation in the presence of high concentrations of MDZ or CBZ. That was because the rate of oxidation was not only a function of distance, but also other characteristics such as reactivity, steric factors and residence time in the active site. Since the stacked configuration was observed in an X-ray crystal structure of CYP3A4 with ketoconazole (8) and computer modeling of diazepam (90) in addition to this study, it may represent a common structural motif of homotropic and heterotropic cooperativity.
Scheme 3.

Model of Heterotropic and Homotropic Cooperativity of MDZ Metabolism by CYP3A4.
A) CYP3A4 without ligands. B) CYP3A4 with a single molecule of MDZ oriented with the 1′-CH3 close to the heme. C) Competitive inhibition of MDZ formation by CBZ at low [MDZ] D) CYP3A4 with an effector molecule of MDZ or CBZ that forces the 4-position of the MDZ closer to the heme. The double arrows reflect the equilibrium between the various states. The solid and the dashed arrows reflect increasing and decreasing rates of product formation, respectively.
Supplementary Material
Acknowledgments
We thank Jill L. Hartmann for editing the manuscript.
ABBREVIATIONS
- 1′-OH-MDZ
1′-hydroxymidazolam
- 4-OH-MDZ
4-hydroxymidazolam
- α-NF
α-naphthoflavone
- CBZ
carbamazepine
- CYP
cytochrome P450
- CYP3A4
cytochrome P450 3A4
- cyt
cytochrome
- LS
low spin
- δ-ALA
δ-aminolevulinic acid
- GC-MS
gas chromatography-mass spectrometry
- HS
high spin
- IPTG
isopropyl β-D-1-thiogalactopyranoside
- KPi
potassium phosphate
- MTBSTFA
N-methyl-N-(t-butyldimethylsilyl)-trifluoroacetamide
- MDZ
midazolam
- NMR
nuclear magnetic resonance
- P420
ferric P420
- PCA
principal component analysis
- rapp
apparent distance
- ravg
average distance
- RP
paramagnetic relaxation
- SDBS
Spectral DataBase System for organic compounds
- SDS-PAGE
sodium dodecyl sulfate-polyacrylamide gel electrophoresis
- SVD
singular value decomposition
- T1 relaxation
longitudinal T1 relaxation
- TLC
thin-layer chromatography
- TST
testosterone
- WATERGATE
WATER suppression by GrAdient Tailored Excitation
Footnotes
This study was supported by National Institute of Health (NIH) grants GM 032165, GM 054995, 1S10RR023044-01 (Multi-Tiered Proteomic Compute Cluster) and startup funds from the University of Georgia, School of Pharmacy.
SUPPORTING INFORMATION STATEMENT: Figure S1 shows the results of a simulation of ravg, rapp and RP of a dynamic phenyl molecule near to a heme. Figure S2 is SEC of CYP3A4 with and without Anapoe C10E12. The UV-visible titrations of Supersomes™ overexpressing CYP3A4 with MDZ and CBZ are shown in Figure S3. Figure S4 illustrates the shifts and broadening of MDZ and CBZ NMR proton peaks in the presence of oxidized and reduced CYP3A4. Table S1 of the Supporting Information show additional force field parameters that were used for the MD simulations and the energy minimization to ligate C436 to the heme. This material is available free of charge via the Internet at http://pubs.acs.org.
References
- 1.Guengerich FP. Cytochrome P-450 3A4: regulation and role in drug metabolism. Annu Rev Pharmacol Toxicol. 1999;39:1–17. doi: 10.1146/annurev.pharmtox.39.1.1. [DOI] [PubMed] [Google Scholar]
- 2.Ortiz de Montellano PR. Cytochrome P450 : Structure, Mechanism, and Biochemistry. 3. Plenum Publishing; New York: 2004. [Google Scholar]
- 3.Guengerich FP. Human cytochrome P450 enzymes. In: Ortiz de Montellano PR, editor. Cytochrome P450: Structure, Mechanism, and Biochemistry. 2. Plenum; New York: 1995. [Google Scholar]
- 4.Atkins WM. Implications of the allosteric kinetics of cytochrome P450s. Drug Discovery Today. 2004;9:478–484. doi: 10.1016/S1359-6446(04)03072-7. [DOI] [PubMed] [Google Scholar]
- 5.Yano JK, Wester MR, Schoch GA, Griffin KJ, Stout CD, Johnson EF. The structure of human microsomal cytochrome P450 3A4 determined by X-ray crystallography to 2.05 Å resolution. J Biol Chem. 2004;279:38091–38094. doi: 10.1074/jbc.C400293200. [DOI] [PubMed] [Google Scholar]
- 6.Williams PA, Cosme J, Vinkovic DM, Ward A, Angove HC, Day PJ, Vonrhein C, Tickle IJ, Jhoti H. Crystal structures of human cytochrome P450 3A4 bound to metyrapone and progesterone. Science. 2004;305:683–686. doi: 10.1126/science.1099736. [DOI] [PubMed] [Google Scholar]
- 7.Sevrioukova IF, Poulos TL. Structure and mechanism of the complex between cytochrome P4503A4 and ritonavir. Proc Natl Acad Sci U S A. 2010;107:18422–18427. doi: 10.1073/pnas.1010693107. [DOI] [PMC free article] [PubMed] [Google Scholar]
- 8.Ekroos M, Sjogren T. Structural basis for ligand promiscuity in cytochrome P450 3A4. Proc Natl Acad Sci U S A. 2006;103:13682–13687. doi: 10.1073/pnas.0603236103. [DOI] [PMC free article] [PubMed] [Google Scholar]
- 9.Egnell AC, Houston JB, Boyer CS. Predictive models of CYP3A4 heteroactivation: in vitro-in vivo scaling and pharmacophore modeling. J Pharmacol Exp Ther. 2005;312:926–937. doi: 10.1124/jpet.104.078519. [DOI] [PubMed] [Google Scholar]
- 10.Hutzler JM, Frye RF, Korzekwa KR, Branch RA, Huang SM, Tracy TS. Minimal in vivo activation of CYP2C9-mediated flurbiprofen metabolism by dapsone. Eur J Pharm Sci. 2001;14:47–52. doi: 10.1016/s0928-0987(01)00144-0. [DOI] [PubMed] [Google Scholar]
- 11.Lasker JM, Huang MT, Conney AH. In vitro and in vivo activation of oxidative drug metabolism by flavonoids. J Pharmacol Exp Ther. 1984;229:162–170. [PubMed] [Google Scholar]
- 12.Tang W, Stearns RA, Kwei GY, Iliff SA, Miller RR, Egan MA, Yu NX, Dean DC, Kumar S, Shou M, Lin JH, Baillie TA. Interaction of diclofenac and quinidine in monkeys: stimulation of diclofenac metabolism. J Pharmacol Exp Ther. 1999;291:1068–1074. [PubMed] [Google Scholar]
- 13.Roberts AG, Campbell AP, Atkins WM. The thermodynamic landscape of testosterone binding to cytochrome P450 3A4: ligand binding and spin state equilibria. Biochemistry. 2005;44:1353–1366. doi: 10.1021/bi0481390. [DOI] [PubMed] [Google Scholar]
- 14.Isin EM, Guengerich FP. Kinetics and thermodynamics of ligand binding by cytochrome P450 3A4. J Biol Chem. 2006;281:9127–9136. doi: 10.1074/jbc.M511375200. [DOI] [PubMed] [Google Scholar]
- 15.Cupp-Vickery J, Anderson R, Hatziris Z. Crystal structures of ligand complexes of P450eryF exhibiting homotropic cooperativity. Proc Natl Acad Sci U S A. 2000;97:3050–3055. doi: 10.1073/pnas.050406897. [DOI] [PMC free article] [PubMed] [Google Scholar]
- 16.Korzekwa KR, Krishnamachary N, Shou M, Ogai A, Parise RA, Rettie AE, Gonzalez FJ, Tracy TS. Evaluation of atypical cytochrome P450 kinetics with two-substrate models: evidence that multiple substrates can simultaneously bind to cytochrome P450 active sites. Biochemistry. 1998;37:4137–4147. doi: 10.1021/bi9715627. [DOI] [PubMed] [Google Scholar]
- 17.Ueng YF, Kuwabara T, Chun YJ, Guengerich FP. Cooperativity in oxidations catalyzed by cytochrome P450 3A4. Biochemistry. 1997;36:370–381. doi: 10.1021/bi962359z. [DOI] [PubMed] [Google Scholar]
- 18.Roberts AG, Atkins WM. Energetics of heterotropic cooperativity between α-naphthoflavone and testosterone binding to CYP3A4. Arch Biochem Biophys. 2007;463:89–101. doi: 10.1016/j.abb.2007.03.006. [DOI] [PMC free article] [PubMed] [Google Scholar]
- 19.Koley AP, Buters JT, Robinson RC, Markowitz A, Friedman FK. CO binding kinetics of human cytochrome P450 3A4. Specific interaction of substrates with kinetically distinguishable conformers. J Biol Chem. 1995;270:5014–5018. doi: 10.1074/jbc.270.10.5014. [DOI] [PubMed] [Google Scholar]
- 20.Koley AP, Buters JT, Robinson RC, Markowitz A, Friedman FK. Differential mechanisms of cytochrome P450 inhibition and activation by α-naphthoflavone. J Biol Chem. 1997;272:3149–3152. doi: 10.1074/jbc.272.6.3149. [DOI] [PubMed] [Google Scholar]
- 21.Maenpaa J, Hall SD, Ring BJ, Strom SC, Wrighton SA. Human cytochrome P450 3A (CYP3A) mediated midazolam metabolism: the effect of assay conditions and regioselective stimulation by alpha-naphthoflavone, terfenadine and testosterone. Pharmacogenetics. 1998;8:137–155. [PubMed] [Google Scholar]
- 22.Kang P, Liao M, Wester MR, Leeder JS, Pearce RE, Correia MA. CYP3A4-Mediated carbamazepine (CBZ) metabolism: formation of a covalent CBZ-CYP3A4 adduct and alteration of the enzyme kinetic profile. Drug Metab Dispos. 2008;36:490–499. doi: 10.1124/dmd.107.016501. [DOI] [PMC free article] [PubMed] [Google Scholar]
- 23.Williams JA, Ring BJ, Cantrell VE, Jones DR, Eckstein J, Ruterbories K, Hamman MA, Hall SD, Wrighton SA. Comparative metabolic capabilities of CYP3A4, CYP3A5, and CYP3A7. Drug Metab Dispos. 2002;30:883–891. doi: 10.1124/dmd.30.8.883. [DOI] [PubMed] [Google Scholar]
- 24.Maekawa K, Yoshimura T, Saito Y, Fujimura Y, Aohara F, Emoto C, Iwasaki K, Hanioka N, Narimatsu S, Niwa T, Sawada J. Functional characterization of CYP3A4.16: catalytic activities toward midazolam and carbamazepine. Xenobiotica. 2009;39:140–147. doi: 10.1080/00498250802617746. [DOI] [PubMed] [Google Scholar]
- 25.Cameron MD, Wen B, Allen KE, Roberts AG, Schuman JT, Campbell AP, Kunze KL, Nelson SD. Cooperative binding of midazolam with testosterone and α-naphthoflavone within the CYP3A4 active site: a NMR T1 paramagnetic relaxation study. Biochemistry. 2005;44:14143–14151. doi: 10.1021/bi051689t. [DOI] [PubMed] [Google Scholar]
- 26.Kerr BM, Thummel KE, Wurden CJ, Klein SM, Kroetz DL, Gonzalez FJ, Levy RH. Human liver carbamazepine metabolism. Role of CYP3A4 and CYP2C8 in 10,11-epoxide formation. Biochem Pharmacol. 1994;47:1969–1979. doi: 10.1016/0006-2952(94)90071-x. [DOI] [PubMed] [Google Scholar]
- 27.Wolkenstein P, Tan C, Lecoeur S, Wechsler J, Garcia-Martin N, Charue D, Bagot M, Beaune P. Covalent binding of carbamazepine reactive metabolites to P450 isoforms present in the skin. Chem Biol Interact. 1998;113:39–50. doi: 10.1016/s0009-2797(98)00021-0. [DOI] [PubMed] [Google Scholar]
- 28.Nakamura H, Torimoto N, Ishii I, Ariyoshi N, Nakasa H, Ohmori S, Kitada M. CYP3A4 and CYP3A7-mediated carbamazepine 10,11-epoxidation are activated by differential endogenous steroids. Drug Metab Dispos. 2003;31:432–438. doi: 10.1124/dmd.31.4.432. [DOI] [PubMed] [Google Scholar]
- 29.Paine MF, Khalighi M, Fisher JM, Shen DD, Kunze KL, Marsh CL, Perkins JD, Thummel KE. Characterization of interintestinal and intraintestinal variations in human CYP3A-dependent metabolism. J Pharmacol Exp Ther. 1997;283:1552–1562. [PubMed] [Google Scholar]
- 30.Segel IH. Enzyme Kinetics: Behavior and Analysis of Rapid Equilibrium and Steady-State Enzyme Systems. John Wiley & Sons, Inc; New York: 1975. [Google Scholar]
- 31.Copeland RA. Enzymes: A Practical Introduction to Structure, Mechanism, and Data Analysis. 2. Wiley-VCH; Weinheim, Germany: 2000. [Google Scholar]
- 32.Gillam EM, Baba T, Kim BR, Ohmori S, Guengerich FP. Expression of modified human cytochrome P450 3A4 in Escherichia coli and purification and reconstitution of the enzyme. Arch Biochem Biophys. 1993;305:123–131. doi: 10.1006/abbi.1993.1401. [DOI] [PubMed] [Google Scholar]
- 33.Froger A, Hall JE. Transformation of plasmid DNA into E. coli using the heat shock method. J Vis Exp. 2007:253. doi: 10.3791/253. [DOI] [PMC free article] [PubMed] [Google Scholar]
- 34.Omura T, Sato R. The carbon monoxide-binding pigment of liver microsomes. II solubilization, purification, and properties. J Biol Chem. 1964;239:2379–2385. [PubMed] [Google Scholar]
- 35.Meunier DM. Molecular weight determinations. In: Settle FA, editor. Handbook of Instrumental Techniques for Analytical Chemistry. Prentice Hall PTR; Upper Saddle River, NJ: 1997. p. xxi.p. 995. [Google Scholar]
- 36.Jefcoate CR. Measurement of substrate and inhibitor binding to microsomal cytochrome P-450 by optical-difference spectroscopy. Methods Enzymol. 1978;52:258–279. doi: 10.1016/s0076-6879(78)52029-6. [DOI] [PubMed] [Google Scholar]
- 37.Hildebrandt A, Remmer H, Estabrook RW. Cytochrome P-450 of liver microsomes-one pigment or many. Biochem Biophys Res Commun. 1968;30:607–612. doi: 10.1016/0006-291x(68)90555-x. [DOI] [PubMed] [Google Scholar]
- 38.Fernando H, Halpert JR, Davydov DR. Resolution of multiple substrate binding sites in cytochrome P450 3A4: The stoichiometry of the enzyme-substrate complexes probed by FRET and Job’s titration. Biochemistry. 2006;45:4199–4209. doi: 10.1021/bi052491b. [DOI] [PMC free article] [PubMed] [Google Scholar]
- 39.Morrison JF. Kinetics of the reversible inhibition of enzyme-catalysed reactions by tight-binding inhibitors. Biochim Biophys Acta. 1969;185:269–286. doi: 10.1016/0005-2744(69)90420-3. [DOI] [PubMed] [Google Scholar]
- 40.Mendes P, Kell D. Non-linear optimization of biochemical pathways: applications to metabolic engineering and parameter estimation. Bioinformatics. 1998;14:869–883. doi: 10.1093/bioinformatics/14.10.869. [DOI] [PubMed] [Google Scholar]
- 41.Davydov DR, Deprez E, Hoa GH, Knyushko TV, Kuznetsova GP, Koen YM, Archakov AI. High-pressure-induced transitions in microsomal cytochrome P450 2B4 in solution: evidence for conformational inhomogeneity in the oligomers. Arch Biochem Biophys. 1995;320:330–344. doi: 10.1016/0003-9861(95)90017-9. [DOI] [PubMed] [Google Scholar]
- 42.Renaud JP, Davydov DR, Heirwegh KP, Mansuy D, Hui Bon Hoa GH. Thermodynamic studies of substrate binding and spin transitions in human cytochrome P-450 3A4 expressed in yeast microsomes. Biochem J. 1996;319(Pt 3):675–681. doi: 10.1042/bj3190675. [DOI] [PMC free article] [PubMed] [Google Scholar]
- 43.Roberts AG, Sjogren SE, Fomina N, Vu KT, Almutairi A, Halpert JR. NMR-derived models of amidopyrine and its metabolites in complexes with rabbit cytochrome P450 2B4 reveal a structural mechanism of sequential N-dealkylation. Biochemistry. 2011;50:2123–2134. doi: 10.1021/bi101797v. [DOI] [PMC free article] [PubMed] [Google Scholar]
- 44.Piotto M, Saudek V, Sklenar V. Gradient-tailored excitation for single-quantum NMR spectroscopy of aqueous solutions. J Biomol NMR. 1992;2:661–665. doi: 10.1007/BF02192855. [DOI] [PubMed] [Google Scholar]
- 45.Prost E, Sizun P, Piotto M, Nuzillard JM. A simple scheme for the design of solvent-suppression pulses. J Magn Reson. 2002;159:76–81. doi: 10.1016/s1090-7807(02)00003-4. [DOI] [PubMed] [Google Scholar]
- 46.Bruce SD, Higinbotham J, Marshall I, Beswick PH. An analytical derivation of a popular approximation of the Voigt function for quantification of NMR spectra. J Magn Reson. 2000;142:57–63. doi: 10.1006/jmre.1999.1911. [DOI] [PubMed] [Google Scholar]
- 47.Marshall I, Bruce SD, Higinbotham J, MacLullich A, Wardlaw JM, Ferguson KJ, Seckl J. Choice of spectroscopic lineshape model affects metabolite peak areas and area ratios. Magn Reson Med. 2000;44:646–649. doi: 10.1002/1522-2594(200010)44:4<646::aid-mrm20>3.0.co;2-0. [DOI] [PubMed] [Google Scholar]
- 48.Marshall I, Higinbotham J, Bruce S, Freise A. Use of Voigt lineshape for quantification of in vivo 1H spectra. Magn Reson Med. 1997;37:651–657. doi: 10.1002/mrm.1910370504. [DOI] [PubMed] [Google Scholar]
- 49.Massiot D, Fayon F, Capron M, King I, Calvé SL, Alonso B, Durand JO, Bujoli B, Gan Z, Hoatson G. Modelling one- and two-dimensional solid-state NMR spectra. Magn Reson Chem. 2002;40:70– 76. [Google Scholar]
- 50.Ammann LP, Merritt M, Sagalowsky A, Nurenberg P. Peak-finding partial least squares for the analysis of 1H NMR spectra. Chemometrics and Intelligent Laboratory Systems. 2006;20:231–238. [Google Scholar]
- 51.Kuesel AC, Stoyanova R, Aiken NR, Li CW, Szwergold BS, Shaller C, Brown TR. Quantitation of resonances in biological 31P NMR spectra via principal component analysis: potential and limitations. NMR Biomed. 1996;9:93–104. doi: 10.1002/(SICI)1099-1492(199605)9:3<93::AID-NBM410>3.0.CO;2-D. [DOI] [PubMed] [Google Scholar]
- 52.Stoyanova R, Brown TR. NMR spectral quantitation by principal component analysis. NMR Biomed. 2001;14:271–277. doi: 10.1002/nbm.700. [DOI] [PubMed] [Google Scholar]
- 53.Kielkopf JF. New approximation to the Voigt function with applications to spectral-line profile analysis. J Opt Soc Am. 1973;63:987–995. [Google Scholar]
- 54.Lupu M, Todor D. A singular value decomposition based algorithm for multicomponent exponential fitting of NMR relaxation signals. Chemometrics and Intelligent Laboratory Systems. 1995;29:11–17. [Google Scholar]
- 55.Xu Q, Sachs JR, Wang TC, Schaefer WH. Quantification and identification of components in solution mixtures from 1D proton NMR spectra using singular value decomposition. Anal Chem. 2006;78:7175–7185. doi: 10.1021/ac0606857. [DOI] [PubMed] [Google Scholar]
- 56.Alipanahi B, Gao X, Karakoc E, Donaldson L, Li M. PICKY: a novel SVD-based NMR spectra peak picking method. Bioinformatics. 2009;25:i268–i275. doi: 10.1093/bioinformatics/btp225. [DOI] [PMC free article] [PubMed] [Google Scholar]
- 57.Trbovic N, Smirnov S, Zhang F, Bruschweiler R. Covariance NMR spectroscopy by singular value decomposition. J Magn Reson. 2004;171:277–283. doi: 10.1016/j.jmr.2004.08.007. [DOI] [PubMed] [Google Scholar]
- 58.Grahn H, Delaglio F, Delsuc MA, Levy GC. Multivariate data analysis for pattern recognition in two-dimensional NMR. J Magn Reson. 1988;77:294–307. [Google Scholar]
- 59.Stoica P, Selen Y, Sandgren N, Van Huffel S. Using prior knowledge in SVD-based parameter estimation for magnetic resonance spectroscopy--the ATP example. IEEE Trans Biomed Eng. 2004;51:1568–1578. doi: 10.1109/TBME.2004.828031. [DOI] [PubMed] [Google Scholar]
- 60.Chen H, Van Huffel S, van Ormondt D, de Beer R. Parameter estimation with prior knowledge of known signal poles for the quantification of NMR spectroscopy data in the time domain. Journal of Magnetic Resonance, Series A. 1996;119:225–234. [Google Scholar]
- 61.Viereck N, Nørgaard L, Bro R, Engelsen SB. Chemometric Analysis of NMR Data. In: Webb GA, editor. Modern Magnetic Resonance. Springer Netherlands; Netherlands: 2006. pp. 1833–1843. [Google Scholar]
- 62.Kowalewski J, Mäler L. Nuclear spin relaxation in liquids : theory, experiments, and applications. Taylor & Francis; New York: 2006. [Google Scholar]
- 63.Cameron MD, Wen B, Roberts AG, Atkins WM, Campbell AP, Nelson SD. Cooperative binding of acetaminophen and caffeine within the P450 3A4 active site. Chem Res Toxicol. 2007;20:1434–1441. doi: 10.1021/tx7000702. [DOI] [PubMed] [Google Scholar]
- 64.Villafranca JJ. Paramagnetic probes of macromolecules. Methods Enzymol. 1989;177:403–413. doi: 10.1016/0076-6879(89)77023-3. [DOI] [PubMed] [Google Scholar]
- 65.Solomon I. Relaxation processes in a system of two spins. Physical Review. 1955;99:559–565. [Google Scholar]
- 66.Modi S, Primrose WU, Boyle JM, Gibson CF, Lian LY, Roberts GC. NMR studies of substrate binding to cytochrome P450 BM3: comparisons to cytochrome P450 cam. Biochemistry. 1995;34:8982–8988. doi: 10.1021/bi00028a006. [DOI] [PubMed] [Google Scholar]
- 67.Dwek RA. Nuclear Magnetic Resonance (NMR) in Biochemistry: Applications to Enzyme Systems. Oxford University Press; 1973. [Google Scholar]
- 68.Tsalkova TN, Davydova NY, Halpert JR, Davydov DR. Mechanism of interactions of α-naphthoflavone with cytochrome P450 3A4 explored with an engineered enzyme bearing a fluorescent probe. Biochemistry. 2007;46:106–119. doi: 10.1021/bi061944p. [DOI] [PMC free article] [PubMed] [Google Scholar]
- 69.Davydov DR, Fernando H, Halpert JR. Variable path length and counter-flow continuous variation methods for the study of the formation of high-affinity complexes by absorbance spectroscopy. An application to the studies of substrate binding in cytochrome P450. Biophys Chem. 2006;123:95–101. doi: 10.1016/j.bpc.2006.04.007. [DOI] [PubMed] [Google Scholar]
- 70.Clore GM, Iwahara J. Theory, practice, and applications of paramagnetic relaxation enhancement for the characterization of transient low-population states of biological macromolecules and their complexes. Chem Rev. 2009;109:4108–4139. doi: 10.1021/cr900033p. [DOI] [PMC free article] [PubMed] [Google Scholar]
- 71.Iwahara J, Schwieters CD, Clore GM. Ensemble approach for NMR structure refinement against 1H paramagnetic relaxation enhancement data arising from a flexible paramagnetic group attached to a macromolecule. J Am Chem Soc. 2004;126:5879–5896. doi: 10.1021/ja031580d. [DOI] [PubMed] [Google Scholar]
- 72.Gay SC, Roberts AG, Maekawa K, Talakad JC, Hong WX, Zhang Q, Stout CD, Halpert JR. Structures of cytochrome P450 2B4 complexed with the antiplatelet drugs ticlopidine and clopidogrel. Biochemistry. 2010;49:8709–8720. doi: 10.1021/bi100914z. [DOI] [PMC free article] [PubMed] [Google Scholar]
- 73.Morris GM, Goodsell DS, Halliday RS, Huey R, Hart WE, Belew RK, Olson AJ. Automated docking using a lamarckian genetic algorithm and an empirical binding free energy function. J Comput Chem. 1998;19:1639–1662. [Google Scholar]
- 74.Eswar N, Eramian D, Webb B, Shen MY, Sali A. Protein structure modeling with MODELLER. Methods Mol Biol. 2008;426:145–159. doi: 10.1007/978-1-60327-058-8_8. [DOI] [PubMed] [Google Scholar]
- 75.Halgren TA. Merck molecular force field. I Basis, form, scope, parameterization, and performance of MMFF94. J Comput Chem. 1996;17:490–519. [Google Scholar]
- 76.Helms V, Wade RC. Thermodynamics of water mediating protein-ligand interactions in cytochrome P450cam: a molecular dynamics study. Biophys J. 1995;69:810–824. doi: 10.1016/S0006-3495(95)79955-6. [DOI] [PMC free article] [PubMed] [Google Scholar]
- 77.Brunger AT, Adams PD, Rice LM. New applications of simulated annealing in X-ray crystallography and solution NMR. Structure. 1997;5:325–336. doi: 10.1016/s0969-2126(97)00190-1. [DOI] [PubMed] [Google Scholar]
- 78.Clore GM, Schwieters CD. Theoretical and computational advances in biomolecular NMR spectroscopy. Curr Opin Struct Biol. 2002;12:146–153. doi: 10.1016/s0959-440x(02)00302-0. [DOI] [PubMed] [Google Scholar]
- 79.Knight JL, Mekler V, Mukhopadhyay J, Ebright RH, Levy RM. Distance-restrained docking of rifampicin and rifamycin SV to RNA polymerase using systematic FRET measurements: developing benchmarks of model quality and reliability. Biophys J. 2005;88:925–938. doi: 10.1529/biophysj.104.050187. [DOI] [PMC free article] [PubMed] [Google Scholar]
- 80.Yue SY. Distance-constrained molecular docking by simulated annealing. Protein Eng. 1990;4:177–184. doi: 10.1093/protein/4.2.177. [DOI] [PubMed] [Google Scholar]
- 81.Constantine KL. Evaluation of site-directed spin labeling for characterizing protein-ligand complexes using simulated restraints. Biophys J. 2001;81:1275–1284. doi: 10.1016/S0006-3495(01)75785-2. [DOI] [PMC free article] [PubMed] [Google Scholar]
- 82.Van Der Spoel D, Lindahl E, Hess B, Groenhof G, Mark AE, Berendsen HJ. GROMACS: Fast, flexible, and free. J Comput Chem. 2005;26:1701–1718. doi: 10.1002/jcc.20291. [DOI] [PubMed] [Google Scholar]
- 83.Oostenbrink C, Soares TA, van der Vegt NF, van Gunsteren WF. Validation of the 53A6 GROMOS force field. Eur Biophys J. 2005;34:273–284. doi: 10.1007/s00249-004-0448-6. [DOI] [PubMed] [Google Scholar]
- 84.Gunsteren WFv, Billeter SR, Eising AA, Hunenberger PH, Kruger P, Mark AE, Scott WRP, Tironi IG. Biomolecular Simulation: The GROMOS96 Manual and User Guide. Verlag der Fachvereine Hochschulverlag AG an der ETH Zurich; Zurich, Switzerland: 1996. [Google Scholar]
- 85.Darden T, York D, Pedersen L. Particle mesh Ewald: An N-log(N) method for Ewald sums in large systems. J Chem Phys. 1993;98:10089–10092. [Google Scholar]
- 86.von Moltke LL, Greenblatt DJ, Schmider J, Duan SX, Wright CE, Harmatz JS, Shader RI. Midazolam hydroxylation by human liver microsomes in vitro: inhibition by fluoxetine, norfluoxetine, and by azole antifungal agents. J Clin Pharmacol. 1996;36:783–791. doi: 10.1002/j.1552-4604.1996.tb04251.x. [DOI] [PubMed] [Google Scholar]
- 87.Kronbach T, Mathys D, Umeno M, Gonzalez FJ, Meyer UA. Oxidation of midazolam and triazolam by human liver cytochrome P450IIIA4. Mol Pharmacol. 1989;36:89–96. [PubMed] [Google Scholar]
- 88.Khan KK, He YQ, Domanski TL, Halpert JR. Midazolam oxidation by cytochrome P450 3A4 and active-site mutants: an evaluation of multiple binding sites and of the metabolic pathway that leads to enzyme inactivation. Mol Pharmacol. 2002;61:495–506. doi: 10.1124/mol.61.3.495. [DOI] [PubMed] [Google Scholar]
- 89.Cazali N, Tran A, Treluyer JM, Rey E, d’Athis P, Vincent J, Pons G. Inhibitory effect of stiripentol on carbamazepine and saquinavir metabolism in human. Br J Clin Pharmacol. 2003;56:526–536. doi: 10.1046/j.1365-2125.2003.01919.x. [DOI] [PMC free article] [PubMed] [Google Scholar]
- 90.Fishelovitch D, Hazan C, Shaik S, Wolfson HJ, Nussinov R. Structural dynamics of the cooperative binding of organic molecules in the human cytochrome P450 3A4. J Am Chem Soc. 2007;129:1602–1611. doi: 10.1021/ja066007j. [DOI] [PubMed] [Google Scholar]
Associated Data
This section collects any data citations, data availability statements, or supplementary materials included in this article.