Abstract
It is generally thought that callosal connections (CCs) in primary visual cortices serve to unify the visual scenery parted in two at the vertical midline (VM). Here, we present evidence that this applies also to visual features that do not cross yet but might cross the VM in the future. During reversible deactivation of the contralateral visual cortex in cats, we observed that ipsilaterally recorded neurons close to the border between areas 17 and 18 receive selective excitatory callosal input on both ongoing and evoked activity. In detail, neurons responding well to a vertical Gabor patch moving away from the deactivated hemifield decreased prestimulus and stimulus-driven activity much more than those preferring motion toward the cooled hemifield. Further, activity of neurons responding to horizontal lines decreased more than the response to vertical lines. Embedding a single Gabor into a collinear line context selectively stabilized responses, especially when the context was limited to the intact hemifield. These findings indicate that CCs interconnect not only neurons coding for similar orientations but also for similar directions of motion. We conclude that CCs anticipate stimulus features that are potentially relevant for both hemifields (i.e., coherent motion but also collinear shape) because already prestimulus activity and activity to stimuli not crossing the VM revealed feature specificity. Finally, we hypothesize that intrinsic and callosal networks processing different orientations and directions are anisotropic close to the VM facilitating perceptual grouping along likely future motion or (shape) trajectories before the visual stimulus arrives.
Introduction
If trajectory and direction of motion are known beforehand, the detection of a moving object at future positions might be facilitated. Computational models predict action potentials in the motion trajectory before the arrival of the direct geniculocortical input (Shon et al., 2004). Approvingly, in cat primary visual cortex, the response latency for a moving object is shorter than for a stationary one (Jancke et al., 2004). Along a similar line of evidence, BOLD activity has been observed along the trajectory of an apparent motion path without direct visual input to that area (Muckli et al., 2005).
This kind of modulation is likely to be mediated by specific lateral or feedback circuits. It implies that, among neurons with the same orientation preference, those preferring similar directions of motion are preferentially linked. As in the central visual field, objects frequently cross the vertical midline (VM), a similar architecture would be expected for callosal connections (CCs), which link the two visual hemifields in the two hemispheres. In primary visual cortex, CCs are densest in the transition zone (TZ) from area 17 to area 18. This zone includes the VM representation (Innocenti, 1980; Sanides and Albus, 1980; Segraves and Rosenquist, 1982; Payne and Siwek, 1991), and in cats, as in several other mammals, a bilaterally represented band of the central 5–10° of the visual field (Tusa et al., 1978; Payne, 1990).
Physiological studies (Payne, 1994; Makarov et al., 2008; Schmidt et al., 2010; Wunderle et al., 2013) support the midline theory that CCs extend the intrinsic network to the other hemisphere to unify the separated visual environments (e.g., Hubel and Wiesel, 1967). Indeed, intrahemispheric and interhemispheric networks have many morphological features in common. Both long-range intrinsic and callosal axons arborize in a patchy manner (Kisvárday and Eysel, 1992; Houzel et al., 1994) and tend to link collinearly aligned neurons of the same orientation preference (Gilbert and Wiesel, 1989; Kisvárday et al., 1997; Schmidt et al., 1997a; Rochefort et al., 2009).
There is functional evidence from ferrets that excitatory intrinsic circuits exhibit also iso-directional tuning and that inhibitory contacts are made with cells of the opposite direction preference (Roerig and Kao, 1999). In previous interhemispheric deactivation studies, this question has not been explicitly addressed, but asymmetric callosal influences have been reported (Payne et al., 1991).
Subthreshold trans-callosal input caused by a moving object may preactivate neurons in the other hemisphere, which will receive direct geniculocortical input only after the moving object has crossed the visual midline (Houzel et al., 2002). If this holds true, lack of preactivation should cause a different, possibly weaker, response to a moving stimulus in the receiving hemisphere. To address this question, we recorded extracellular multiunit activity in combination with reversible contralateral deactivation. Moving Gabor stimuli were centered on receptive fields (RFs) close to the vertical meridian representation. Parts of the results have been published in abstract form.
Materials and Methods
Preparation and surgical procedures.
Experiments were performed in nine adult cats (8 females and 1 male; Table 1) bred at the Max Planck Institute's colony in accordance with the guidelines of the Society for Neuroscience and the German law for the protection of animals. For ethical and practical reasons (i.e., to increase the experimental output from the nine animals), acute experiments were maintained up to 6 d and compatible subprojects ran interleaved.
Table 1.
Experimental data
| Experiment | Sex | Inside TZ |
Outside TZ Preferred response |
|||
|---|---|---|---|---|---|---|
| Preferred response |
Nonpreferred response: NPN | |||||
| VN | HN | VN | HN | |||
| N (all units) | 179 | 94 | 240 | 22 | 47 | |
| C16 | M | 36 | 0 | 16 | 0 | 0 |
| C17 | F | 10 | 18 | 55 | 11 | 5 |
| C18 | F | 40 | 11 | 60 | 7 | 39 |
| C19 | F | 0 | 5 | 2 | 0 | 2 |
| C20 | F | 2 | 0 | 20 | 0 | 1 |
| C21 | F | 19 | 11 | 25 | 4 | 0 |
| C22 | F | 45 | 23 | 31 | 0 | 0 |
| C23 | F | 7 | 8 | 18 | 0 | 0 |
| C25 | F | 20 | 18 | 13 | 0 | 0 |
Surgical procedures, anesthesia, and life support were described in detail previously (Wunderle et al., 2012). General anesthesia was introduced intramuscularly with 10 mg/kg ketamine hydrochloride (Ketamin; CP-Pharma) and 1 mg/kg xylazine hydrochloride (Rompun; Bayer) supplemented with 0.1 mg/kg atropine sulfate (Atropin; B.Braun) and maintained after tracheotomy by artificial ventilation with a mixture of 0.6%/1.1% halothane (for recording/surgery, respectively) and N2O/O2 (70%/30%). Briefly, we performed two rectangular craniotomies of ∼8 × 6 mm2, which were centered on Horsley-Clarke coordinates anteroposterior 0 to −2, mediolateral +2 symmetrically on both hemispheres, leaving the bone above the superior sagittal sinus intact.
On the left hemisphere, the area 17/18 border was determined by optical imaging of intrinsic signals after implantation of a titanium recording chamber (Bonhoeffer et al., 1995; Wunderle et al., 2013). On the right hemisphere, a surface cryoloop (Lomber et al., 1999) equipped with a temperature sensor was positioned above the 17/18 border (Fig. 1). We implanted the right hemisphere in all animals with the same probe (5 × 3 mm2, deactivating an 8 × 6 mm2 area) for the practical reason of comparability between animals. The probe was covered with clear agar (Agarose type XI, Sigma) and regularly rinsed with saline. At the end of the experiment, animals received a lethal dose of pentobarbital sodium (Narcoren).
Figure 1.
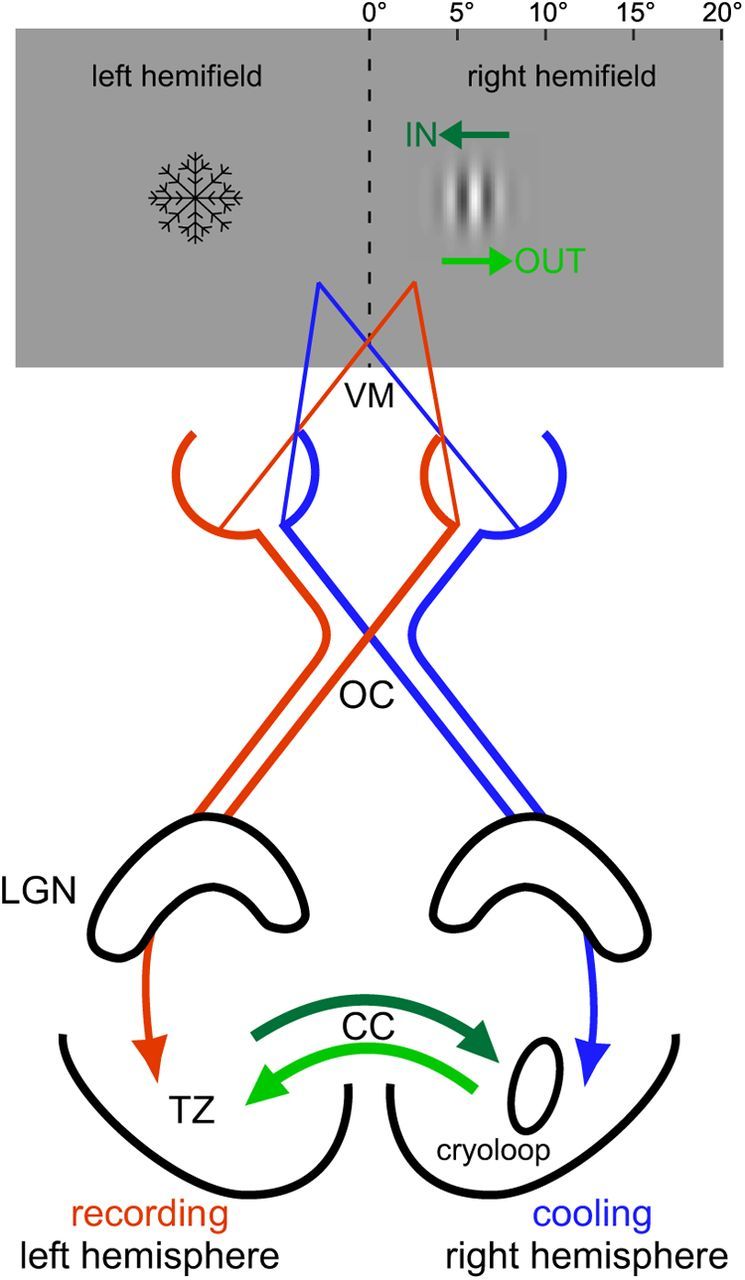
Cooling the right visual cortex deactivates the left visual hemifield. Stimulus presentation and the visual pathways representing the binocular visual field. Gabor stimuli (5°) were presented next to the vertical meridian (VM) in the right hemifield centered between 2.5° and 9°. Red represents signal flow from the right visual hemifield to the left hemisphere; blue represents signal flow from the left hemifield to the right hemisphere. Axons form nasal retina halves cross at the optic chiasm (OC), whereas temporal retina halves continue ipsilaterally. CCs are particularly dense at the TZ representing the VM. We thermally deactivated an 8 × 6 mm2 area, including the TZ of the right hemisphere. Thus, visual input from the left visual hemifield coming from that hemisphere was removed. IN/OUT, Direction of stimulus movement toward/away from the functionally deactivated hemifield; LGN, lateral geniculate nucleus. The snowflake indicates the “deactivated” visual hemifield.
For recording, the pupils were dilated by topical application of atropine sulfate (1%, Atropine-POS, Ursapharm) and diluted phenylephrine (5% Neosynephrin, Ursapharm). Refraction was optimized for a 57 cm viewing distance using black contact lenses with a 3 mm artificial pupil. Eyes were aligned with a prism. Alignment and refraction were repeatedly checked.
Electrophysiological recording.
After imaging, the silicon oil was removed and up to 3 Tungsten microelectrode arrays (4 × 4, spacing 250 or 400 μm; 1 mΩ, Microprobes) were implanted for extracellular electrophysiological recordings into the 17/18 TZ as well as central parts of area 18. To maximize the efficiency of our preparation and to increase the number of vertically and horizontally tuned neurons in the overall sample, we targeted the matrix positions according to the intrinsic signal maps. A list of multiunits included in the analysis and their distribution across the experiments is found in Table 1. Gabor positions had to be tailored to the RFs encountered so that the number of parallel units per experiment, per deactivation and per electrode matrix was naturally limited.
After having lowered the electrodes by ∼800 μm into the cortex, the craniotomy was covered with agar and bone wax. After ∼6 h stabilization time, we started to record extracellular multiunit activity and local field potentials using Plexon amplifiers (Plexon). For multiunit activity, signals were amplified 1000-fold, high pass filtered (0.7–6 kHz), thresholded manually ∼4 SDs well above noise level, digitized with M-series acquisition boards (National Instruments), and stored by a custom-made program (SPASS by Sergio Neuenschwander, in LabView, National Instruments).
Recordings were executed before, during, and after thermal deactivation (baseline-cooling-recovery). Recording during cooling started after the cryoloop had reached a stable temperature of 2 ± 15°C for 5 min. Before recording of the recovery period, a rewarming phase of 20 min was allowed ensuring full recovery of the right hemisphere to baseline temperature and activity level. Units were tested in several cooling cycles with different stimuli and repeated automated mappings of the RFs confirmed their stability over several protocols. Then, electrodes were moved down and another recording session started after new units had stabilized.
Visual stimulation.
Stimuli were presented on a 21 inch monitor positioned to cover the central 20° in each visual hemifield in the horizontal and 30° in the vertical.
We determined beforehand RF position, extent and orientation preference of all recorded units by presenting whole-field bars moving in 16 different directions (22.5° steps) with a width of 1° and a speed of 20 degrees/s for 2000 ms as in Botelho et al. (2012). To limit the number of variables, units of cardinal orientation preference were preselected as they have been shown to be stronger influenced by callosal input than obliques with whole-field grating stimuli (Schmidt et al., 2011).
Subsequently, Gabor patches (sine-wave gratings convolved by a 2D-Gaussian) (Field et al., 1993) of either vertical or horizontal orientation were centered onto the classical (minimal response) RFs (Fig. 1). Patches had a size of 5° to include several close by RFs with slightly offset centers to increase the sample size per cooling cycle. The grating within a Gabor had a spatial frequency of 0.5 cycles/deg and moved with a velocity of 4°/s either to the left and right (vertical orientation) or upward and downward (horizontal orientation). It is important to note that the motion wave generated by the Gabor stayed within the confines of the Gabor patch. Patches were presented in isolation or in lines when surrounded by two collinearly aligned flankers on an iso-luminant background. For lines, the center-to-center distance between Gabors was 2.5 λ units (defined as the reciprocal of the spatial frequency of the center Gabor, 5°). As a control, the flankers were presented also in isolation. Single Gabors and vertical lines did not cross the VM. For horizontal lines, the most medial Gabor could flank or cross the VM depending on the position of the center Gabor (<5°).
Activity was recorded for 1500 ms. An iso-luminant screen was presented for 500 ms followed by 1000 ms of visual stimulation. One recording session consisted of 10 different stimuli, which were presented 20 times to the left, right, or both eyes (30 conditions) in a randomized manner using a computer-controlled eye-shutter and with an interstimulus interval of 2000 ms. Data in this study are from binocular recordings with aligned eyes.
Data analysis.
We used an automatic off-line spike-sorting algorithm (Shoham et al., 2003) written in MATLAB (MathWorks). Analysis was performed trial by trial for a prestimulus interval of 500 ms and a stimulated interval of 1000 ms.
Single units had to fulfill the following inclusion criteria: First, they had to have significantly higher spiking activity to the stimulus than during prestimulus time (Wilcoxon rank sum test, p < 0.05). Second, they had to have a clear orientation preference as quantified by an orientation index (OI) > 0.2. The latter was defined as 1 minus the circular variance of the orientation tuning (Swindale, 1998). According to this index, a totally unselective neuron has an OI of 0, whereas a neuron that responds only to a single orientation has an OI of 1. Third, the neurons' preferred orientation, which was calculated using a Gaussian fit from the mappings (as in Wunderle et al., 2013), could only deviate ±30° from cardinal orientations. Fourth, single units had to be excitable by both eyes. Fifth, no significant stimulation by the flanker alone condition was observed. Sixth, units were classified to belong to the TZ (n = 273) according to intrinsic signal imaging before electrode implantation (e.g., see Wunderle et al., 2013, their supplemental Fig. 3). For an extended analysis of eccentricity (see Fig. 5A,B), more units outside the TZ were included (n = 69).
Figure 5.
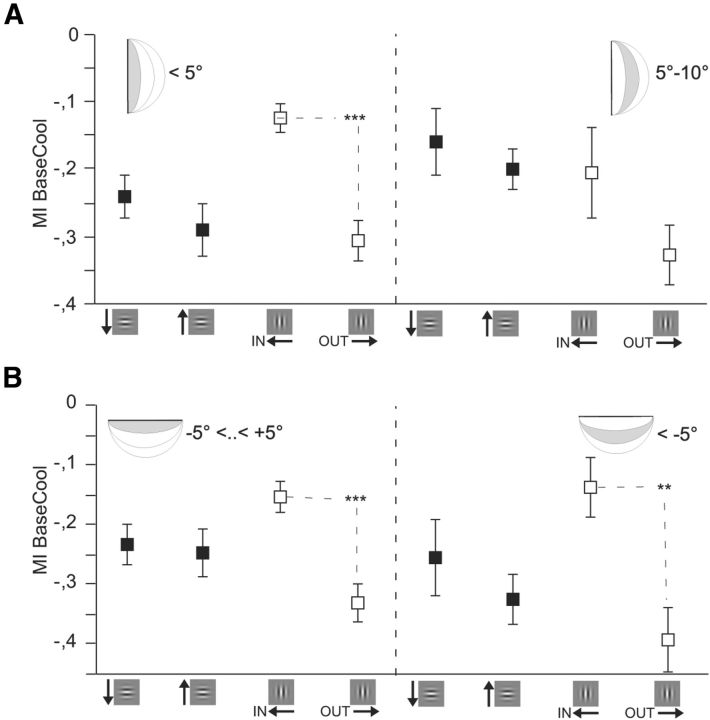
CCs remain direction-selective outside the bilateral representation zone (±5°). Preferred responses separated by azimuth (A) and elevation (B). Conventions as in Figure 4. A, MIs separated for units with RFs close by the VM (<5°) and farther away (≥5–10°) or (B) for units close by (−5° < 5°) and farther away (≤−5°) from the HM (n = 342). Error bars and significance levels as in Figure 2.
For the analysis of nonpreferred responses, units of other orientation preference than cardinal (see Fig. 6, n = 240) were added to the dataset when they responded significantly to either horizontal or vertical Gabor stimuli and showed an OI of >0.2 and a direction preference index (DI, for details of its calculation see Wunderle et al., 2013) of >0.2.
Figure 6.
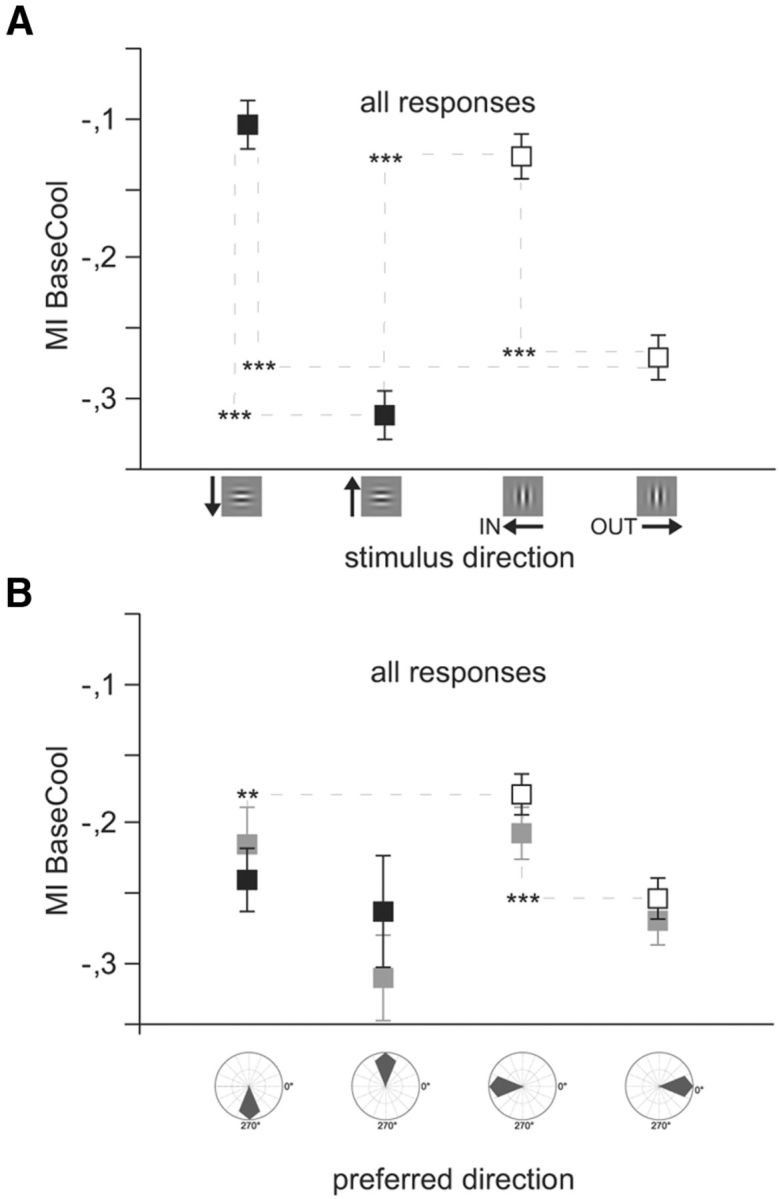
Both projecting and receiving structures exhibit selectivity. Nonpreferred responses: Average modulation indices for all significant responses (n = 902) to the four Gabor patches, including HN and VN and neurons not preferring cardinal directions (NPN). Conventions as in Figure 4. The influence of stimulus direction (A) and the cell's individual direction preference (B) on modulation indices during cooling are compared. A, MIs during visual stimulation with isolated Gabor patches moving in different directions. Responses are grouped according to the stimulus direction. B, Responses are grouped according to the quadrant of the unit's preference direction (right, 316–45°; upward, 46–135°; left, 136–225°; downward, 226–315°). Light gray squares represent prestimulus activity. Both input (visual stimulus) and the receiving neurons' preference matter. Error bars and significance levels as in Figure 2.
For analysis of the spike rate changes, we calculated a modulation index (MI) between cooling and baseline as follows:
 |
Resulting values <0 refer to a lower spike rate compared with baseline, and values >0 indicate higher activity as in the baseline. We also computed the percentage change between baseline and cooling condition for each neuron.
Results
After offline spike sorting and applying the inclusion criteria (see Materials and Methods), 273 binocular units of either vertical (N = 179) or horizontal (N = 94) orientation preferences (±30°) recorded from the TZ in the left hemisphere of 9 cats entered the analysis. We compared mean firing rates during baseline recordings with those obtained during thermal deactivation of the right hemisphere. Previously, we had observed that deactivation of the contralateral TZ mainly scales tuning curves multiplicatively (Wunderle et al., 2013). This implies that the biggest changes are to be expected with stimuli of each neuron's preferred orientation on which we thus focused the analysis in a first step.
Ongoing responses and responses to single Gabor stimuli reveal strong interhemispheric input
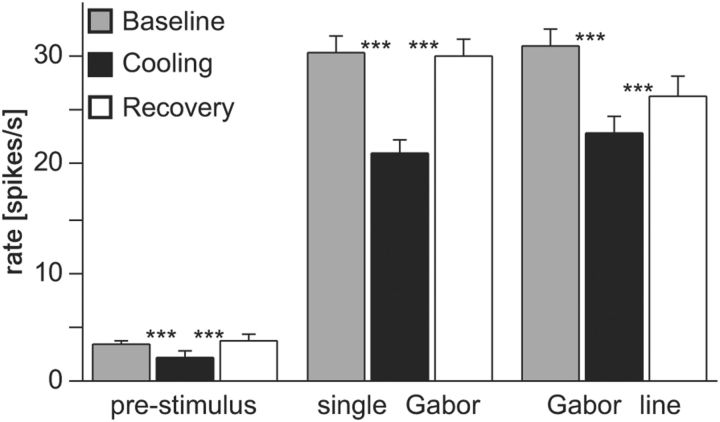
During deactivation of the contralateral hemisphere, both prestimulus and stimulus-driven spike rates got on average reduced. For prestimulus activity, removal of interhemispheric influence led to a mean loss of 35% baseline spiking activity. For tailored stimulation with a single Gabor patch in the nondeactivated hemifield, we observed a mean decrease of 31% of baseline firing for the best responses of units preferring cardinal contours (Fig. 2). This is much more than what has been observed previously with full-field gratings covering the two hemifields (14%) and closer to the rate drop observed with random dot textures (42%, Wunderle et al., 2013). As with random dots, a strong feedforward drive of the units' surrounding local network is missing in case of spontaneous activity and tailored Gabor stimulation. Along this line, when embedding the single-center Gabor in the context of a collinear line by adding two equidistant flankers, average rates dropped to a lesser extent in the absence of long-range callosal input (26%, Fig. 2). Accordingly, the average modulation indices between baseline and cooling period (MIBaseCool) resulted in −0.271 for spontaneous spiking, −0.236 for single Gabor, and −0.19 for line stimulation. Both baseline and recovery rates differed significantly from the rates recorded during the cooling period in the 3 cases (p < 0.001, n = 273, Wilcoxon signed rank). This indicates that the observed changes were reversible and clearly related to deactivation of neuronal activity at the sending TZ of the right hemisphere.
Figure 2.
Spontaneous and stimulus-driven firing rates decrease during CC deactivation. Averaged rates decrease significantly during cooling deactivation of the right visual cortex and recover back to baseline levels after a rewarming period. Prestimulus spiking activity (left graph), preferred responses to isolated Gabor patches of horizontal and vertical orientation (middle graph), and line stimuli of horizontal and vertical orientation (right graph) in the TZ of the left primary visual cortex. Bars indicate SEM. Asterisks here and in the following figures indicate significance levels, **p < 0.001, ***p < 0.0001.
Callosal action reveals direction selectivity: preferred responses
Interestingly, the amount of rate decreases for the best response to an optimally oriented Gabor patch differed with respect to orientation and direction preference of the recorded units.
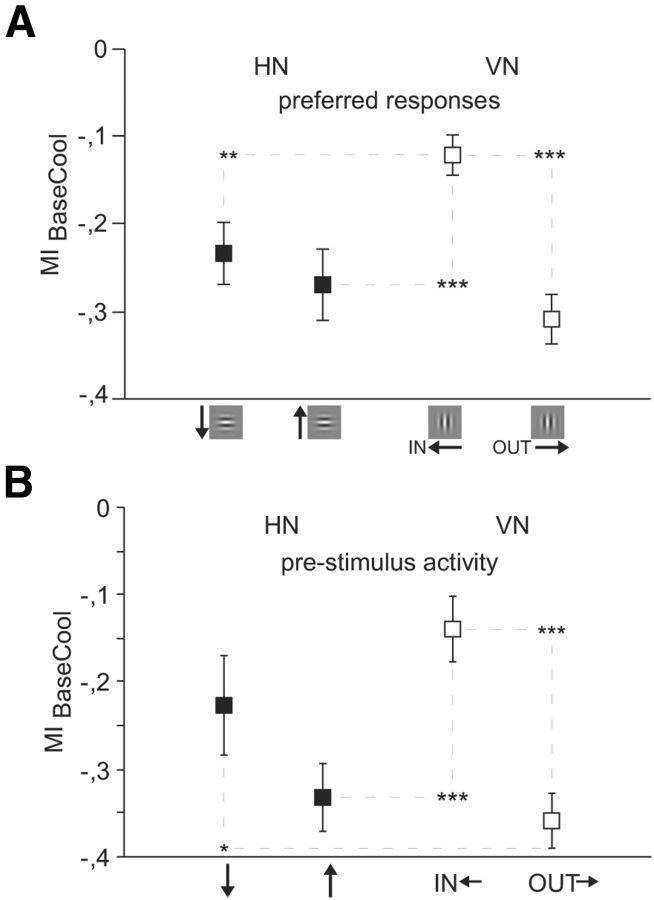
As illustrated by the example in Figure 3A, neurons preferring horizontal orientations (HNs) were profoundly affected by removal of interhemispheric input, for both directions of vertical upward and downward motion. The average modulation indices were MIBaseCoolUp = −0.269 for upward moving stimuli and MIBaseCoolDown = −0.232 for downward moving stimuli but not significantly different from each other (p = 0.59, NUP = 59, NDOWN = 35, Mann–Whitney U). In contrast, neurons preferring vertical contours (VNs) revealed a larger and significant difference between the two directions of motion. Peristimulus time histograms (PSTH) of example units in Figure 3B–D demonstrate this anisotropy. When the vertical grating within the Gabor patch moved into the affected/deactivated hemifield (IN), the cooling-induced decrease of neuronal activity was less severe (left PSTHs) than for the movement out of the deactivated hemifield (OUT, right PSTHs). This occurred independently of whether that neuron had a preference for the IN or the OUT direction (compare Fig. 3B with Fig. 3C,D). In agreement, the modulation index for the IN direction (MIBaseCoolIn = −0.124) was on average significantly smaller than for the OUT direction (MIBaseCoolOut = −0.310, p < 0.0001; NIN = 81, NOUT = 98, Mann–Whitney U) (Fig. 4A).
Figure 3.
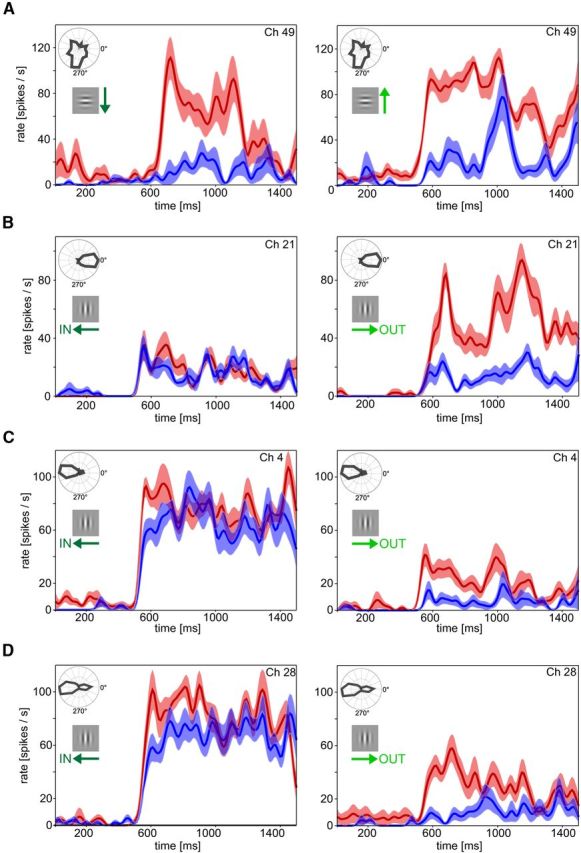
Responses to OUT movement decrease stronger than those to IN movement. Peristimulus time histograms (n = 20 trials) of four example single units preferring horizontal (HN) or vertical contours (VN) recorded during baseline (red) and cooling (blue). The neuron's RF was stimulated binocularly with a Gabor patch moving in different directions. The parent multiunit's tuning curve as obtained by bar mappings is indicated in the upper left corner; the stimulus direction in the sketch on the left. Lighter transparent coloring around the mean (darker line) represents ±1 SEM. A, The spike rate of HN decreases during thermal deactivation independent of the direction of motion. B–D, During cooling, VN lose spikes dependent on the stimulus direction but independent on their preferred direction of motion. Spike rate decrease is always greater when the stimulus moves to the right, away (OUT) from the deactivated visual hemifield. y-axes are scaled similarly. Absolute firing rates between tuning plots (bars) and PSTH (Gabors) can vary because of the different stimuli used.
Figure 4.
Shape and movement across the vertical midline are anticipated. Preferred responses. A, B, Average modulation indices for units within the TZ (n = 273). Negative values indicate higher activity during baseline than during cooling. Black squares represent HN; open squares represent VN. A, MIs during visual stimulation with isolated Gabor patches moving in different directions. B, MIs during the 500 ms prestimulus interval of the same units as in A. HN preferring horizontal contours and VN preferring horizontal OUT movement lower their stimulus-driven and prestimulus activity much more than VN preferring IN movement when deactivating the contralateral hemisphere. Error bars and significance levels as in Figure 2.
The rate decrease for both directions of vertical movement of horizontal contours was not significantly different from the OUT direction for vertical contours (OUT-downward, p = 0.12 and OUT-upward, p = 0.26; NOUT = 98, NDOWN = 35, NUP = 59, Mann–Whitney U) but different from the IN direction (IN-downward, p = 0.0018 and IN-upward, p = 0.0008; NIN = 81, NDOWN = 35, NUP = 59, Mann–Whitney U).
Thus, when not separating for the direction of movement, HN (see also Fig. 7A, MI = −0.255) appeared to be slightly more affected by callosal input than VN (MI = −0.226).
Figure 7.
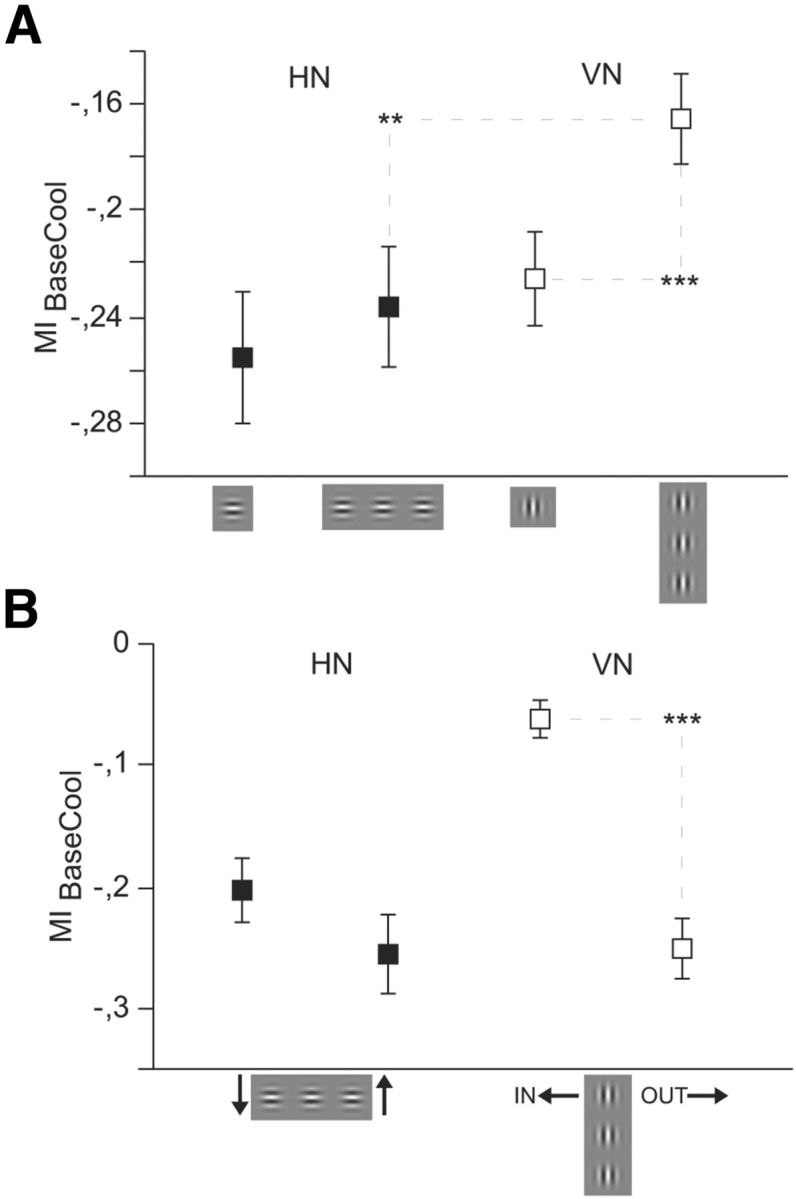
A collinear context significantly stabilizes responses of VN in the absence of CCs. Average modulation indices for units within the TZ (n = 273) when stimulated by three Gabor elements arranged to form a collinear line. Conventions as in Figure 4. A, Results obtained with single Gabor stimulation from Figure 4A compared with line stimulation. Directions of motion not separated. During cooling, in particular VN, get stabilized by the collinear context. HN responses to lines reveal a larger callosal input than VN responses. B, MIs during visual stimulation with lines, directions of motion separated. Error bars and significance levels as in Figure 2.
Noteworthy, average DIs did not change overtly in the above experiments (0.03 ± 0.2) when stimulating with moving bars of 16 different orientations. Changes in direction selectivity indices observed during cooling were rather small as opposed to the overall DIs with a few exceptions and not significant. The same result has been obtained with gratings previously (Wunderle et al., 2013) and is compatible with a mainly multiplicative action delivered by the callosal input (for review, see Schmidt, 2013).
Callosal input reveals direction selectivity: prestimulus activity
The above findings could be observed when stimulating with isolated Gabor patches, which were tailored to cover the RFs of the receiving neurons and did not even touch the VM. This indicates that deactivating mere ongoing and not stimulus-driven activity of the projecting neurons in the deactivated hemisphere exerted orientation- and direction-specific impact via CCs. In addition to the input site, we now examined the output site in more detail. We observed that also the prestimulus activity of the receiving neurons in the recorded hemisphere was affected in a specific manner during the interstimulus interval (Fig. 4B).
Very similar to the later evoked, also the prestimulus activity levels of VN preferring the OUT direction of motion (MIBaseCoolOut = −0.359) were significantly more reduced during deactivation of the contralateral hemisphere than those of VN preferring the IN direction (MIBaseCoolIn = −0.139, p < 0.0001, NIN = 81, NOUT = 98, Mann–Whitney U; Fig. 4B). Further, prestimulus activity of HN (MI = −0.293) decreased more, but not significantly, during callosal deactivation than prestimulus activity of VN (MI = −0.259). The observed differences in the prestimulus activity are compatible with the idea of reverberations of previous stimuli or spontaneous activity waves along CCs between neurons preferring similar stimulus features when a visual stimulus is absent.
Callosal input close and farther away from the midlines
There is evidence that in cats the vertical midline is represented bilaterally as far as the azimuth of 5° (Payne, 1990). Thus, stimulus-driven activity evoked by a single Gabor patch presented in that region would reach both cortices via direct thalamocortical input and additional callosal input. We could thus expect that neurons within the bilaterally represented stripe of the TZ demonstrate a larger difference between the directions of IN and OUT movement when deactivating one of the two hemifields. Therefore, we tested the influence of the distance of the center Gabor patch to the VM (azimuth) on the MIs. To this end, we included also recordings outside the callosally connected TZ (Table 1) and separated RFs according to azimuth into two groups (Fig. 5A, center of Gabor at <5° and center of Gabor ≥5°). However, this did not lead to a different result compared with the inside TZ analysis, as illustrated in Figure 4A. The same trend of an MI difference between IN and OUT remained for neurons farther away than 4° but was not significant possibly because of the limited number of neurons (for distribution of neurons, see Table 1). This might emphasize once more that a stimulus in the deactivated hemifield is not needed to reveal the direction selectivity of CCs. Also, for MIs with line stimulation, it did not matter whether horizontal lines truly crossed the VM or not (data not shown). It should be noted, though, that most of our recordings were relatively close to the VM (≤10°). Thus, the fact that we observed similar MI differences in the two zones, bilaterally represented zone (<5°) and the remaining zone, which most likely also receives CCs, still goes along with the interpretation of a continuous network perpetuating the intrinsic circuit within one hemisphere. It cannot be excluded that the MIs in the far periphery would be smaller.
Further, the callosally interconnected zone becomes broader at elevations higher than ±5° (Payne, 1994). Accordingly, when separating neurons according to their RFs' elevation, we observed that averaged differences in the MI differences between IN and OUT and also UP and DOWN directions persist and become even slightly larger in the farther away group (lower field 5–10°; Fig. 5B).
Callosal action reveals direction selectivity: nonpreferred responses
So far, only best responses to the neurons' preferred stimulus and thus neurons preferring cardinal contours were considered in the statistical analyses. However, as depicted in Figure 3C, D, also nonpreferred responses decreased profoundly when the OUT direction was stimulated, indicating selectivity of the callosal network both in the receiving as well as in the projecting structures. To quantify the selectivity of the input, we thus extended the analysis to all recorded significant responses (n = 902) of direction-selective neurons (DI > 0.2) to either the vertical or horizontal Gabor patch. We categorized all units according to the quadrant (right, 316- 45°; upward, 46–135°; left, 136–225°; downward, 226–315°) of their intrinsic direction preference. It turned out that both the direction of movement of the stimulus (i.e., the activation of the projecting neurons) (Fig. 6A) as well as the neuronal property of directional preference (Fig. 6B) of the receiving neuron had a selective impact on the response change observed during cooling deactivation of callosal input. The latter is also emphasized by the direction specificity of MIs in the prestimulus activity (Fig. 6B, gray squares). Thereby, the stimulus direction (IN, OUT, UP, DOWN) seemed to be more influential (p < 0.0001; n = 4 directions, ANOVA) than the cell's intrinsic preference for the direction quadrant (p = 0.045; n = 4 quadrants ANOVA). The interaction between the two factors was also significant (p = 0.014, ANOVA) emphasizing that a cell preferring the OUT direction and stimulated with a Gabor movement OUT of the deactivated hemifield would show a strongly negative MI during cooling. The result supports the assumption that CCs predominantly but not exclusively interconnect neurons of similar direction preference and emphasizes the multiplicative nature of their action.
Interestingly, the analysis of the nonpreferred responses revealed that a big number of neurons decreased their rates not only when stimulated in their preferred OUT direction but also when stimulated in the UP direction (Fig. 6B). This result might be compatible with the interpretation that the integration of horizontal orientations and especially movements directed toward the horizontal meridian is facilitated by interhemispheric connectivity.
A collinear context stabilizes responses evoked by vertical contours
It is known that in cats both intrahemispheric and interhemispheric connections extend anisotropically and preferentially link neurons with collinearly aligned RFs (Schmidt et al., 1997b; Rochefort et al., 2009). To examine the interaction between the long-range connectivity within one hemisphere and connections between the two hemispheres, we flanked the single-centered Gabor patches by two collinearly aligned patches of iso-orientation, forming either a vertical line running parallel to the VM or a horizontal line orthogonal to it. Importantly, the flankers did not stimulate the center RF when presented alone.
Interestingly, VN being stimulated with the line (average across directions, MIBaseCool = −0.166, Fig. 7A, open squares) revealed a significantly smaller rate decrease compared with single Gabor stimulation (MIBaseCool = −0.226, p < 0.0001; NVN = 179, Wilcoxon signed rank). Rate decreases for HN did not show such a difference (p = 0.1, NHN = 94, Wilcoxon signed rank, Fig. 7A, filled squares). This indicates that VN close to the VM and stimulated by a collinear line of vertical contours get additionally stabilized by the intrahemispheric network. The latter namely explicitly links neurons with vertical RFs arranged in parallel to the visual field's midline. In contrast, the comparable network for neurons preferring collinear horizontal contours (HN) by nature gets interrupted at the midline. In line with this argumentation is also the following observation. When not separating for the direction of movement, HN stimulated by the line context suffered significantly more from the absence of CC (MIBaseCool = −0.236) than VN (Fig. 7A, MIBaseCool = −0.166 for Gabor line, p < 0.0043; NHN = 94, NVN = 179, Mann–Whitney U). This is in agreement with the notion that the horizontal line crossed the vertical meridian in the majority of cases, whereas the vertical line ran parallel to it in the stimulated noncooled hemifield.
As with single Gabor stimulation, VNs responding to a line of three collinearly aligned Gabor elements were significantly less affected when the movement was in the IN direction (MIBaseCoolIn = −0.063) as opposed to the OUT direction (MIBaseCoolOut = −0.251, p < 0.0001, NIN = 81, NOUT = 98, Mann–Whitney U) (Fig. 7B). Also, we could not observe any activity difference between upward (MIBaseCoolUp = −0.256) and downward movement (MIBaseCoolDown = −0.203, p = 0.283, NUP = 59, NDOWN = 35, Mann–Whitney U) for contextual stimulation of HN.
The selective anticipatory drive across the vertical midline is mainly excitatory
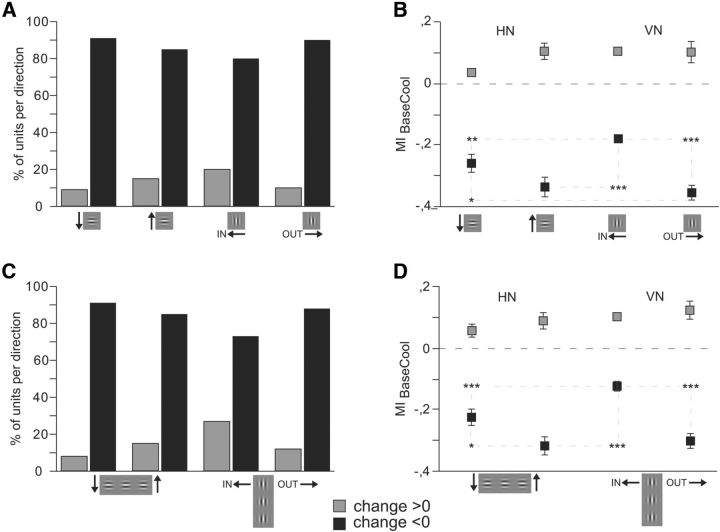
The main action of visual interhemispheric input is of excitatory nature (Schmidt, 2013). However, as in previous deactivation studies using bars or gratings (Payne et al., 1991; Schmidt et al., 2010; Wunderle et al., 2013), we also counted increases of the MI. For long-range intrinsic connections, inhibitory actions have been described to be of opposite directionality as excitatory ones (Roerig and Kao, 1999). Therefore, we separated MI increases and decreases for the four directions of motion (Fig. 8). It turned out that decreases (i.e., reflecting excitatory callosal action) were both more frequent (Fig. 8A) and stronger (Fig. 8B) for all directions of motion. Increases (i.e., reflecting inhibitory callosal action) did not separate between the two directions of VM crossing motion for VN (p = 0.57, NVN-IN-Increase = 16, NVN-OUT-Increase = 10, Mann–Whitney U). A similar result was observed with contextual stimulation (p = 0.13, NVN-IN-Increase = 16, NVN-OUT-Increase = 10, Mann–Whitney) (Fig. 8C,D).
Figure 8.
Selective callosal input is mainly excitatory. Firing rate changes to a single Gabor patch (A, B) and to collinear lines of three Gabor elements (C,D) separated by increases (MI > 0, light gray) indicating inhibitory callosal action and decreases (MI < 0, dark gray), indicating excitatory callosal action for the four different stimulus directions. A, C, Number of increases and decreases for preferred directions of movement. Decreases are much more frequent for all stimulus directions. B, D, Modulation indices comparing spiking activity during baseline and cooling. Increases do not reveal selectivity for direction of motion (B, D). Error bars and significance levels as in Figure 2.
This supports the hypothesis that significant inhibitory actions via CCs only come into action when the network is driven by a strong feed forward drive (e.g., high-contrast whole-field gratings) (Wunderle et al., 2013).
In total, MI increases were less frequent for HN (4.4%) than for VN (9.5%, Fig. 8B,D), confirming previous observations in ferrets (Schmidt et al., 2010).
Discussion
In the absence of callosal input, spiking responses to Gabor patches centered on RFs close to the vertical meridian largely decrease. Thereby, both preferred and nonpreferred responses to one motion direction get selectively impaired (i.e., the one pointing OUT of the deactivated hemifield), although the stimulus does not even reach into that hemifield. The same holds for ongoing activity of neurons, which prefer exactly that motion quadrant and drop spikes under visual stimulation without CCs. Embedding isolated Gabors into a collinear context confirms this result but indicates that, without CCs, the intrahemispheric network close to the area 17/18 border stabilizes in particular responses to vertical lines and less those to horizontal lines.
CCs are selective for the direction of movement
Neuronal responses to a movement away from the deactivated hemifield (OUT) were more sensitive to the removal of callosal input than responses to the counter-movement. This speaks in favor of an excitatory input enhancing responses “ahead” of likely trajectories in the intact circuit and contributing to the computation of motion directions. This excitatory drive is probably produced within the circuitry of the deactivated hemisphere. Accordingly, neurons activated with a direction of movement toward (IN) the deactivated hemifield decreased their activity only slightly (i.e., they got their main drive via the direct pathway and the circuitry processing the intact hemifield “behind” the movement).
Our result indicates selective reciprocal connections between moderately iso direction-selective neurons preferring horizontal motion directions (Fig. 9) and along them transmission of visual input in the direction of the motion trajectory across the midline (Houzel et al., 2002). This selectivity goes along with a smaller number of connections to neurons of different or opposite directional preference (i.e., neurons that respond significantly to the particular OUT stimulus but prefer other directions of motion reveal rate decreases; negative MIs). These are detected by our cooling protocol because it interrupts selectively connections contributing to the computation of one direction across the VM but not of the other.
Figure 9.
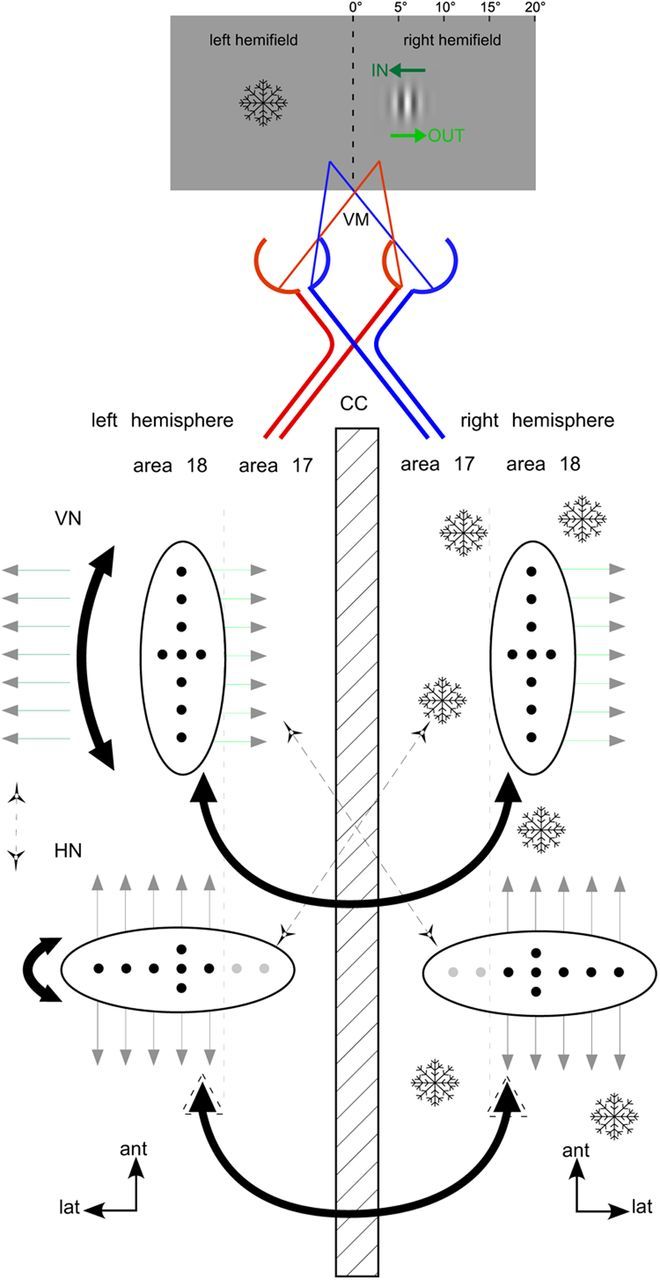
Intrahemispheric and interhemispheric circuits are anisotropic. Anisotropy of long-range intrahemispheric and interhemispheric connections (black lines) linking neurons (black dots) with collinearly aligned RFs close to the cortical representation of the VM. The circuit of intrahemispherically linked neurons preferring horizontal contours (HN) forms an ellipse that is interrupted at the 17/18 border to be continued into the other hemisphere by CCs (black). That is why CC impact on HN appears larger (indicated by a dotted arrow) when not separating motion directions and also with larger stimuli (Fig. 7B). The circuit among neurons preferring vertical contours (VN) stretches parallel to the border (Schmidt et al., 1997b). That is why responses of VN, especially to the IN direction of movement (little dark green arrows to the left), can get stabilized when CCs are deactivated (snowflakes). All connections are reciprocal and link also neurons of non–iso-preference weakly (dotted black diagonals). Lat, lateral; ant, anterior. Other conventions as in Figure 1.
Probably, direction selectivity is a feature of long-range intrinsic connections (Roerig and Kao, 1999), although never demonstrated anatomically. We did not observe any drop of CC selectivity when leaving the bilaterally represented strip around the VM. Our finding thus supports the hypothesis that CCs smoothly extend the intrinsic network.
If the key feature transferred via visual CCs would be “direction of motion,” one would expect responses to horizontally oriented Gabors to be not more affected than to vertical Gabors moving in the IN direction. Instead, they suffer to the same extent as responses to contours moving in the OUT direction. This suggests that also an object's shape has to be integrated. A horizontal line potentially continues over the midline and thus requires strong interhemispheric communication, independent of its direction of motion. Similarly, maps evoked by both horizontal and vertical contours deteriorated without callosal input in ferrets (Schmidt et al., 2011). Here, the vertical deteriorated more than the horizontal orientation domains, but directions had not been separated for obtaining intrinsic signals. Instead, the stimulus moved back and forth within the same trial. Larger deterioration of vertical orientation domains might thus be explained now by different activation of the two direction subdomains during deactivation.
That CCs promote the integration of collinear lines crossing the VM has been described previously (Payne, 1994; Kiper et al., 1999; Knyazeva et al., 1999; Carmeli et al., 2007; Makarov et al., 2008; Schmidt et al., 2011). Noteworthy, the present study indicates that the stimulus does not even have to exceed RF borders to unveil orientation and direction-specific callosal influences.
Lateral networks close to the VM differ for neurons preferring horizontal and vertical contours
When not separating directions, callosal impact on responses to horizontal lines, as expressed by large negative MIs, was bigger than to verticals. Likewise, neurons preferring horizontal contours decreased spikes more than neurons preferring vertical contours. This might be explained by a different topography of intracortical circuits for HN or VN close to the areal border.
Long-range intrinsic connections dominantly link neurons of similar orientation preference aligning along an axis formed by the cortical representation of that orientation (Bosking et al., 1997; Schmidt et al., 1997b). Thus, interconnected neurons preferring vertical contours form ellipses stretching parallel to the 17/18 border. In contrast, circuits processing horizontal contours extend farther in the direction pointing orthogonal to the areal border. Therefore, they get interrupted at the VM representation to be continued in the contralateral hemisphere (Fig. 9). Confirming this notion, a collinear anisotropy was also described for visual CC (Rochefort et al., 2009).
In cat area 18, and also area 17 to a lesser extent, this anisotropy goes along with an anisotropic magnification factor expressing that more cortical tissue is devoted to the vertical axis of the visual field than to the horizontal one (e.g., Cynader et al., 1987). Moreover, the horizontal axis is parted in two by the vertical meridian. Thus, by nature of this intrahemispheric horizontal–vertical anisotropy, horizontal contours should benefit stronger from interhemispheric integration than vertical ones.
To examine whether the collinear intrahemispheric network indeed stabilizes responses to vertical over horizontal contours during cooling, we flanked the single Gabor by collinear Gabors to form a line. In agreement with the previous assumption, responses to collinear vertical lines turned out to be significantly less vulnerable to cooling than those to a single vertical Gabor (Fig. 6). As expected, a difference between single Gabors and lines was not observed for HN, only for longer lines (e.g., five elements) clearly crossing into the deactivated hemifield (A. Schmidt, T. Wunderle, D. Eriksson, K. Schmidt, unpublished observation).
CCs mediate anticipation of stimuli that might cross the visual field's midline in the future
It makes sense that neurons coding for a moving stimulus, which might cross the VM in the near future, prepare receiving neurons even if the stimulus finally will not cross. Anticipation might take place in the direction of movement, preactivating neurons before the actual sensory input emerges, but also along the horizontal projection of an object. Accordingly, Harvey et al. (2009) presented evidence that a predepolarizing activity in cortical layers 1–3 precedes the actual stimulus before firing onset.
Earlier, Rao and Ballard (1999) suggested that feedback prepares the primary visual cortex for highly probable visual input. Later, it was proposed that direction-selective cells would express anticipatory activity through spike-timing-dependent plasticity driven recurrent and feedback connections (Shon et al., 2004). Eagleman and Sejnowski (2007) concluded that, as V1 gives precise information of an object's location, it receives feedback from higher areas to establish motion perception.
In our experiment, we reversibly remove also indirect pathways through contralateral V1. Therefore, our result could be a reflection of feedback acting on the contralateral hemisphere via CCs. In agreement, Houzel et al. (2002) proposed that faster interhemispheric processing could be achieved by subthreshold heterotopic callosal input connected with inhibitory and top-down components.
In cat primary visual cortex, a moving object induces neuronal activity much earlier than a stationary object (Jancke et al., 2004). The authors hypothesized subthreshold activation in the motion trajectory to be mediated by long-range horizontal connections. Our finding supports this notion as CCs between the two area 17/18 TZs operate on the same hierarchical processing level and can be seen as a special form of long-range lateral connections.
A midline rule update
So far intuitive, our findings remain surprising because stimuli were isolated Gabors centered on RFs up to 10° off the vertical meridian. Thus, even if we dealt with the bilaterally represented part of the visual field in some cases, the actual demand of motion or shape to be anticipated cannot have been large as neither of the two exceeded the local Gabor‘s borders. In addition, prestimulus activity of receiving neurons was affected selectively. Noteworthy, prestimulus rate decreases were at least twice as large as observed with gratings covering 30 × 40° of visual space (Wunderle et al., 2013).
Based on these results, we have to assume a feature-specific facilitation before any feed forward delivered activity. Therefore, facilitation also works when the stimulus has neither a spatial (shape) nor a temporal (motion) context. Our results speak in favor of a spontaneously active network that anticipates likely motion trajectories or shapes. Indeed, Kenet et al. (2003) had described spontaneously occurring maps in cat primary visual cortex that resemble evoked orientation preference maps. In accordance, Rochefort et al. (2009) concluded that specific axons lower neuronal thresholds of receiving neurons in expectation of movement, orientation, or direction of a stimulus. In human patients, deactivation of one visual hemifield resembles a hemianopia. In line with our results, visual integration and processing in these patients are disturbed within the intact hemifield (Paramei and Sabel, 2008; Schadow et al., 2009).
We can thus formulate an updated and modified midline rule: Integration of dominant stimulus features (i.e., coherent motion but also collinear shape) that are potentially relevant for both hemifields is anticipated across the vertical meridian of the visual field by CCs to facilitate perceptual grouping in any future stimulus.
Footnotes
This work was supported by the Max Planck Society and the CNPq-BMBF Grant 01DN12056/BRA 11/056. We thank Sergio Neuenschwander for the acquisition system and Danko Nicolic for the stimulus interface.
The authors declare no competing financial interests.
References
- Bonhoeffer T, Kim DS, Malonek D, Shoham D, Grinvald A. Optical imaging of the layout of functional domains in area 17 and across the area 17/18 border in cat visual cortex. Eur J Neurosci. 1995;7:1973–1988. doi: 10.1111/j.1460-9568.1995.tb00720.x. [DOI] [PubMed] [Google Scholar]
- Bosking WH, Zhang Y, Schofield B, Fitzpatrick D. Orientation selectivity and the arrangement of horizontal connections in tree shrew striate cortex. J Neurosci. 1997;17:2112–2127. doi: 10.1523/JNEUROSCI.17-06-02112.1997. [DOI] [PMC free article] [PubMed] [Google Scholar]
- Botelho EP, Ceriatte C, Soares JG, Gattass R, Fiorani M. Quantification of early stages of cortical reorganization of the topographic map of V1 following retinal lesions in monkeys. Cereb Cortex. 2012 doi: 10.1093/cercor/bhs208. doi: 10.1093/cercor/bhs208. Advance online publication. Retrieved Sept. 25, 2013. [DOI] [PMC free article] [PubMed] [Google Scholar]
- Carmeli C, Lopez-Aguado L, Schmidt KE, De Feo O, Innocenti GM. A novel interhemispheric interaction: modulation of neuronal cooperativity in the visual areas. PLoS One. 2007;2:e1287. doi: 10.1371/journal.pone.0001287. [DOI] [PMC free article] [PubMed] [Google Scholar]
- Cynader MS, Swindale NV, Matsubara JA. Functional topography in cat area 18. J Neurosci. 1987;7:1401–1413. doi: 10.1523/JNEUROSCI.07-05-01401.1987. [DOI] [PMC free article] [PubMed] [Google Scholar]
- Eagleman DM, Sejnowski TJ. Motion signals bias localization judgments: a unified explanation for the flash-lag, flash-drag, flash-jump, and Frohlich illusions. J Vis. 2007;7:3. doi: 10.1167/7.4.3. [DOI] [PMC free article] [PubMed] [Google Scholar]
- Field DJ, Hayes A, Hess RF. Contour integration by the human visual system: evidence for a local “association field.”. Vision Res. 1993;33:173–193. doi: 10.1016/j.jphysparis.2003.09.013. [DOI] [PubMed] [Google Scholar]
- Gilbert CD, Wiesel TN. Columnar specificity of intrinsic horizontal and corticocortical connections in cat visual cortex. J Neurosci. 1989;9:2432–2442. doi: 10.1523/JNEUROSCI.09-07-02432.1989. [DOI] [PMC free article] [PubMed] [Google Scholar]
- Harvey MA, Valentiniene S, Roland PE. Cortical membrane potential dynamics and laminar firing during object motion. Front Syst Neurosci. 2009;3:7. doi: 10.3389/neuro.06.007.2009. [DOI] [PMC free article] [PubMed] [Google Scholar]
- Houzel JC, Milleret C, Innocenti G. Morphology of callosal axons interconnecting areas 17 and 18 of the cat. Eur J Neurosci. 1994;6:898–917. doi: 10.1111/j.1460-9568.1994.tb00585.x. [DOI] [PubMed] [Google Scholar]
- Houzel JC, Carvalho ML, Lent R. Interhemispheric connections between primary visual areas: beyond the midline rule. Braz J Med Biol Res. 2002;35:1441–1453. doi: 10.1590/S0100-879X2002001200005. [DOI] [PubMed] [Google Scholar]
- Hubel DH, Wiesel TN. Cortical and callosal connections concerned with the vertical meridian of visual fields in the cat. J Neurophysiol. 1967;30:1561–1573. doi: 10.1152/jn.1967.30.6.1561. [DOI] [PubMed] [Google Scholar]
- Innocenti GM. The primary visual pathway through the corpus callosum: morphological and functional aspects in the cat. Arch Ital Biol. 1980;118:124–188. [PubMed] [Google Scholar]
- Jancke D, Erlhagen W, Schöner G, Dinse HR. Shorter latencies for motion trajectories than for flashes in population responses of cat primary visual cortex. J Physiol. 2004;556:971–982. doi: 10.1113/jphysiol.2003.058941. [DOI] [PMC free article] [PubMed] [Google Scholar]
- Kenet T, Bibitchkov D, Tsodyks M, Grinvald A, Arieli A. Spontaneously emerging cortical representations of visual attributes. Nature. 2003;425:954–956. doi: 10.1038/nature02078. [DOI] [PubMed] [Google Scholar]
- Kiper DC, Knyazeva MG, Tettoni L, Innocenti GM. Visual stimulus-dependent changes in interhemispheric EEG coherence in ferrets. J Neurophysiol. 1999;82:3082–3094. doi: 10.1152/jn.1999.82.6.3082. [DOI] [PubMed] [Google Scholar]
- Kisvárday ZF, Eysel UT. Cellular organization of reciprocal patchy networks in layer III of cat visual cortex (area 17) Neuroscience. 1992;46:275–286. doi: 10.1016/0306-4522(92)90050-C. [DOI] [PubMed] [Google Scholar]
- Kisvárday ZF, Tóth E, Rausch M, Eysel UT. Orientation-specific relationship between populations of excitatory and inhibitory lateral connections in the visual cortex of the cat. Cereb Cortex. 1997;7:605–618. doi: 10.1093/cercor/7.7.605. [DOI] [PubMed] [Google Scholar]
- Knyazeva MG, Kiper DC, Vildavski VY, Despland PA, Maeder-Ingvar M, Innocenti GM. Visual stimulus-dependent changes in interhemispheric EEG coherence in humans. J Neurophysiol. 1999;82:3095–3107. doi: 10.1152/jn.1999.82.6.3095. [DOI] [PubMed] [Google Scholar]
- Lomber SG, Payne BR, Horel JA. The cryoloop: an adaptable reversible cooling deactivation method for behavioral or electrophysiological assessment of neural function. J Neurosci Methods. 1999;86:179–194. doi: 10.1016/S0165-0270(98)00165-4. [DOI] [PubMed] [Google Scholar]
- Makarov VA, Schmidt KE, Castellanos NP, Lopez-Aguado L, Innocenti GM. Stimulus-dependent interaction between the visual areas 17 and 18 of the 2 hemispheres of the ferret (Mustela Putorius) Cereb Cortex. 2008;18:1951–1960. doi: 10.1093/cercor/bhm222. [DOI] [PubMed] [Google Scholar]
- Muckli L, Kohler A, Kriegeskorte N, Singer W. Primary visual cortex activity along the apparent-motion trace reflects illusory perception. PLoS Biol. 2005;3:e265. doi: 10.1371/journal.pbio.0030265. [DOI] [PMC free article] [PubMed] [Google Scholar]
- Paramei GV, Sabel BA. Contour-integration deficits on the intact side of the visual field in hemianopia patients. Behav Brain Res. 2008;188:109–124. doi: 10.1016/j.bbr.2007.10.025. [DOI] [PubMed] [Google Scholar]
- Payne BR. Function of the corpus callosum in the representation of the visual field in cat visual cortex. Vis Neurosci. 1990;5:205–211. doi: 10.1017/S0952523800000225. [DOI] [PubMed] [Google Scholar]
- Payne BR. Neuronal interactions in cat visual cortex mediated by the corpus callosum. Behav Brain Res. 1994;64:55–64. doi: 10.1016/0166-4328(94)90118-X. [DOI] [PubMed] [Google Scholar]
- Payne BR, Siwek DF. Visual-field map in the callosal recipient zone at the border between areas 17 and 18 in the cat. Vis Neurosci. 1991;7:221–236. doi: 10.1017/S0952523800004041. [DOI] [PubMed] [Google Scholar]
- Payne BR, Siwek DF, Lomber SG. Complex transcallosal interactions in visual cortex. Vis Neurosci. 1991;6:283–289. doi: 10.1017/S0952523800006283. [DOI] [PubMed] [Google Scholar]
- Rao RP, Ballard DH. Predictive coding in the visual cortex: a functional interpretation of some extra-classical receptive-field effects. Nat Neurosci. 1999;2:79–87. doi: 10.1038/4580. [DOI] [PubMed] [Google Scholar]
- Rochefort NL, Buzás P, Quenech'du N, Koza A, Eysel UT, Milleret C, Kisvárday ZF. Functional selectivity of interhemispheric connections in cat visual cortex. Cereb Cortex. 2009;19:2451–2465. doi: 10.1093/cercor/bhp001. [DOI] [PubMed] [Google Scholar]
- Roerig B, Kao JP. Organization of intracortical circuits in relation to direction preference maps in ferret visual cortex. J Neurosci. 1999;19:RC44. doi: 10.1523/JNEUROSCI.19-24-j0002.1999. [DOI] [PMC free article] [PubMed] [Google Scholar]
- Sanides D, Albus K. The distribution of interhemispheric projections in area 18 of the cat: coincidence with discontinuities of the representation of the visual field in the second visual area (V2) Exp Brain Res. 1980;38:237–240. doi: 10.1007/BF00236745. [DOI] [PubMed] [Google Scholar]
- Schadow J, Dettler N, Paramei GV, Lenz D, Fründ I, Sabel BA, Herrmann CS. Impairments of Gestalt perception in the intact hemifield of hemianopic patients are reflected in gamma-band EEG activity. Neuropsychologia. 2009;47:556–568. doi: 10.1016/j.neuropsychologia.2008.10.012. [DOI] [PubMed] [Google Scholar]
- Schmidt KE. The visual callosal connection: a connection like any other? Neural Plast. 2013;2013:397176. doi: 10.1155/2013/397176. [DOI] [PMC free article] [PubMed] [Google Scholar]
- Schmidt KE, Kim DS, Singer W, Bonhoeffer T, Löwel S. Functional specificity of long-range intrinsic and interhemispheric connections in the visual cortex of strabismic cats. J Neurosci. 1997a;17:5480–5492. doi: 10.1523/JNEUROSCI.17-14-05480.1997. [DOI] [PMC free article] [PubMed] [Google Scholar]
- Schmidt KE, Goebel R, Löwel S, Singer W. The perceptual grouping criterion of colinearity is reflected by anisotropies of connections in the primary visual cortex. Eur J Neurosci. 1997b;9:1083–1089. doi: 10.1111/j.1460-9568.1997.tb01459.x. [DOI] [PubMed] [Google Scholar]
- Schmidt KE, Lomber SG, Innocenti GM. Specificity of neuronal responses in primary visual cortex is modulated by interhemispheric corticocortical input. Cereb Cortex. 2010;20:2776–2786. doi: 10.1093/cercor/bhq024. [DOI] [PMC free article] [PubMed] [Google Scholar]
- Schmidt KE, Lomber SG, Payne BR, Galuske RA. Pattern motion representation in primary visual cortex is mediated by transcortical feedback. Neuroimage. 2011;54:474–484. doi: 10.1016/j.neuroimage.2010.08.017. [DOI] [PubMed] [Google Scholar]
- Segraves MA, Rosenquist AC. The afferent and efferent callosal connections of retinotopically defined areas in cat cortex. J Neurosci. 1982;2:1090–1107. doi: 10.1523/JNEUROSCI.02-08-01090.1982. [DOI] [PMC free article] [PubMed] [Google Scholar]
- Shoham S, Fellows MR, Normann RA. Robust, automatic spike sorting using mixtures of multivariate t-distributions. J Neurosci Methods. 2003;127:111–122. doi: 10.1016/S0165-0270(03)00120-1. [DOI] [PubMed] [Google Scholar]
- Shon AP, Rao RP, Sejnowski TJ. Motion detection and prediction through spike-timing dependent plasticity. Network. 2004;15:179–198. doi: 10.1088/0954-898X/15/3/002. [DOI] [PMC free article] [PubMed] [Google Scholar]
- Swindale NV. Orientation tuning curves: empirical description and estimation of parameters. Biol Cybern. 1998;78:45–56. doi: 10.1007/s004220050411. [DOI] [PubMed] [Google Scholar]
- Tusa RJ, Palmer LA, Rosenquist AC. The retinotopic organization of area 17 (striate cortex) in the cat. J Comp Neurol. 1978;177:213–235. doi: 10.1002/cne.901770204. [DOI] [PubMed] [Google Scholar]
- Wunderle T, Eriksson D, Schmidt KE. Multiplicative mechanism of lateral interactions revealed by controlling interhemispheric input. Cereb Cortex. 2013;4:900–912. doi: 10.1093/cercor/bhs081. [DOI] [PubMed] [Google Scholar]


