

Abstract
Juvenile neuronal ceroid lipofuscinosis (JNCL) is a fatal childhood-onset neurodegenerative disorder caused by mutations in ceroid lipofuscinosis neuronal-3 (CLN3), a hydrophobic transmembrane protein of unresolved function. Previous studies indicate blood–brain barrier (BBB) defects in JNCL, and our earlier report showed prominent Cln3 expression in mouse brain endothelium. Here we find that CLN3 is necessary for normal trafficking of the microdomain-associated proteins caveolin-1, syntaxin-6, and multidrug resistance protein 1 (MDR1) in brain endothelial cells. Correspondingly, CLN3-null cells have reduced caveolae, and impaired caveolae- and MDR1-related functions including endocytosis, drug efflux, and cell volume regulation. We also detected an abnormal blood–brain barrier response to osmotic stress in vivo. Evaluation of the plasma membrane with fluorescent sphingolipid probes suggests microdomain destabilization and enhanced fluidity in CLN3-null cells. In further work we found that application of the glycosphingolipid lactosylceramide to CLN3-deficient cells rescues protein transport and caveolar endocytosis. Last, we show that CLN3 localizes to the trans-Golgi network (TGN) and partitions with buoyant microdomain fractions. We propose that CLN3 facilitates TGN-to-plasma membrane transport of microdomain-associated proteins. Insult to this pathway may underlie BBB dysfunction and contribute to JNCL pathogenesis.
Introduction
The neuronal ceroid lipofuscinoses (NCLs; Batten disease) are a family of neurodegenerative diseases with shared features, caused by mutations in distinct genes. The juvenile form (JNCL) is caused by recessive inheritance of mutations in CLN3, encoding the CLN3 protein. JNCL typically presents at approximately age 7 with visual impairment that rapidly progresses to blindness, followed by seizures, motor and mental decline, and death within the second decade (Jalanko and Braulke, 2009). CLN3 is a 438 aa protein with six predicted membrane-spanning regions, and has been variously reported to localize to the Golgi, trans-Golgi network (TGN), lysosomes, or autophagic vesicles. The molecular function of CLN3 is unresolved and the literature indicates impact on diverse cell processes including vesicular trafficking, pH regulation, arginine transport, autophagy, and lipid transport or metabolism (Phillips et al., 2005; Cotman and Staropoli, 2012).
Despite broad CLN3 expression, JNCL symptoms are largely restricted to the CNS. Our knock-in reporter mouse, with nuclear-targeted bacterial β-galactosidase (β-gal) driven by the endogenous Cln3 promoter, indicates Cln3 expression in neuronal subsets and in endothelial cells throughout the vasculature (Eliason et al., 2007). Consistent with this, CLN3 was previously detected in endothelial cells in human brain tissue sections (Margraf et al., 1999). Prior reports of circulating autoantibodies to brain antigens, brain IgG deposition, and focal leakage of tracers in a different CLN3-deficient mouse model (Lim et al., 2006, 2007) suggest blood–brain barrier (BBB) damage with JNCL progression. We thus hypothesized that CLN3 was critical to normal functioning and health of BBB endothelial cells.
Endothelial cells lining the CNS vasculature are a major component of the BBB. Their tight junctions, drug efflux, and transcytosis properties govern selective molecular trafficking between the blood and the brain parenchyma (Löscher and Potschka, 2005; Predescu et al., 2007). Endothelial cells have abundant caveolae: flask-shaped invaginations in the plasma membrane (PM) that serve as critical foci for signaling cascades and endocytic entry (Parton and Simons, 2007; Lajoie and Nabi, 2010). Caveolae are considered specialized cholesterol/sphingolipid-rich membrane microdomains, in which caveolin-1 is an essential scaffolding protein. Caveolin-1 assembles into higher-order multimers within microdomains upon transit from the TGN to the PM. Recent lipidomic studies in yeast show that microdomain lipids (sterol and sphingolipids) segregate into TGN-derived carriers that deliver lipids and protein cargo to the PM (Klemm et al., 2009; Surma et al., 2011). Little information exists concerning microdomain-facilitated transport from mammalian TGN, or the regulatory or stabilizing contribution of proteins to this transport pathway.
Herein we examined CLN3 in relation to endothelial cell function and membrane microdomain-related proteins. We provide intriguing new data showing that CLN3 is necessary for normal caveolin-1 transport and caveolae formation, as well as for trafficking of other microdomain-related proteins syntaxin-6 and multidrug resistance protein 1 (MDR1) in brain vascular endothelial cells. In correlation, CLN3-null cells display impaired caveolae- and MDR1-dependent functions, and abnormal PM sphingolipid dynamics. Furthermore, we find that CLN3 localizes to intracellular compartments bearing TGN and lipid microdomain markers, implicating a direct role for CLN3 in microdomain-facilitated transport from the TGN to the PM.
Materials and Methods
Animals.
All animal experiments were approved by the University of Iowa Animal Care and Use Committee and were conducted in accordance with institutional and federal guidelines. The CLN3-null mice used in this study (Cln3lacZ/lacZ) have a nuclear-localized E. coli β-galactosidase gene (lacZ) recombined in the Cln3 locus and have been backcrossed to C57BL/6 mice for >10 generations. A mix of male and female mice were used for these studies.
Cell culture.
Primary mouse brain endothelial cells cultures were produced as previously described (Song and Pachter, 2003). The low yield of purified brain endothelial cells from mouse brains precludes the use of primary cultures for experiments requiring large cell numbers, and incurs substantial time and animal costs for multiple experiments. To overcome this, we generated immortalized mouse brain endothelial cell lines (MBECs) from primary cultures of Cln3lacZ/lacZ and Cln3+/+ mice, using a previously described method (Klingelhutz et al., 1994). Briefly, replication-defective recombinant murine leukemia virus carrying human papilloma virus E6 and E7 oncogenes and pseudotyped with the VSV-G envelope glycoprotein (B-MLV-LXSH-E6/E7) was added to day 4 primary cultures at 16 × 105 transducing U/well, with 1% polybrene in a 24-well plate for 24 h. Hygromycin (25 μg/ml; Invitrogen, Carlsbad) was started 1 week later and continued until noninfected control cultures died off. MBECs are maintained in DMEM:F12 (Invitrogen) with 10% FBS, and 1% penicillin/streptomycin. Endothelial cultures expressed the endothelial cell marker Von Willebrand factor, formed ZO-1-positive tight junctions, and were devoid of astrocytes, neurons, and smooth muscle cells as assessed by immunohistochemistry. To generate MBECCln3-R, CLN3 was stably reintroduced into MBEClacZ/lacZ by transduction with a replication deficient feline immunodeficiency virus (FIV)-based lentiviral vector (FIVRSVCln3CMVmCherry) at 1 × 10⁶ transducing U/well and 1% polybrene in a 24-well plate. This vector was constructed by the University of Iowa Gene Transfer Vector Core (http://www.uiowa.edu/∼gene/) with murine Cln3 cloned 3′ to the Rous sarcoma virus (RSV) promoter and mCherry cloned 3′ to the CMV promoter, and pseudotyped with the VSV-G envelope glycoprotein. Infection with the lentiviral vector was highly efficient (>80% mCherry-positive cells), and CLN3-restored cells (red fluorescent cells) were selected by sorting on a Becton-Dickinson FACS DiVa. MBEClacZ/lacZ and MBECCln3-R thus represent CLN3-negative and -positive versions of the same cell line.
The Cln3 sequences cloned into all constructs used in this study refer to the 438 aa coding region of murine transcript NM_009907.3. In some experiments CLN3 was transiently reintroduced into immortalized MBECs by transfection with a Cln3 expression plasmid (pBUDRSVCln3) using Lipofectamine LTX (Invitrogen). This plasmid was constructed by cloning the murine Cln3 into pBUDRSV, 3′ of the RSV promoter, and 5′ of the BGHpA. pBUDRSV was constructed by cloning the RSV promoter into the multiple cloning site of pBUDmcs. pBUDmcs was derived from pBUDCE4 (Invitrogen) by removing the CMV promoter and replacing the EF1α promoter with a multiple cloning site.
Transmission electron microscopy and caveolae quantification.
Endothelial cell cultures were fixed with 2.5% glutaraldehyde in 0.1 m sodium cacodylate buffer for 1 h. For in vivo analysis, mice were perfused with 2.5% glutaraldehyde in 0.1 m sodium cacodylate buffer and 50 μm vibrotome sections were cut. Samples (cultures or brain sections) were then postfixed in 1% osmium tetroxide for 1 h, stained with uranyl acetate, dehydrated in a graded ethanol series, and embedded in Epon resin. Ultrathin 70 nm sections were cut on a Leica UC6 ultramicrotome (Leica Microsystems) and analyzed with a 1230 JEOL-JEM transmission EM (Jeol USA) at 6000×. For caveolae quantification, the total number of endothelial cell caveolae (flask-shaped invaginations connecting with apical or basolateral PM) in EM images were counted, and endothelial cell PM length was determined using ImageJ software (NIH). Results are expressed as caveolae per μm membrane. For cell cultures, EM images were collected from three independent cultures per genotype, for a total of >100 EM images per genotype. For in vivo endothelium, horizontal sections of the primary motor and somatosensory cortices between layers IV and VI of the parietal cortex from three mice per genotype were analyzed. For this, EM images were captured to reconstruct complete cross-sectional views of 15 vessels per group, and total endothelial cell caveolae counted.
Endocytosis experiments.
MBECs were incubated with Alexa488-transferrin (A488-Tfn) or A488-BSA for 30 min at 37°C, 5% O2, as previously described (Marks et al., 2005). Cells were then rinsed three times with ice-cold PBS, and fresh media with 100 mm red-40 dye added to quench extracellular fluorescence. Cells were kept on ice until image capture with an inverted fluorescence microscope (Olympus IX70 with DP70 camera). Quantifications were performed by analysis of captured images using ImageJ software. For inhibition of dynamin-dependent endocytosis, cells were incubated in cell media containing 80 μm dynasore (Abcam) for 30 min. Media was replaced with cell culture media containing 50 μg/ml A488-BSA, 80 μm dynasore, and Hoeschst 33342 for 30 min. This solution was removed and extracellular fluorescence was quenched with 100 mm red-40 before image capture as described above.
High performance thin-layer chromatograpy.
Lipids were extracted from MBEClacZ/lacZ and MBECCln3-R cell pellets and cholesterol and neutral sphingolipids (ceramide, hexosylceramides, and sphingomyelin,) were separated by high performance thin-layer chromotography and quantified by densitometry as previously described (Farwanah et al., 2009). Quantities were determined from calibration curves of corresponding lipid standards, and normalized to protein level in initial lysates.
BODIPY-LacCer staining and LacCer treatment.
Plasma membrane (PM) microdomains were labeled using LacCer (Avanti Polar Lipids) and BODIPY-LacCer (Invitrogen) according to Marks et al. (2005). Cells were loaded at 4°C by incubating with 20 μm unlabeled LacCer, followed by 2.5 μm BODIPY-LacCer. Cells were placed on ice until image capture. In some experiments, media with 50 mm red-40 dye was added after staining to quench extracellular (PM-localized) BODIPY-LacCer fluorescence. Cells were analyzed with an Olympus IX70 inverted fluorescence microscope equipped with LCPlan FL 60× (NA 0.7), and HMC LWD PL FL 40× (NA 0.6) lenses and 480 ± 20/535 ± 25 nm and 480 ± 30/630 ± 30 nm filters (Chroma Technology) for monomer and excimer signals, respectively. Images were captured with an Olympus DP70 camera and DP Controller 2.1 software. Image levels were adjusted equally, with Adobe Photoshop CS3.
For LacCer treatment, cells were loaded by incubating with 20 μm unlabeled LacCer for 30 min at 4°C, then incubated a further 30 min at 37°C before analyzing phenotypes.
FRAP analysis.
Fluorescence recovery after photobleaching (FRAP) analysis was performed on a Zeiss LSM510 microscope (Carl Zeiss) equipped with an Ar 488 nm laser. Cells were incubated with A488-CTB (Invitrogen) for 30 min and maintained at 10°C throughout the experiment to avoid internalization. After rinses with ice-cold media, photobleaching was performed with 60 iterations at 100% of 488 nm excitation and 31 pixel diameter areas were bleached. Postbleach images were captured every 5 s. FRAP was quantified as described by Kenworthy (2007).
Immunofluorescent staining.
Cells were fixed with 4% paraformaldehyde in PBS for 10 min at room temperature and blocked and permeabilized (10% goat or donkey serum and 0.1% Triton X-100 in PBS) for 1 h at room temperature. Cells were incubated with primary antibody in PBS containing 2% goat or donkey serum overnight at 4°C, Alexa-conjugated cholera toxin subunit B (CTB) or wheat germ agglutinin (WGA; Invitrogen) at 5 μg/ml for 20 min at room temperature, then Alexa-conjugated secondary antibody (Invitrogen) at 1:2000 for 1 h at room temperature. For some experiments cell nuclei were stained by 2 min incubation with Hoechst 33342 dye. Cells were coverslipped with Fluoro-Gel mounting media (Electron Microscopy Sciences) and analyzed by confocal microscopy using a Zeiss LSM710 microscope with a Plan-Apochromat 63× objective (NA 1.4) and ZEN software. For all immunofluorescent staining, secondary alone controls were included and found to give no or negligible signal. Primary antibodies used were rabbit anti-Von Willebrand factor (Dako), anti zonula occludin-1 (ZO-1, Zymed), goat anti-MDR1 (Santa Cruz Biotechnology), mouse anti-syntaxin-6, anti-phosphorylated caveolin-1 (Y14), rabbit anti-caveolin-1 (BD Transduction Laboratories), anti-TGN46 (Sigma-Aldrich), and anti-GM130 (BD Transduction Laboratories). CLN3 specific mouse polyclonal antisera was generated in our lab by tail vein injection of Cln3lacZ/lacZ mice with 5 × 10⁸ plaque-forming units of replication-deficient recombinant adenovirus vector encoding murine CLN3, driven by the CMV promoter (University of Iowa Gene Transfer Vector Core; http://www.uiowa.edu/∼gene/). Affinity purified rabbit polyclonal antibody to murine CLN3 peptide (aa 244–257) was generated by NeoBioscience.
TIRF.
Total internal reflection fluorescence (TIRF) microcopy was performed using a Leica AM TIRF Imaging System (Leica Microsystems) with a HCX PL APO 63× NA 1.47 lens. MBECs were transfected with a plasmid expressing GFP-tagged caveolin-1 (kindly provided by Amit Choudhury, University of Iowa), using Lipofectamine LTX, and 18–24 h later images were captured. For TIR illumination, GFP was excited at 488 nm using an argon laser, with a stimulated penetration depth of ∼90 nm. TIR images were captured for cells demonstrating similar transfection levels, based on epi-illumination. TIR and epi-illumination setting were identical for all cells within an experiment. Images were analyzed using LAS AF software (Leica Microsystems) and quantification was computed as follows:
 |
Fractionation on sucrose gradients and Western blots.
For fractionation of PM microdomains, MBECs from three confluent 160-mm-diameter dishes were harvested and PM isolated and subjected to detergent-free sodium carbonate extraction and centrifugation over a discontinuous sucrose density gradient as previously described (Yao et al., 2009). For fractionation of TGN microdomains, TGN-enriched fractions were isolated and subjected to carbonate extraction and discontinuous sucrose density centrifugation as previously described (Waugh et al., 2011). Then 120 μl fractions were carefully collected from top to bottom, mixed with Laemmli sample buffer, and 50 μl of each loaded onto 12% SDS/PAGE gels. Proteins were transferred onto PVDF membranes and incubated with anti-syntaxin-6, rabbit anti-caveolin-1 (BD Transduction Laboratories), or mouse anti-human transferrin receptor (Zymed) followed by HRP-coupled secondary antibodies (Jackson ImmunoResearch). For dot blot, 2 μl of each fraction were applied to nitrocellulose membranes (Immobilon-NC, Millipore) using a Minifold-1 dot-blot acrylic system (Schleicher and Schuell BioScience). Dot blots were air-dried, blocked and incubated with peroxidase-conjugated CTB (Invitrogen), which binds to GM1 lipid, for detection of raft lipid-positive fractions. Western and dot blots were developed with ECL-Plus (GE Healthcare). Results were analyzed with a VersaDoc Imaging System (Bio-Rad) and Quantity One 4.6 software, and bands/dots were quantified by densitometry using Quantity One 4.6 software.
For analysis of CLN3 partitioning to lipid microdomains, MBEClacZ/lacZ were transfected with either pBUDRSVCln3, encoding Cln3, or with pBUDmcs-negative control plasmid. Transfections were performed using Lipofectamine LTX (Invitrogen). At 24 h post-transfection membrane microdomains were isolated from transfected MBECs using detergent-free, carbonate extraction and centrifugation over a discontinuous sucrose gradient as previously described (Song et al., 1996). Fractions were collected and samples analyzed by SDS-PAGE and Western blot, or by dot blot, with blocking and washing steps as described above. For Western blot, CLN3 was detected using murine polyclonal antisera at 1/500, followed by HRP-coupled secondary.
For Western blot analyses of syntaxin-6, and total and phosphorylated caveolin-1 protein levels, confluent MBECs in 60 mm dishes were rinsed twice with ice-cold PBS and lysed with RIPA lysis buffer (150 mM NaCl, 10 mm Tris pH 7.4. 0.1% SDS, 1% Triton X-100, 1% deoxycholate, 5 mm EDTA) supplemented with mini Complete Protease Inhibitors (Roche) or HALT (ThermoScientific). Protein concentrations in lysates were determined Bio-Rad Dc-Protein assay (Bio-Rad) and equilibrated. Samples were mixed with NuPAGE sample buffer and reducing agent and run on NuPAGE 10% Bis-Tris Gels (Invitrogen), and transferred onto PVDF membranes. Immunodetection was performed with syntaxin-6, caveolin-1, and P(Tyr14)-caveolin-1 antibodies described above, and with rabbit anti-β-catenin (Abcam). Blots were immune-stained and developed as described above. Protein bands were quantified by densitometry using Quantity One 4.6 software, with each band normalized to β-catenin in the same lane.
Drug efflux assay.
MBECs were seeded at 5000 cells per well in human placenta collagen IV precoated 96-well black plates (Costar). The next day, cells were incubated with 0.5 μm calcein-AM (Invitrogen) for 1 h at 37°C. After two rinses with ice-cold calcein-AM-free media, baseline intracellular fluorescence was determined by reading the plate on a FLUOstar plate reader (BMG Lab Technologies) using 485 nm/538 nm (ex/em) filters. The cells were returned to the incubator at 37°C, 5% CO2 for 1 h, washed as before, and a second fluorescent measurement obtained. Efflux was determined as the difference between the first and second measurements.
Volume regulation analysis.
Cell volume changes were determined using a method similar to that previously described (Srinivas et al., 2003). Primary brain endothelial cell cultures from Cln3+/+ and Cln3lacZ/lacZ mice were grown as monolayers in transwells (6.5 mm diameter, 0.4 μm pore size, polyester membrane; Costar, Corning) precoated with human placenta collagen IV (Sigma-Aldrich). Just before analysis, cell surfaces were biotinylated by incubation with 1.5 mg/ml sulfo-NHS-SS-biotin (Thermo Scientific) for 1 h at 37°C, 5% CO2. After two rinses with ice-cold PBS, cells were incubated with 4 μl/ml FluoSpheres NeutrAvidin microspheres (1.0 μm diameter; Invitrogen) for 1 h at 37°C, 5% CO2. After washing monolayers with media, transwells were placed on a glass bottom culture dish (MatTek). Iso-osmoalar media was placed below (5 μl) and in (40 μl) the transwell. Timed confocal z-series images were collected through the depth of the monolayer using a Zeiss LSM 510 microscope with LSM software. After the first series, the transwell medium was made hypo-osmotic by addition of 20 μl of water to the transwell (final 30% water). Cell volume changes were determined by measuring the change in fluorescence intensity at the top confocal plane and at the bottom confocal plane. Using ImageJ, fluorescence intensities of four separate fields of view for upper and lower confocal planes were determined, with background fluorescence subtracted and intensities normalized to area. The average fluorescence intensity between at 0 and 14 min was determined for upper and lower confocal planes.
Blood–brain barrier permeability assay.
Seven 5-month-old mice per group were anesthetized and given intracarotid injection of 100 μl of Hoechst 33258 (100 μg/ml, Invitrogen) dissolved in 1 mm CaCl2 hypotonic solution, injected over 30 s. For positive controls of BBB disruption, Cln3+/+ mice were given intraperitoneal injection of 3 ml/100 g body weight 20% d-mannitol (Sigma-Aldrich) 10 min before intracarotid injection of isotonic Hoechst solution. Thirty minutes after tracer injection, mice were perfused with 15 ml of 4% PFA intraventricularly, before brain harvest. Brains were cryoprotected with 30% sucrose, embedded in OCT (Tissue-Tek, Sakura Finetek), and 40 μm cryosections were mounted on glass plus slides and analyzed by microscopy (Olympus BX60 and camera Olympus DP70).
Statistics.
Data with normal distributions (D'Agostino normality test) were analyzed by Student's t test (calcein-AM efflux, A488-BSA uptake) and data without normal distributions were analyzed by Wilcoxon rank sum test (A488-Tfn uptake, immunoblot densitometry, FRAP, TIRF, caveolae number), using GraphPad Prism5. Shifts in the distribution across sucrose density gradients were analyzed by two-way ANOVA.
Results
Reduced caveolae and caveolae-dependent endocytosis in CLN3-deficient brain endothelial cells
To study CLN3 function in brain endothelial cells, we prepared cultures of murine brain microvascular endothelial cells from Cln3lacZ/lacZ and wild-type counterparts (Cln3+/+). Cln3lacZ/lacZ mice carry the β-gal reporter gene in place of Cln3 exons 1–8, and are CLN3-null (Eliason et al., 2007). We examined primary cultures by EM and were struck by the paucity of caveolae in the CLN3-deficient cells relative to Cln3+/+ cells (Fig. 1A). We counted caveolae in >100 EM images each for control and CLN3-null primary cultures, and verified a significant decrease (0.08 ± 0.02 mean caveolae per μm membrane compared with 0.35 ± 0.03 for control; Fig. 1A). To confirm this phenotype in vivo, EM images were overlaid to recreate cross-sectional views of 15 distinct vessels per genotype, and endothelia examined for caveolae. Representative EM images taken from brain sections are shown in Figure 1A. Similar to cultured cells, a significant reduction in caveolae was observed in brain endothelia from CLN3-null mice (Fig. 1A; 0.10 ± 0.02 mean caveolae per micrometer membrane compared with 0.40 ± 0.10 for control).
Figure 1.

Reduced caveolae and caveolae-dependent endocytosis in CLN3-null endothelial cells. A, Primary brain endothelial cell cultures and brain sections from the motor/somatosensory cortex of Cln3+/+ and CLN3-null (Cln3lacZ/lacZ) mice were processed and examined by transmission EM. Representative EM images are shown for endothelial cells in primary culture and in vivo. Arrows indicate caveolae. Scale bars, 500 nm. For quantification, caveolae were counted in multiple EM images collected from three independent cultures per group or from brains of three mice per group, and data are expressed as the number of caveolae per μm of PM. Data points for cultured cells (top graph) represent individual EM images, while data points for in vivo analysis (bottom graph) represent individual vessels in cross-section; mean ± SEM are indicated by long/short horizontal bars, respectively; ***p < 0.001. B, Immortalized (MBECs) or primary brain endothelial cells were immunostained for Von Willebrand factor (VW; endothelial marker, red fluorescence) and for zonula occludens-1 (ZO-1, tight junction marker, green fluorescence). MBEC images are lacZ/lacZ and are representative of all genotypes. C, Immortalized (MBECs) or primary brain endothelial cells were incubated with A488-Tfn or A488-BSA and endocytosis analyzed by fluorescence microscopy. Images are representative of 3–5 experiments. Scale bars, 20 μm. D, The quantity of internalized A488-Tfn or A488-BSA was determined using ImageJ software analysis and is expressed as the mean ± SEM (***p < 0.001, 20–50 cells analyzed per group).
To investigate the functional impact of reduced caveolae, we generated immortalized mouse brain endothelial cells (MBECs) from Cln3lacZ/lacZ and Cln3+/+ mice. In addition, we used a lentiviral vector to stably reintroduce CLN3 to the MBEClacZ/lacZ, creating a CLN3-restored sister cell line (MBECCln3-R). The MBECs exhibit brain endothelial markers and features (Fig. 1B) and serve as valuable tools for this study (see Materials and Methods for details). Herein we compared CLN3-null versus CLN3-expressing MBECs, often with confirmation in primary brain endothelial cell cultures.
The specific influence of CLN3 on caveolae-dependent endocytosis has not previously been delineated. Therefore, we followed uptake of fluorescently conjugated BSA and transferrin (Tfn) as indicators of caveolae- and clathrin-based endocytosis, respectively (Cheng et al., 2006). Binding of Tfn (iron-loaded) to the Tfn receptor triggers internalization into clathrin-coated vesicles. In contrast, BSA is internalized primarily via caveolae-dependent endocytosis. Caveolae-based endocytosis is clathrin-independent, and in endothelial cells is initiated by BSA binding to gp60 at the cell surface (Tiruppathi et al., 1997). To assess internalization, MBECs were incubated with either Alexa-488-Tfn (A488-Tfn) or Alexa-488-BSA (A488-BSA). Fluorescent images were captured after 30 min (Fig. 1C), and relative levels of internalization were quantified with ImageJ software (Fig. 1D). A488-Tfn uptake was not significantly different between MBEClacZ/lacZ and MBECCln3-R cells. In contrast, endocytosis of A488-BSA was markedly and significantly diminished in MBEClacZ/lacZ relative to MBECCln3-R. Primary endothelial cell cultures behaved in identical fashion to the immortalized MBECs; clear defects in BSA uptake were observed in the CLN3-null cells (Fig. 1C,D). Caveolar but not fluid-phase endocytosis relies on dynamin. Thus as an assurance that A488-BSA uptake into MBECs was occurring via caveolae-based and not via fluid-phase endocytosis, we pretreated the cultures for 30 min with 80 μm of the dynamin-inhibitory drug dynasore before addition of A488-BSA and assessment of endocytosis. Dynasore completely blocked A488-BSA uptake into MBECs (data not shown), confirming the dynamin dependence of A488-BSA uptake in these cells. Together our data suggest that CLN3 is dispensable for clathrin-dependent endocytosis, but is required for normal caveolae-dependent endocytosis.
MBECs require CLN3 for normal caveolin-1 transport and phosphorylation
We next used immunofluorescent microscopy and Western blot to determine whether changes in the subcellular distribution or abundance of caveolin-1 might account for the scarcity of caveolae in CLN3-null MBECs, and resultant endocytic defect. The fluorescent staining intensity for caveolin-1 was dramatically reduced in the MBEClacZ/lacZ line compared with MBECCln3-R, particularly at cell–cell junctional regions at the PM (Fig. 2A). Immunoblot however revealed no difference in the total amount of caveolin-1 (Fig. 2B), indicating that reduced detection by immunofluorescence was a consequence of altered intracellular distribution rather than a drop in protein level. We next transfected MBECs with GFP-caveolin-1 and used TIRF microscopy to directly observe GFP-caveolin-1 on the basal PM. GFP-caveolin-1 was more prominent at the PM of MBECCln3-R compared with MBEClacZ/lacZ (Fig. 2C). Quantification of TIRF images revealed a striking 50% drop in PM caveolin-1 in the absence of CLN3 (Fig. 2C), suggesting that CLN3 is required for normal anterograde trafficking of caveolin-1.
Figure 2.

CLN3 promotes normal trafficking of caveolin-1. A, CLN3-expressing and nonexpressing endothelial cells were stained for caveolin-1 and P(Tyr14)-Caveolin-1 and analyzed by confocal microscopy. Cell nuclei were stained with Hoechst dye (blue). Representative images are shown. Scale bars, 20 μm. B, Lysates from CLN3-deficient (lacZ/lacZ) or restored (Cln3-R) MBECs were assayed by SDS-PAGE and immunoblot for caveolin-1 (cav-1) and P(Tyr14)-Caveolin-1 (P-cav-1). Bands were quantified and normalized to β-catenin by densitometric analysis. Bars show mean ± SEM (n = 6 experiments); **p < 0.01. C, Twenty-four hours after transfection with GFP-caveolin-1 plasmid, live TIRF images of MBEClacZ/lacZ and MBECCln3-R were captured. Representative images are shown. Scale bars, 20 μm. PM levels of GFP-caveolin-1 were determined by analyzing captured TIRF images with LAS AF software, and the bar graph shows the mean ± SEM intensity for each group (***p < 0.001, 50 cells analyzed per group).
As phosphorylation of caveolin-1 at tyrosine-14 is a critical step in caveolae-based endocytosis in endothelial cells (Sverdlov et al., 2007), we examined the phosphorylation status of caveolin-1 in relation to CLN3. By both immunofluorescent staining and immunoblot approaches, we found that pTyr14-Cav1 was significantly reduced in MBEClacZ/lacZ relative to MBECCln3-R (Fig. 2A,B). Reduced immunofluroescent detection of pTyr14-Cav1 in the absence of CLN3 was similarly demonstrated in primary endothelial cell cultures (Fig. 2A). Collectively these findings indicate that CLN3 promotes caveolin-1 delivery to the PM for the formation of caveolae and endocytic signaling platforms.
Delivery of caveolin-1 and other microdomain-associated proteins from the TGN to the PM is regulated by the t-SNARE protein, syntaxin-6 (Choudhury et al., 2006), which localizes primarily at the TGN (Jung et al., 2012). Immunofluorescent staining showed syntaxin-6-positive vesicles concentrated near the nucleus in both CLN3-expressing and null cells, but with reduced intensity in CLN3-null cells, and Image J analysis verified this difference (Fig. 3A). However, similar to caveolin-1, immunoblot quantification revealed similar total levels of syntaxin-6 (Fig. 3B), suggesting that the diminished immunofluorescent signal results from a more diffuse molecular distribution of syntaxin-6. We used wheat germ agglutinin (WGA) as a TGN marker to determine whether syntaxin-6 localization to the TGN was perturbed. While a proportion of syntaxin-6 clearly colocalized to WGA-positive perinuclear compartments in both MBEClacZ/lacZ and MBECCln3-R (Fig. 3C), Pearson's analysis revealed a statistically significant drop in the correlation coefficient in the absence of CLN3, indicating altered distribution of syntaxin-6 relative to WGA. In addition, WGA staining revealed a fractured and less-polarized TGN in MBEClacZ/lacZ, compared with a more compact, polarized appearance in CLN3-expressing MBECs. Staining patterns for the cis-Golgi markers GM130 and giantin were not different between MBEClacZ/lacZ and MBECCln3-R (Fig. 3D). The coordinate mislocalization of both caveolin-1 and syntaxin-6 in the absence of CLN3, and abnormal morphology of the TGN implicates a novel role for CLN3 in the TGN-to-PM transport of microdomain-associated proteins.
Figure 3.
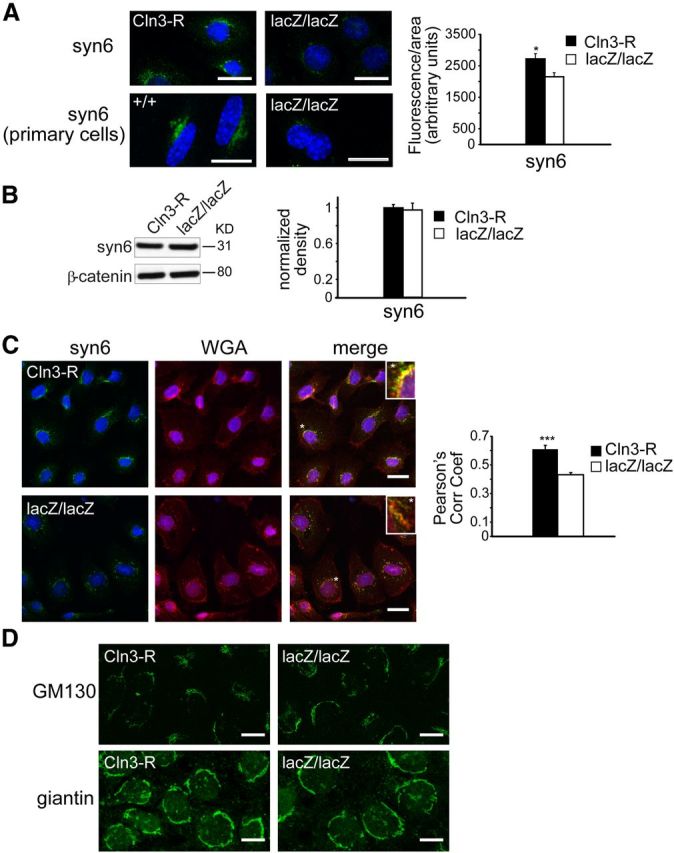
CLN3 promotes normal trafficking of syntaxin 6. A, CLN3-expressing and nonexpressing endothelial cells were stained for syntaxin-6 (syn6) and analyzed by confocal microscopy. Cell nuclei (blue dye) are shown. Scale bars, 20 μm. Fluorescence intensity was quantified in MBECs. Bars show the mean ± SEM for each group (*p < 0.05, 32 cells analyzed per group). B, SDS-PAGE and immunoblot analyses for syntaxin-6 was performed as in Figure 2. Bars show mean ± SEM of four experiments. C, Colocalization analyses for syntaxin-6 (green) and WGA (red) in CLN3-deficient (lacZ/lacZ) or restored (Cln3-R) MBECs. Cell nuclei were stained with Hoechst dye (blue). Pearson's correlation coefficients were calculated for red/green channels for lacZ/lacZ and Cln3-R MBECs and bars show mean ± SEM (***p < 0.001, 32 cells per group). All fluorescence quantifications were performed using ImageJ software. D, MBEClacZ/lacZ and MBECCln3-R cells were immunofluorescently stained for cis-Golgi markers GM-130 or giantin. Representative confocal images are shown. Scale bar, 10 μm.
Impaired MDR1 distribution, drug efflux and volume regulation in CLN3-null MBECs
Our findings that CLN3 is important for caveolin-1 transport and BSA endocytosis prompted investigation of additional caveolae-dependent endothelial cell processes. Multidrug resistance protein 1 (MDR1, P-glycoprotein, ABCB1) is highly expressed on the luminal surface of brain vascular endothelial cells, where it mediates apical efflux of numerous small molecules (Schinkel et al., 1994). In BBB endothelial cells, MDR1 localizes to caveolae and demonstrates functionally relevant binding to caveolin-1 (Jodoin et al., 2003). To assess drug efflux function in the MBECs, we used calcein-AM, a cell permeable dye which is hydrolyzed to a nonpermeable product in the cytoplasm and requires MDR1 (or MRP1, ABCC1) for subsequent efflux. After loading with calcein-AM, intracellular fluorescence was measured at time 0, and again at 60 min to determine efflux. We observed a 40% reduction in efflux from MBEClacZ/lacZ relative to MBEC+/+ (Fig. 4A). Correspondingly, MDR1 staining intensity was reduced in MBEClacZ/lacZ compared with MBEC+/+ (Fig. 4B). Thus, CLN3-deficient cells are impaired in drug efflux, likely as a consequence of reduced MDR1 incorporation into caveolar microdomains at the PM.
Figure 4.
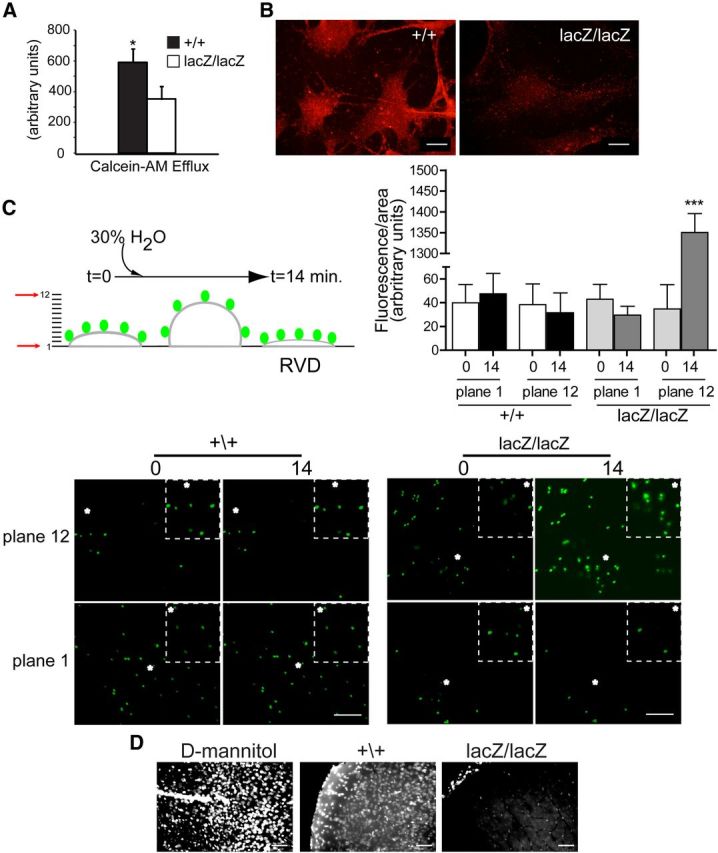
CLN3 is necessary for normal drug efflux and cell volume regulation in brain endothelial cells. A, MBECs were loaded with calcein-AM and efflux was determined by measuring decrease in intracellular fluorescence after 1 h. Bars shown mean ± SEM drop in fluorescence (*p < 0.05, n = 3 independent experiments). B, MBECs were immunofluorescently stained for MDR1 and analyzed by confocal microscopy. Settings for image capture were identical between compared cell types. Representative images are shown. Scale bar, 20 μm. C, Apical membranes of primary brain endothelial cultures were labeled with 1.0 μm diameter FluoSpheres and confocal z-series images were collected through the depth of the monolayer, under isotonic starting conditions (time 0) and after hypotonic challenge (30% water). Fluorescence intensity was quantified in focal planes 1 and 12 at time 0, and after 14 min using ImageJ software and bars show mean ± SEM (***p < 0.001). D, Cln3+/+ and Cln3lacZ/lacZ mice were given an intracarotid injection of hypotonic tracer (Hoechst 33258) and killed 30 min later. For positive controls for BBB disruption, Cln3+/+ mice were given d-mannitol (i.p. 20% mannitol in isotonic saline) 10 min before an intracarotid injection of isotonic tracer (labeled as D-mannitol). Brains were analyzed by fluorescence microscopy (n = 7 mice per group). Settings for image capture and for image adjustment (MetaMorph software) were identical between groups. Representative images from cerebral cortex are shown.
In addition to its drug transport activity, MDR1 is also known to participate in regulatory volume decrease (RVD). RVD occurs in reaction to hypotonic exposure: cell swelling immediately triggers K+ or Cl− efflux, which is followed by osmotically obliged efflux of water, resulting in cell volume decrease and restoration of original (or slightly below original) cell volume. MDR1 fulfills a proximal role in RVD by enhancing the activation of swelling-activated Cl− channels (Valverde et al., 1996; Wang et al., 1998). To determine whether CLN3 affects RVD, we coated apical cell surfaces of primary endothelial cell cultures with fluorescent microbeads, and followed bead displacement after hypotonic shock (30% H2O addition) by confocal z-series image capture. Data were continuously collected from 12 horizontal planes spanning 12 micrometers, from the base of the cells to above the beads (Fig. 4C). For CLN3-null endothelial cell cultures, we found that from time 0 to14 min posthypotonic shock the fluorescence became significantly more intense in the upper plane, and less intense in the lower plane, indicating upward bead movement, and swollen cells. In contrast, normal RVD was triggered in wild-type cultures, such that by 14 min the cell volume receded to slightly below the starting value. These results implicate CLN3 as critical for the RVD process in brain vascular endothelial cells. Collectively our data support a role for CLN3 in normal MDR1 transport and function at the PM.
We next assessed the in vivo response to hypotonic exposure at the BBB. To accomplish this we infused hypotonic solutions of Hoechst 33258 tracer into the carotid artery of CLN3-deficient (Cln3lacZ/lacZ) and wild-type (Cln3+/+) mice, and assessed passage into the brain. Hoechst 33258 is a small (562D) aqueous soluble dye, and is used as a sensitive indicator of BBB disruption (Nitta et al., 2003; del Valle et al., 2008; Pfeiffer et al., 2011). At 30 min after injection, Hoechst-positive nuclei were abundant in the brain parenchyma of Cln3+/+ brain tissue sections, whereas positive nuclei were restricted to the blood vessels in Cln3lacZ/lacZ sections (Fig. 4D). These results are consistent with our in vitro data; in Cln3+/+ mice, the hypotonic injection triggers RVD with overshoot, creating transient loss of tight junctions and paracellular passage of tracer. In contrast, the brain endothelium in CLN3-null mice is devoid of RVD and BBB integrity is maintained under these conditions. The in vivo response to hypotonic challenge may additionally or alternatively involve transcytosis of tracer. Support for hypo-osmotic influence on transcytosis comes from studies in kidney epithelium, where introduction of an osmotic gradient across the polarized barrier triggers transcytosis (Lauer and Minuth, 1988; Reid and O'Neil, 2000). As caveolae act as portals for transcytosis in endothelial cells (Predescu et al., 2007), impaired transcytosis may occur in the absence of CLN3. Together our experiments highlight reduced endothelial cell performance in caveolae- and MDR-1-dependent cellular processes, with altered in vivo responses to an osmotic gradient.
Under unstressed conditions, BBB integrity was qualitatively intact in JNCL and control mice (data not shown). This contrasts a previous report in another JNCL mouse model, using different experimental methods (Lim et al., 2007). Interestingly, caveolin-1 has proposed roles in both the stabilization of tight junctions (Song et al., 2007), and in chemokine-induced loss of tight junctions (Stamatovic et al., 2009) in BBB models. Perhaps tight junctions are maintained early on by low level PM caveolin-1 or compensatory mechanisms, but deteriorate in vulnerable areas with disease progression and increased neuroinflammation (Pontikis et al., 2004, 2005).
CLN3 modulates membrane microdomain properties
Our findings of altered trafficking of microdomain-related proteins and functions led us to investigate membrane properties. We first took a biochemical approach to assess partitioning of caveolin-1 and syntaxin-6 to membrane domains isolated from cell lysates. To avoid artifacts related to lipid reassembly during detergent extraction (Lichtenberg et al., 2005), we used a detergent-free, carbonate-based extraction method for microdomain fractionation (Song et al., 1996; Yao et al., 2009). Golgi- or PM-enriched membranes from cell lysates were sonicated, extracted with carbonate to remove loosely associated proteins, and separated by centrifugation over a sucrose density gradient. With this method, separation of membrane fragments is based on buoyancy, which correlates with increased lipid–protein ratio and enrichment for cholesterol and sphingolipids (Ortegren et al., 2004; Yao et al., 2009). Fractions collected from top to bottom of the gradients were analyzed by Western blot for caveolin-1 and syntaxin-6, and by dot blot for the GM1, a microdomain-enriched sphingolipid (Fig. 5A). Caveolin-1 and syntaxin-6 partitioned to buoyant fractions in both MBEClacZ/lacZ and MBECCln3-R. However, in the absence of CLN3, the fractions containing the most abundant concentrations of caveolin-1 and syntaxin-6 were shifted toward earlier, more buoyant ones for both PM and TGN membranes. We measured this shift by densitometric analysis of the bands across fractions for three (caveolin-1) or two (syntaxin-6) separate experiments, as illustrated in the Figure 5A histograms. A similar shift toward to lighter fractions was detected for GM1 in the PM (Fig. 5A). Together with Figures 2 and 3 these results suggest that without CLN3, altered composition of TGN and PM membrane domains occurs and negatively influences TGN-to-PM transport of caveolin-1 and syntaxin-6.
Figure 5.
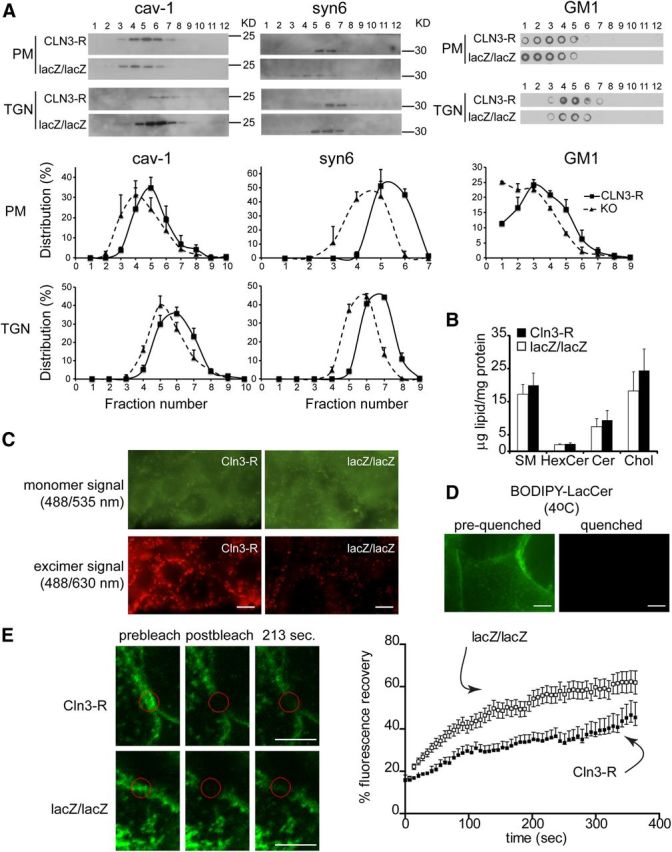
CLN3 affects microdomain properties. A, Golgi- and PM-enriched membranes were isolated from MBECCln3-R and MBEClacZ/lacZ lysates, carbonate-extracted, sonicated and centrifuged over a sucrose gradient. Fractions were analyzed for caveolin-1 (cav-1) and syntaxin-6 (syn6) by Western blot, and GM1-containing fractions were identified by dot-blot. Densitometry was performed on the blots and histograms show the distribution of caveolin-1 (three experiments), syntaxin-6 (two experiments), and GM1 (three experiments; PM shown) across fractions, expressed as the mean ± SEM percentage of the total of all fractions (p < 0.001 for all comparisons of curve shifts of MBEClacZ/lacZ to MBECCln3-R data). B, Total lipids were extracted from MBEClacZ/lacZ and MBECCln3-R and analyzed by quantitative high performance thin-layer chromatography. Results show mean relative abundance ±SEM (n = 3 separate cultures). C, Apical surfaces of live MBECCln3-R and MBEClacZ/lacZ were labeled with BODIPY-LacCer. Images were captured at 535 ± 25 nm (green) and 630 ± 30 nm (red). Green fluorescence indicates loading of BODIPY-LacCer into the PM. Red fluorescence identifies liquid-ordered membrane domains, with close packing of BODIPY-LacCer molecules. Results are representative of three separate experiments. Scale bar, 10 μm. D, Apical surfaces of live MBECCln3-R were labeled with BODIPY-LacCer and images were captured before (left) and immediately after (right) addition of impermeable red-40 dye to the media to quench extracellular (PM localized) BODIPY-LacCer fluorescence. Scale bar, 20 μm. E, GM1 in the PM of live MBEClacZ/lacZ and MBECCln3-R was labeled with A488-CTB, and cells maintained at 20°C for FRAP analysis. Photobleaching was performed with 60 iterations at 100% of 488 nm excitation and 31-pixel diameter areas were bleached. Postbleach images were captured every 5 s. Representative FRAP images are shown. Scale bar, 5 μm. Data shown is mean ± SEM fluorescence intensity (n = 11 or 12 cells) and is representative of 3 experiments. p < 0.0001, recovery of MBEClacZ/lacZ compared with MBECCln3-R.
We addressed the possible impact of CLN3 on the biosynthesis of microdomain-related lipids by extracting total lipids from MBEClacZ/lacZ and MBECCln3-R and quantifying by high performance TLC. No significant differences were found for any of the lipids analyzed (sphingomyelin, ceramide, hexosylceramides, and cholesterol; Fig. 5B), suggesting that the defects in trafficking of microdomain-related proteins in CLN3-deficient MBECs are not a consequence of gross deficiency of these lipids. The possibility of changes in subclasses of these lipids or other lipids, or disturbance in subcellular compartmentalization of lipids requires further exploration.
We next ascertained the influence of CLN3 on PM microdomain properties in live cells. Microdomains (or lipid rafts) are conventionally thought of as relatively stable, microscale cholesterol/sphingolipid-enriched membrane regions with more ordered lipid packing relative to a general disordered lipid arrangement in the surrounding membrane (Simons and Ikonen, 1997; Pike, 2004). This original concept has been challenged by the recent advancement of super-resolution optical methods that indicate that sphingolipid/cholesterol-based domains exist as transient nanoscale entities on the PM (Eggeling et al., 2009; Simons and Gerl, 2010). However, perturbation in protein-lipid and protein-protein interactions can modulate raft composition, size and tendency to coalesce into more stable, functionally relevant microdomains (Pike, 2006; Lingwood and Simons, 2010). Micrometer-size regions of heterogeneity on the PM of live cells are indeed detected by using BODIPY-labeled sphingolipid probes (Marks et al., 2005; D'Auria et al., 2011). The BODIPY fluorophore exhibits monomer/excimer emission, such that intermolecular proximity induces a green-to-red spectral shift, allowing distinction of membrane domains that tightly pack the BODIPY-tagged lipid (Marks et al., 2005). We loaded the PM of MBEC at 4°C with BODIPY-lactosylceramide (BODIPY-LacCer) and assessed the cells by fluorescence microscopy. Green (515 nm) monomer signal was distributed across the PM, and was similar in MBECCln3-R and MBEClacZ/lacZ, indicating equal loading (Fig. 5C). In contrast, the red (>620 nm) excimer signal, designating microdomains, was substantially stronger in the MBECCln3-R and highlighted many large PM patches, as opposed to primarily small puncta in the MBEClacZ/lacZ (Fig. 5C). As an assurance that the BODIPY-LacCer remained at the PM and was not internalized, we applied a cell-impermeant fluorescence-quenching red dye to the media after staining. This dye completely eliminated fluorescence (Fig. 5D), indicating PM origin. Our results suggest that in CLN3-null cells, PM microdomains as defined by BODIPY-LacCer accumulation and excimer signal have reduced propensity to coalesce and have decreased lipid-order.
Next we examined whether sphingolipid mobility within the PM was affected by CLN3. To assess this we followed the movement of Alexa-488-conjugated cholera toxin subunit B (A488-CTB) using FRAP. CTB demonstrates high-affinity, multivalent binding to GM1, a sphingolipid which localizes to the outer leaflet of the PM and is enriched in microdomains. A488-CTB was applied to intact cells, and after focal photobleaching of a 2 μm diameter area within a GM1-rich region, the rate of A488-CTB (green fluorescence) movement into the area was measured. FRAP analysis revealed a faster recovery rate in MBEClacZ/lacZ compared with MBECCln3-R (Fig. 5E), indicating enhanced movement of CTB-GM1 into the bleached region, suggestive of increased membrane fluidity within GM1-rich domains in CLN3-deficient cells. This finding is consistent with reduced BODIPY-LacCer excimer signal, and strengthens a scenario in which CLN3 imparts order and stability to membrane domains.
It is possible that CLN3 localizes to microdomains to influence their properties. However, currently available antibodies do not reliably detect endogenous levels of CLN3. Thus, we transfected MBEClacZ/lacZ with a CLN3 expression plasmid, and took two approaches to assess CLN3 localization to membrane domains. First, after fixing and permeabilizing, we dual stained MBECs with A488-CTB (to label GM1) and antibodies to murine CLN3, and assessed overlap by confocal microcopy. CLN3 was not apparent on the PM of transfected cells, and as expected was predominantly vesicular. By confocal analysis, substantial GM1 and CLN3 colocalization was observed within intracellular compartments, particularly in vesicles concentrated in the perinuclear region of cells (Fig. 6A). Dual staining for CLN3 and Golgi markers indicated that CLN3 signal was distinct from, though proximal to, the cis-Golgi marker GM130. CLN3 showed overlap with the TGN marker TGN46, and prominent overlap with WGA-labeled intracellular compartments (Fig. 6A). These results place CLN3 within the TGN/post-TGN compartment, putatively along a microdomain-dependent anterograde transport pathway.
Figure 6.
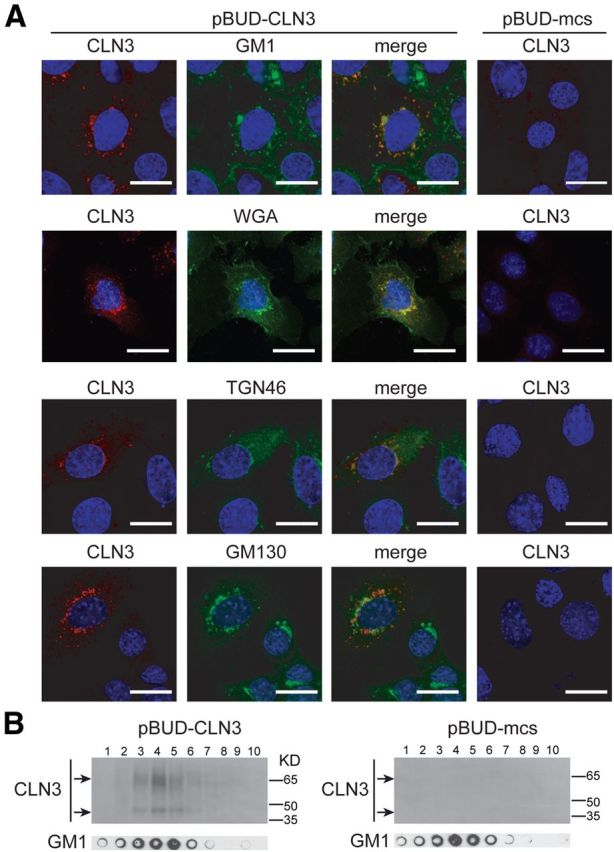
CLN3 localization to TGN and membrane microdomains. A, MBEClacZ/lacZ were transfected with empty control plasmid (pBUD-mcs) or a CLN3 expression plasmid (pBUD-CLN3). Twenty-four hours post-transfection cells were fixed, permeabilized, and dual stained for CLN3 and a marker for GM1 microdomains (A488-CTB), TGN (WGA or TGN46), or cis-Golgi (GM130). Stained cells were analyzed by confocal microscopy. Representative images are shown. Scale bars, 20 μm. B, MBEClacZ/lacZ transfected as in A were extracted with carbonate and fractionated over a discontinuous sucrose gradient. Fractions from top to bottom were analyzed by Western blot for CLN3 and by dot blot for GM1.
As a second approach to examining CLN3 presence in membrane domains we determined whether CLN3 partitioned to lipid-rich buoyant fractions, using the nondetergent, carbonate extraction method. CLN3 clearly partitioned to buoyant fractions (Fig. 6B). By dot blot, these fractions harbor GM1-enriched membrane microdomains (Fig. 6B). Partitioning of CLN3 to these buoyant fractions is consistent with localization in cholesterol/sphingolipid-rich microdomains in TGN/post-TGN compartments. Several other investigators have reported Golgi/TGN residence for CLN3 at physiological, nonoverexpressed levels (Kremmidiotis et al., 1999; Persaud-Sawin et al., 2004; Codlin and Mole, 2009), or describe adverse Golgi/TGN phenotypes in CLN3-deficient cells (Metcalf et al., 2008; Codlin and Mole, 2009). Localization of CLN3 to the TGN and to buoyant membrane domains implicates CLN3 in microdomain-associated transport in brain endothelial cells.
Lactosylceramide corrects phenotypes in CLN3-null MBECs
Because CLN3-deficient MBECs have altered sphingolipid mobility and a reduced tendency of membrane domains to form larger microdomains, as determined by the Bodipy-LacCer assay, we next tested whether sphingolipid addition might reverse cellular defects. LacCer has been previously shown to promote microdomain formation and enhance caveolar endocytosis (Sharma et al., 2005). We added LacCer to MBEClacZ/lacZ and MBECCln3-R and incubated for 30 min at 4°C followed by 30 min at 37°C to allow for LacCer integration into PM domains and retrograde transport to Golgi (Marks et al., 2005; Cheng et al., 2006). MBECs were then fixed and immunofluorescently stained. Remarkably, LacCer treatment normalized caveolin-1, syntaxin-6, and MDR1 localization in CLN3-deficient MBECs (Fig. 7A).
Figure 7.

Corrective effects of LacCer. A, MBECs were untreated, or incubated for 30 min at 37°C with mock solution or LacCer added to the culture medium, and then fixed and immunostained for caveolin-1 (cav-1), syntaxin-6 (syn6), or MDR1. LacCer was applied as a 1:1 molar complex with defatted-BSA. B, MBECs were untreated or incubated for 30 min at 37°C with mock solution or LacCer added to the culture medium, then A488-BSA was added and uptake assessed 30 min later by fluorescence microscopy. Images are representative of three independent experiments.
Caveolae-dependent endocytosis was also assessed after LacCer treatment. For this, MBECs were pretreated with LacCer before addition of A488-BSA, and A488-BSA internalization analyzed 30 min later by fluorescence microscopy. LacCer treatment normalized A488-BSA uptake in MBEClacZ/lacZ to MBECCln3-R levels (Fig. 7B). Therefore, addition of LacCer reestablishes transport of caveolin-1 and MDR1, and importantly, corrects caveolae-dependent endocytosis in CLN3-deficient MBECs. These restorative effects are exciting and may present a promising avenue for JNCL therapies.
Discussion
Our study is novel in demonstrating defects in the transport of the microdomain-localized proteins caveolin-1, MDR1 and syntaxin-6 in the absence of CLN3, and in linking these defects to disturbances in physical properties of microdomains. Moreover ours is the first description of CLN3 partitioning to buoyant microdomain fractions, isolated by a detergent-free method. Collectively our findings implicate CLN3 as having a direct influence on membrane domain-coupled transport pathways from the TGN to the PM.
Reduced caveolin-1 transport to the PM and impaired caveolae-dependent functions were prominent findings in this study. Caveolae-based endocytosis was markedly diminished by CLN3 loss. We also uncovered a strict dependence on CLN3 for RVD in endothelial cells as well as a role for CLN3 in drug efflux, likely reflecting a dependence on CLN3 for correct MDR1 trafficking to PM caveolae in brain endothelial cells. RVD pathways are not entirely understood, and may invoke distinct molecular players in different cells types. Interestingly, both MDR1 and caveolin-1 have described roles in RVD; MDR1 has an immediate role in triggering anion efflux (Valverde et al., 1996), whereas caveolae reformation contributes to recovery from osmotic-induced swelling (Sinha et al., 2011). The double hit to this pathway in CLN3-null cells could explain the severe RVD phenotype. As gatekeeper to the CNS, BBB functions are critical to neuronal health and we thus speculate that faulty endocytosis/transcytosis, drug efflux, and volume-regulatory pathways contribute to progressive neuronal dysfunction and loss in JNCL.
We investigated whether defective transport of microdomain-associated proteins was accompanied by microdomain disturbances. Application of BODIPY-LacCer to the PM revealed a substantial drop in excimer signal in CLN3-null cells, indicating a relaxed association of lipids within microdomains. In addition, excimer signal was more punctate and less patchy, suggesting diminished domain clustering in the CLN3-deficient cells. By FRAP, A488-CTB-GM1 diffused more rapidly into bleached regions in CLN3-null relative to CLN3-restored cells. This supports increased membrane fluidity and is consistent with the weakened BODIPY-LacCer excimer signal. We cannot exclude potential cytoskeletal contribution to the kinetics of fluorescence recovery. Cytoskeletal-defined barriers may act as fences to confine molecular movements within defined regions of the PM (Kusumi et al., 2005). CLN3 has reported connections with cytoskeletal elements (Uusi-Rauva et al., 2008; Getty et al., 2011) that may act to strengthen membrane heterogeneities in a yet-to-be defined manner. Cumulatively, we conclude that the lipid probes signify abnormalities in glycosphingolipid arrangements within PM microdomains of CLN3-deficient cells.
We found that CLN3 partitioned to buoyant microdomain fractions, and immunostaining showed overlap with intracellular GM1-positive compartments and TGN markers. These data suggest that CLN3 operates within TGN microdomains to facilitate anterograde cargo transport. In model membrane systems, phase separation of lipids into ordered and disordered domains occurs spontaneously, and budding is energetically favored when domains reach a critical size (Baumgart et al., 2003; Hurley et al., 2010). This is more complex in cells. Current models for carrier formation at the Golgi or TGN incorporate protein–protein and protein–lipid interactions and lipid modifications, to synchronize membrane tubulation, bending, and fission (Bard and Malhotra, 2006; Anitei and Hoflack, 2011; Ha et al., 2012). Membrane partitioning into liquid-ordered and disordered domains is becoming increasingly recognized as an important aspect of transport pathways from the TGN (Lippincott-Schwartz and Phair, 2010; Surma et al., 2012). Indeed, a recent study showed that Golgi synthesis of short-chain (in place of long-chain) sphingomyelin boosts membrane disorder and reduces phase separation in the Golgi, concurrent with impaired cargo exit to the PM (Duran et al., 2012). Also, high-resolution fluorescence microscopy of the mammalian Golgi reveals segregation of resident and cargo proteins into distinct membrane domains, supporting a rapid partitioning model for sorting and transport of cargo through the Golgi (Patterson et al., 2008; Lippincott-Schwartz and Phair, 2010). Based on our current findings, our schematic depicts CLN3 within TGN membrane domains, where it provides a scaffolding role to facilitate microdomain coalescence and budding from the TGN (Fig. 8). Given that CLN3 has been detected in various subcellular compartments, it is conceivable that CLN3 is involved in membrane partitioning-based transport from other compartments, perhaps dependent on cell type or circumstance.
Figure 8.

Model of CLN3 in anterograde transport from the TGN. Our model predicts that CLN3 localizes to membrane microdomains in the TGN, and facilitates microdomain clustering and/or stabilization of larger domains. This in-turn promotes the biogenesis of carrier vesicles, for TGN-to-PM transport of caveolin-1 and other microdomain-associated proteins.
How LacCer restores trafficking of microdomain-associated proteins is unknown. One possibility is that LacCer corrects a sphingolipid deficiency or transport defect in CLN3-null cells. Interestingly, prior work found that sphingolipid-deficient CHO cells displayed defective caveolin-1 transport, caveolae formation and caveolar endocytosis, and that exogenous application of LacCer relieved these defects (Cheng et al., 2006). Our findings are similar. A relationship between CLN3 and sphingolipids is also suggested by previous studies from one group which proposes that CLN3 participates in galactosylceramide transport from the Golgi to PM lipid rafts (Persaud-Sawin et al., 2004; Rusyn et al., 2008). However those data are not conclusive, leaving the hypothesis unsubstantiated. Their experiments indicated altered levels of several sphingolipids within Triton X-100-resistant fractions from JNCL cells. Our analysis of total cellular levels of microdomain (raft) lipids revealed no differences between CLN3-null and CLN3-restored MBECs. Nonetheless, in-depth investigation of a role for CLN3 in relation to biosynthesis or intracellular transport of sphingolipids is warranted.
Alternatively, restorative effects of LacCer in CLN3-null MBECs may result from delivery of supranormal levels of LacCer to the TGN, enhancing the probability of phase partitioning and domain-induced carrier biogenesis, and thus compensating for the absence of a coalescence-promoting function of CLN3. In addition, LacCer may act directly on the PM to contribute to caveolae stabilization and endocytosis. Antibody-induced cross-linking of PM-localized β-integrin induces microdomain assemblage, triggering caveolae-based endocytosis (Sharma et al., 2004, 2005; Upla et al., 2004; Singh et al., 2007). Interestingly, a similar outcome is achieved by exogenous application of LacCer alone, and is attributed to the ability of LacCer to promote domain clustering (Sharma et al., 2005; Singh et al., 2007). Overall our data suggest that in the absence of CLN3 there is a reduced ability of membrane domains to coalesce, and that LacCer relieves this deficit. We suggest that in JNCL cells the primary defect is at the TGN, with consequent impairment of anterograde lipid/protein trafficking, creating an analogous defect in the PM. LacCer likely assists at both locales in an interdependent manner.
If CLN3 helps establish or stabilize microdomains within the TGN, one might expect disturbances in import and export pathways. A recent study in yeast localizes the CLN3 ortholog Btn1p to the TGN, and demonstrates that Btn1p deficiency imparts defects in retromer-mediated retrieval of particular cargo from the late endosome to Golgi, in parallel with reduced Yck3-mediated phosphorylation of a Golgi SNARE protein (Kama et al., 2011). Cargo retrieval was restored by replacing the Yck3 palmitoylation domain with a transmembrane domain. Intriguingly, several proteins with reported ties to CLN3, such as calsenilin (Chang et al., 2007), Yck3 (Kama et al., 2011), Rab7 (Uusi-Rauva et al., 2012) as well as caveolin-1, are palmitoylated. Protein palmitoylation often dictates anchorage into membrane microdomains (Levental et al., 2010; Aicart-Ramos et al., 2011). Perhaps in JNCL cells, abnormal TGN microdomains underlie poor recruitment/retention of microdomain-associated proteins and certain palmitoylated proteins are particularly affected.
In addition to sphingolipids (Persaud-Sawin et al., 2004; Rusyn et al., 2008), alterations in phospholipids have been reported in JNCL tissue or cells. Bis(monoacylglycero)phosphate was diminished in Triton X100-resistanct membranes from patient brain tissue (Hobert and Dawson, 2007). Also, the cellular phospholipid profile was abnormal in Btn1p-deficient yeast (Padilla-López et al., 2012). How these observations relate to microdomain disturbance is currently unknown, but certainly microdomain perturbations could influence microdomain-associated enzyme activity, alter substrate access, or induce compensatory changes in lipid biosynthesis.
It is increasingly appreciated that alterations in membrane microdomain-related functions contribute to nervous system dysfunction and neurodegeneration (Schengrund, 2010). Relevant to our work, caveolin-1-deficient mice develop neurological deficits (Trushina et al., 2006) associated with diminished synaptosomal protein localization to detergent-resistant buoyant fractions, enhanced susceptibility to ischemic injury, and premature neuron loss (Head et al., 2010). It will be interesting to investigate how CLN3 loss impacts synaptic protein function and microdomain localization.
A diagnostic feature of NCL is the abnormal intracellular accumulation of autofluorescent material, called lipofuscin or ceroid, in many cell types including neurons (Seehafer and Pearce, 2006). A causative or correlative relationship with neuronal dysfunction is unclear. The MBECs used in our experiments are proliferating cells and show no evidence of lipofuscin accumulation. This suggests that microdomain disturbance is a primary defect, and that autofluorescent storage buildup occurs secondarily in postmitotic, aging cells. In studies of JNCL neuronal progenitors, Fossale et al. (2004) similarly reported the occurrence of cellular defects in the absence of storage.
In summary, we describe loss of caveolae and related cellular defects as pathologic features of CLN3-deficient cells. Our observations implicate impaired microdomain dynamics as a primary determinant of the diverse cellular phenotypes noted, and a contributing factor to JNCL pathology. Moreover our finding that LacCer application has restorative effects in CLN3-null endothelial cells emphasizes microdomain lipid supplement as a therapeutic approach worthy of further examination.
Footnotes
This work was supported by the Roy J. Carver Trust, the NIH (NS 34568), the Batten Disease Support and Research Association, Beyond Batten Foundation, and the University of Iowa Central Microscopy Facility and Gene Transfer Vector Core (DK 54759). We thank Amit Choudhury and Mark Stamnes for critical review of the paper, and Amit Choudhury for helpful discussions.
The authors declare no competing financial interests.
References
- Aicart-Ramos C, Valero RA, Rodriguez-Crespo I. Protein palmitoylation and subcellular trafficking. Biochim Biophys Acta. 2011;1808:2981–2994. doi: 10.1016/j.bbamem.2011.07.009. [DOI] [PubMed] [Google Scholar]
- Anitei M, Hoflack B. Exit from the trans-Golgi network: from molecules to mechanisms. Curr Opin Cell Biol. 2011;23:443–451. doi: 10.1016/j.ceb.2011.03.013. [DOI] [PubMed] [Google Scholar]
- Bard F, Malhotra V. The formation of TGN-to-plasma-membrane transport carriers. Annu Rev Cell Dev Biol. 2006;22:439–455. doi: 10.1146/annurev.cellbio.21.012704.133126. [DOI] [PubMed] [Google Scholar]
- Baumgart T, Hess ST, Webb WW. Imaging coexisting fluid domains in biomembrane models coupling curvature and line tension. Nature. 2003;425:821–824. doi: 10.1038/nature02013. [DOI] [PubMed] [Google Scholar]
- Chang JW, Choi H, Kim HJ, Jo DG, Jeon YJ, Noh JY, Park WJ, Jung YK. Neuronal vulnerability of CLN3 deletion to calcium-induced cytotoxicity is mediated by calsenilin. Hum Mol Genet. 2007;16:317–326. doi: 10.1093/hmg/ddl466. [DOI] [PubMed] [Google Scholar]
- Cheng ZJ, Singh RD, Sharma DK, Holicky EL, Hanada K, Marks DL, Pagano RE. Distinct mechanisms of clathrin-independent endocytosis have unique sphingolipid requirements. Mol Biol Cell. 2006;17:3197–3210. doi: 10.1091/mbc.E05-12-1101. [DOI] [PMC free article] [PubMed] [Google Scholar]
- Choudhury A, Marks DL, Proctor KM, Gould GW, Pagano RE. Regulation of caveolar endocytosis by syntaxin 6-dependent delivery of membrane components to the cell surface. Nat Cell Biol. 2006;8:317–328. doi: 10.1038/ncb1380. [DOI] [PubMed] [Google Scholar]
- Codlin S, Mole SE. S. Pombe btn1, the orthologue of the batten disease gene cln3, is required for vacuole protein sorting of cpy1p and Golgi exit of vps10p. J Cell Science. 2009;122:1163–1173. doi: 10.1242/jcs.038323. [DOI] [PMC free article] [PubMed] [Google Scholar]
- Cotman SL, Staropoli JF. The juvenile batten disease protein, cln3, and its role in regulating anterograde and retrograde post-Golgi trafficking. Clinical Lipidology. 2012;7:79–91. doi: 10.2217/clp.11.70. [DOI] [PMC free article] [PubMed] [Google Scholar]
- D'Auria L, Van der Smissen P, Bruyneel F, Courtoy PJ, Tyteca D. Segregation of fluorescent membrane lipids into distinct micrometric domains: evidence for phase compartmentation of natural lipids? PloS One. 2011;6:e17021. doi: 10.1371/journal.pone.0017021. [DOI] [PMC free article] [PubMed] [Google Scholar]
- del Valle J, Camins A, Pallàs M, Vilaplana J, Pelegrí C. A new method for determining blood–brain barrier integrity based on intracardiac perfusion of an evans blue-Hoechst cocktail. J Neurosci Methods. 2008;174:42–49. doi: 10.1016/j.jneumeth.2008.06.025. [DOI] [PubMed] [Google Scholar]
- Duran JM, Campelo F, van Galen J, Sachsenheimer T, Sot J, Egorov MV, Rentero C, Enrich C, Polishchuk RS, Goñi FM, Brügger B, Wieland F, Malhotra V. Sphingomyelin organization is required for vesicle biogenesis at the Golgi complex. EMBO J. 2012;31:4535–4546. doi: 10.1038/emboj.2012.317. [DOI] [PMC free article] [PubMed] [Google Scholar]
- Eggeling C, Ringemann C, Medda R, Schwarzmann G, Sandhoff K, Polyakova S, Belov VN, Hein B, von Middendorff C, Schönle A, Hell SW. Direct observation of the nanoscale dynamics of membrane lipids in a living cell. Nature. 2009;457:1159–1162. doi: 10.1038/nature07596. [DOI] [PubMed] [Google Scholar]
- Eliason SL, Stein CS, Mao Q, Tecedor L, Ding SL, Gaines DM, Davidson BL. A knock-in reporter model of batten disease. J Neurosci. 2007;27:9826–9834. doi: 10.1523/JNEUROSCI.1710-07.2007. [DOI] [PMC free article] [PubMed] [Google Scholar]
- Farwanah H, Wirtz J, Kolter T, Raith K, Neubert RH, Sandhoff K. Normal phase liquid chromatography coupled to quadrupole time of flight atmospheric pressure chemical ionization mass spectrometry for separation, detection and mass spectrometric profiling of neutral sphingolipids and cholesterol. J Chromatogr B Analyt Technol Biomed Life Sci. 2009;877:2976–2982. doi: 10.1016/j.jchromb.2009.07.008. [DOI] [PubMed] [Google Scholar]
- Fossale E, Wolf P, Espinola JA, Lubicz-Nawrocka T, Teed AM, Gao H, Rigamonti D, Cattaneo E, MacDonald ME, Cotman SL. Membrane trafficking and mitochondrial abnormalities precede subunit c deposition in a cerebellar cell model of juvenile neuronal ceroid lipofuscinosis. BMC Neurosci. 2004;5:57. doi: 10.1186/1471-2202-5-57. [DOI] [PMC free article] [PubMed] [Google Scholar]
- Getty AL, Benedict JW, Pearce DA. A novel interaction of cln3 with nonmuscle myosin-IIb and defects in cell motility of cln3(−/−) cells. Exp Cell Res. 2011;317:51–69. doi: 10.1016/j.yexcr.2010.09.007. [DOI] [PMC free article] [PubMed] [Google Scholar]
- Ha KD, Clarke BA, Brown WJ. Regulation of the golgi complex by phospholipid remodeling enzymes. Biochim Biophys Acta. 2012;1821:1078–1088. doi: 10.1016/j.bbalip.2012.04.004. [DOI] [PMC free article] [PubMed] [Google Scholar]
- Head BP, Peart JN, Panneerselvam M, Yokoyama T, Pearn ML, Niesman IR, Bonds JA, Schilling JM, Miyanohara A, Headrick J, Ali SS, Roth DM, Patel PM, Patel HH. Loss of caveolin-1 accelerates neurodegeneration and aging. PloS One. 2010;5:e15697. doi: 10.1371/journal.pone.0015697. [DOI] [PMC free article] [PubMed] [Google Scholar]
- Hobert JA, Dawson G. A novel role of the batten disease gene cln3: association with bmp synthesis. Biochem Biophys Res Commun. 2007;358:111–116. doi: 10.1016/j.bbrc.2007.04.064. [DOI] [PMC free article] [PubMed] [Google Scholar]
- Hurley JH, Boura E, Carlson LA, Różycki B. Membrane budding. Cell. 2010;143:875–887. doi: 10.1016/j.cell.2010.11.030. [DOI] [PMC free article] [PubMed] [Google Scholar]
- Jalanko A, Braulke T. Neuronal ceroid lipofuscinoses. Biochim Biophys Acta. 2009;1793:697–709. doi: 10.1016/j.bbamcr.2008.11.004. [DOI] [PubMed] [Google Scholar]
- Jodoin J, Demeule M, Fenart L, Cecchelli R, Farmer S, Linton KJ, Higgins CF, Béliveau R. P-glycoprotein in blood–brain barrier endothelial cells: interaction and oligomerization with caveolins. J Neurochem. 2003;87:1010–1023. doi: 10.1046/j.1471-4159.2003.02081.x. [DOI] [PubMed] [Google Scholar]
- Jung JJ, Inamdar SM, Tiwari A, Choudhury A. Regulation of intracellular membrane trafficking and cell dynamics by syntaxin-6. Biosci Rep. 2012;32:383–391. doi: 10.1042/BSR20120006. [DOI] [PMC free article] [PubMed] [Google Scholar]
- Kama R, Kanneganti V, Ungermann C, Gerst JE. The yeast batten disease orthologue btn1 controls endosome-Golgi retrograde transport via snare assembly. J Cell Biol. 2011;195:203–215. doi: 10.1083/jcb.201102115. [DOI] [PMC free article] [PubMed] [Google Scholar]
- Kenworthy AK. Fluorescence recovery after photobleaching studies of lipid rafts. Methods Mol Biol. 2007;398:179–192. doi: 10.1007/978-1-59745-513-8_13. [DOI] [PubMed] [Google Scholar]
- Klemm RW, Ejsing CS, Surma MA, Kaiser HJ, Gerl MJ, Sampaio JL, de Robillard Q, Ferguson C, Proszynski TJ, Shevchenko A, Simons K. Segregation of sphingolipids and sterols during formation of secretory vesicles at the trans-Golgi network. J Cell Biol. 2009;185:601–612. doi: 10.1083/jcb.200901145. [DOI] [PMC free article] [PubMed] [Google Scholar]
- Klingelhutz AJ, Barber SA, Smith PP, Dyer K, McDougall JK. Restoration of telomeres in human papillomavirus-immortalized human anogenital epithelial cells. Mol Cell Biol. 1994;14:961–969. doi: 10.1128/mcb.14.2.961. [DOI] [PMC free article] [PubMed] [Google Scholar]
- Kremmidiotis G, Lensink IL, Bilton RL, Woollatt E, Chataway TK, Sutherland GR, Callen DF. The batten disease gene product (CLN3p) is a Golgi integral membrane protein. Hum Mol Gen. 1999;8:523–531. doi: 10.1093/hmg/8.3.523. [DOI] [PubMed] [Google Scholar]
- Kusumi A, Nakada C, Ritchie K, Murase K, Suzuki K, Murakoshi H, Kasai RS, Kondo J, Fujiwara T. Paradigm shift of the plasma membrane concept from the two-dimensional continuum fluid to the partitioned fluid: high-speed single-molecule tracking of membrane molecules. Annu Rev Biophys Biomol Struct. 2005;34:351–378. doi: 10.1146/annurev.biophys.34.040204.144637. [DOI] [PubMed] [Google Scholar]
- Lajoie P, Nabi IR. Lipid rafts, caveolae, and their endocytosis. Int Rev Cell Mol Biol. 2010;282:135–163. doi: 10.1016/S1937-6448(10)82003-9. [DOI] [PubMed] [Google Scholar]
- Lauer G, Minuth WW. Apico-basal osmotic gradient induces transcytosis in cultured renal collecting duct epithelium. J Membr Biol. 1988;101:93–101. doi: 10.1007/BF01872824. [DOI] [PubMed] [Google Scholar]
- Levental I, Lingwood D, Grzybek M, Coskun U, Simons K. Palmitoylation regulates raft affinity for the majority of integral raft proteins. Proc Natl Acad Sci U S A. 2010;107:22050–22054. doi: 10.1073/pnas.1016184107. [DOI] [PMC free article] [PubMed] [Google Scholar]
- Lichtenberg D, Goñi FM, Heerklotz H. Detergent-resistant membranes should not be identified with membrane rafts. Trends Biochem Sci. 2005;30:430–436. doi: 10.1016/j.tibs.2005.06.004. [DOI] [PubMed] [Google Scholar]
- Lim MJ, Beake J, Bible E, Curran TM, Ramirez-Montealegre D, Pearce DA, Cooper JD. Distinct patterns of serum immunoreactivity as evidence for multiple brain-directed autoantibodies in juvenile neuronal ceroid lipofuscinosis. Neuropathol Appl Neurobiol. 2006;32:469–482. doi: 10.1111/j.1365-2990.2006.00738.x. [DOI] [PubMed] [Google Scholar]
- Lim MJ, Alexander N, Benedict JW, Chattopadhyay S, Shemilt SJ, Guérin CJ, Cooper JD, Pearce DA. Igg entry and deposition are components of the neuroimmune response in batten disease. Neurobiol Dis. 2007;25:239–251. doi: 10.1016/j.nbd.2006.09.005. [DOI] [PubMed] [Google Scholar]
- Lingwood D, Simons K. Lipid rafts as a membrane-organizing principle. Science. 2010;327:46–50. doi: 10.1126/science.1174621. [DOI] [PubMed] [Google Scholar]
- Lippincott-Schwartz J, Phair RD. Lipids and cholesterol as regulators of traffic in the endomembrane system. Annu Rev Biophys. 2010;39:559–578. doi: 10.1146/annurev.biophys.093008.131357. [DOI] [PMC free article] [PubMed] [Google Scholar]
- Löscher W, Potschka H. Blood–brain barrier active efflux transporters: ATP-binding cassette gene family. NeuroRx. 2005;2:86–98. doi: 10.1602/neurorx.2.1.86. [DOI] [PMC free article] [PubMed] [Google Scholar]
- Margraf LR, Boriack RL, Routheut AA, Cuppen I, Alhilali L, Bennett CJ, Bennett MJ. Tissue expression and subcellular localization of cln3, the batten disease protein. Mol Genet Metab. 1999;66:283–289. doi: 10.1006/mgme.1999.2830. [DOI] [PubMed] [Google Scholar]
- Marks DL, Singh RD, Choudhury A, Wheatley CL, Pagano RE. Use of fluorescent sphingolipid analogs to study lipid transport along the endocytic pathway. Methods. 2005;36:186–195. doi: 10.1016/j.ymeth.2004.12.001. [DOI] [PubMed] [Google Scholar]
- Metcalf DJ, Calvi AA, Seaman MN, Mitchison HM, Cutler DF. Loss of the batten disease gene cln3 prevents exit from the tgn of the mannose 6-phosphate receptor. Traffic. 2008;9:1905–1914. doi: 10.1111/j.1600-0854.2008.00807.x. [DOI] [PubMed] [Google Scholar]
- Nitta T, Hata M, Gotoh S, Seo Y, Sasaki H, Hashimoto N, Furuse M, Tsukita S. Size-selective loosening of the blood–brain barrier in claudin-5-deficient mice. J Cell Biol. 2003;161:653–660. doi: 10.1083/jcb.200302070. [DOI] [PMC free article] [PubMed] [Google Scholar]
- Ortegren U, Karlsson M, Blazic N, Blomqvist M, Nystrom FH, Gustavsson J, Fredman P, Strålfors P. Lipids and glycosphingolipids in caveolae and surrounding plasma membrane of primary rat adipocytes. Eur J Biochem. 2004;271:2028–2036. doi: 10.1111/j.1432-1033.2004.04117.x. [DOI] [PubMed] [Google Scholar]
- Padilla-López S, Langager D, Chan CH, Pearce DA. Btn1, the saccharomyces cerevisiae homolog to the human batten disease gene, is involved in phospholipid distribution. Dis Model Mech. 2012;5:191–199. doi: 10.1242/dmm.008490. [DOI] [PMC free article] [PubMed] [Google Scholar]
- Parton RG, Simons K. The multiple faces of caveolae. Nat Rev Mol Cell Biol. 2007;8:185–194. doi: 10.1038/nrm2122. [DOI] [PubMed] [Google Scholar]
- Patterson GH, Hirschberg K, Polishchuk RS, Gerlich D, Phair RD, Lippincott-Schwartz J. Transport through the Golgi apparatus by rapid partitioning within a two-phase membrane system. Cell. 2008;133:1055–1067. doi: 10.1016/j.cell.2008.04.044. [DOI] [PMC free article] [PubMed] [Google Scholar]
- Persaud-Sawin DA, McNamara JO, 2nd, Rylova S, Vandongen A, Boustany RM. A galactosylceramide binding domain is involved in trafficking of cln3 from Golgi to rafts via recycling endosomes. Pediatr Res. 2004;56:449–463. doi: 10.1203/01.PDR.0000136152.54638.95. [DOI] [PubMed] [Google Scholar]
- Pfeiffer F, Schäfer J, Lyck R, Makrides V, Brunner S, Schaeren-Wiemers N, Deutsch U, Engelhardt B. Claudin-1 induced sealing of blood–brain barrier tight junctions ameliorates chronic experimental autoimmune encephalomyelitis. Acta Neuropathologica. 2011;122:601–614. doi: 10.1007/s00401-011-0883-2. [DOI] [PMC free article] [PubMed] [Google Scholar]
- Phillips SN, Benedict JW, Weimer JM, Pearce DA. Cln3, the protein associated with batten disease: structure, function and localization. J Neurosci Res. 2005;79:573–583. doi: 10.1002/jnr.20367. [DOI] [PubMed] [Google Scholar]
- Pike LJ. Lipid rafts: heterogeneity on the high seas. Biochem J. 2004;378:281–292. doi: 10.1042/BJ20031672. [DOI] [PMC free article] [PubMed] [Google Scholar]
- Pike LJ. Rafts defined: a report on the keystone symposium on lipid rafts and cell function. J Lipid Res. 2006;47:1597–1598. doi: 10.1194/jlr.E600002-JLR200. [DOI] [PubMed] [Google Scholar]
- Pontikis CC, Cella CV, Parihar N, Lim MJ, Chakrabarti S, Mitchison HM, Mobley WC, Rezaie P, Pearce DA, Cooper JD. Late onset neurodegeneration in the CLN3−/− mouse model of juvenile neuronal ceroid lipofuscinosis is preceded by low level glial activation. Brain Res. 2004;1023:231–242. doi: 10.1016/j.brainres.2004.07.030. [DOI] [PubMed] [Google Scholar]
- Pontikis CC, Cotman SL, MacDonald ME, Cooper JD. Thalamocortical neuron loss and localized astrocytosis in the cln3deltaex7/8 knock-in mouse model of batten disease. Neurobiol Dis. 2005;20:823–836. doi: 10.1016/j.nbd.2005.05.018. [DOI] [PubMed] [Google Scholar]
- Predescu SA, Predescu DN, Malik AB. Molecular determinants of endothelial transcytosis and their role in endothelial permeability. Am J Physiol Lung Cell Mol Physiol. 2007;293:L823–L842. doi: 10.1152/ajplung.00436.2006. [DOI] [PubMed] [Google Scholar]
- Reid JM, O'Neil RG. Osmomechanical regulation of membrane trafficking in polarized cells. Biochem Biophys Res Commun. 2000;271:429–434. doi: 10.1006/bbrc.2000.2638. [DOI] [PubMed] [Google Scholar]
- Rusyn E, Mousallem T, Persaud-Sawin DA, Miller S, Boustany RM. Cln3p impacts galactosylceramide transport, raft morphology, and lipid content. Pediatr Res. 2008;63:625–631. doi: 10.1203/PDR.0b013e31816fdc17. [DOI] [PubMed] [Google Scholar]
- Schengrund CL. Lipid rafts: keys to neurodegeneration. Brain Res Bull. 2010;82:7–17. doi: 10.1016/j.brainresbull.2010.02.013. [DOI] [PubMed] [Google Scholar]
- Schinkel AH, Smit JJ, van Tellingen O, Beijnen JH, Wagenaar E, van Deemter L, Mol CA, van der Valk MA, Robanus-Maandag EC, te Riele HP. Disruption of the mouse mdr1a P-glycoprotein gene leads to a deficiency in the blood–brain barrier and to increased sensitivity to drugs. Cell. 1994;77:491–502. doi: 10.1016/0092-8674(94)90212-7. [DOI] [PubMed] [Google Scholar]
- Seehafer SS, Pearce DA. You say lipofuscin, we say ceroid: defining autofluorescent storage material. Neurobiol Aging. 2006;27:576–588. doi: 10.1016/j.neurobiolaging.2005.12.006. [DOI] [PubMed] [Google Scholar]
- Sharma DK, Brown JC, Choudhury A, Peterson TE, Holicky E, Marks DL, Simari R, Parton RG, Pagano RE. Selective stimulation of caveolar endocytosis by glycosphingolipids and cholesterol. Mol Biol Cell. 2004;15:3114–3122. doi: 10.1091/mbc.E04-03-0189. [DOI] [PMC free article] [PubMed] [Google Scholar]
- Sharma DK, Brown JC, Cheng Z, Holicky EL, Marks DL, Pagano RE. The glycosphingolipid, lactosylceramide, regulates beta1-integrin clustering and endocytosis. Cancer Res. 2005;65:8233–8241. doi: 10.1158/0008-5472.CAN-05-0803. [DOI] [PubMed] [Google Scholar]
- Simons K, Gerl MJ. Revitalizing membrane rafts: new tools and insights. Nat Rev Mol Cell Biol. 2010;11:688–699. doi: 10.1038/nrm2977. [DOI] [PubMed] [Google Scholar]
- Simons K, Ikonen E. Functional rafts in cell membranes. Nature. 1997;387:569–572. doi: 10.1038/42408. [DOI] [PubMed] [Google Scholar]
- Singh RD, Holicky EL, Cheng ZJ, Kim SY, Wheatley CL, Marks DL, Bittman R, Pagano RE. Inhibition of caveolar uptake, sv40 infection, and beta1-integrin signaling by a nonnatural glycosphingolipid stereoisomer. J Cell Biol. 2007;176:895–901. doi: 10.1083/jcb.200609149. [DOI] [PMC free article] [PubMed] [Google Scholar]
- Sinha B, Köster D, Ruez R, Gonnord P, Bastiani M, Abankwa D, Stan RV, Butler-Browne G, Vedie B, Johannes L, Morone N, Parton RG, Raposo G, Sens P, Lamaze C, Nassoy P. Cells respond to mechanical stress by rapid disassembly of caveolae. Cell. 2011;144:402–413. doi: 10.1016/j.cell.2010.12.031. [DOI] [PMC free article] [PubMed] [Google Scholar]
- Song KS, Li Shengwen, Okamoto T, Quilliam LA, Sargiacomo M, Lisanti MP. Co-purification and direct interaction of ras with caveolin, an integral membrane protein of caveolae microdomains: detergent-free purification of caveolae microdomains. J Biol Chem. 1996;271:9690–9697. doi: 10.1074/jbc.271.16.9690. [DOI] [PubMed] [Google Scholar]
- Song L, Ge S, Pachter JS. Caveolin-1 regulates expression of junction-associated proteins in brain microvascular endothelial cells. Blood. 2007;109:1515–1523. doi: 10.1182/blood-2006-07-034009. [DOI] [PMC free article] [PubMed] [Google Scholar]
- Song L, Pachter JS. Culture of murine brain microvascular endothelial cells that maintain expression and cytoskeletal association of tight junction-associated proteins. In Vitro Cell Dev Biol Anim. 2003;39:313–320. doi: 10.1290/1543-706X(2003)039<0313:COMBME>2.0.CO%3B2. [DOI] [PubMed] [Google Scholar]
- Srinivas SP, Bonanno JA, Larivière E, Jans D, Van Driessche W. Measurement of rapid changes in cell volume by forward light scattering. Pflugers Arch. 2003;447:97–108. doi: 10.1007/s00424-003-1145-5. [DOI] [PMC free article] [PubMed] [Google Scholar]
- Stamatovic SM, Keep RF, Wang MM, Jankovic I, Andjelkovic AV. Caveolae-mediated internalization of occludin and claudin-5 during ccl2-induced tight junction remodeling in brain endothelial cells. J Biol Chem. 2009;284:19053–19066. doi: 10.1074/jbc.M109.000521. [DOI] [PMC free article] [PubMed] [Google Scholar]
- Surma MA, Klose C, Klemm RW, Ejsing CS, Simons K. Generic sorting of raft lipids into secretory vesicles in yeast. Traffic. 2011;12:1139–1147. doi: 10.1111/j.1600-0854.2011.01221.x. [DOI] [PubMed] [Google Scholar]
- Surma MA, Klose C, Simons K. Lipid-dependent protein sorting at the trans-golgi network. Biochem Biophys Acta. 2012;1821:1059–1067. doi: 10.1016/j.bbalip.2011.12.008. [DOI] [PubMed] [Google Scholar]
- Sverdlov M, Shajahan AN, Minshall RD. Tyrosine phosphorylation-dependence of caveolae-mediated endocytosis. J Cell Mol Med. 2007;11:1239–1250. doi: 10.1111/j.1582-4934.2007.00127.x. [DOI] [PMC free article] [PubMed] [Google Scholar]
- Tiruppathi C, Song W, Bergenfeldt M, Sass P, Malik AB. Gp60 activation mediates albumin transcytosis in endothelial cells by tyrosine kinase-dependent pathway. J Biol Chem. 1997;272:25968–25975. doi: 10.1074/jbc.272.41.25968. [DOI] [PubMed] [Google Scholar]
- Trushina E, Du Charme J, Parisi J, McMurray CT. Neurological abnormalities in caveolin-1 knock out mice. Behav Brain Res. 2006;172:24–32. doi: 10.1016/j.bbr.2006.04.024. [DOI] [PubMed] [Google Scholar]
- Upla P, Marjomäki V, Kankaanpää P, Ivaska J, Hyypiä T, Van Der Goot FG, Heino J. Clustering induces a lateral redistribution of α2β1 integrin from membrane rafts to caveolae and subsequent protein kinase C-dependent internalization. Mol Biol Cell. 2004;15:625–636. doi: 10.1091/mbc.E03-08-0588. [DOI] [PMC free article] [PubMed] [Google Scholar]
- Uusi-Rauva K, Luiro K, Tanhuanpää K, Kopra O, Martín-Vasallo P, Kyttälä A, Jalanko A. Novel interactions of CLN3 protein link batten disease to dysregulation of fodrin-NA+, K+ ATPase complex. Exp Cell Res. 2008;314:2895–2905. doi: 10.1016/j.yexcr.2008.06.016. [DOI] [PubMed] [Google Scholar]
- Uusi-Rauva K, Kyttälä A, van der Kant R, Vesa J, Tanhuanpää K, Neefjes J, Olkkonen VM, Jalanko A. Neuronal ceroid lipofuscinosis protein cln3 interacts with motor proteins and modifies location of late endosomal compartments. Cell Mol Life Sci. 2012;69:2075–2089. doi: 10.1007/s00018-011-0913-1. [DOI] [PMC free article] [PubMed] [Google Scholar]
- Valverde MA, Bond TD, Hardy SP, Taylor JC, Higgins CF, Altamirano J, Alvarez-Leefmans FJ. The multidrug resistance P-glycoprotein modulates cell regulatory volume decrease. EMBO J. 1996;15:4460–4468. [PMC free article] [PubMed] [Google Scholar]
- Wang L, Chen L, Walker V, Jacob TJ. Antisense to MDR1 mRNA reduces P-glycoprotein expression, swelling-activated CL− current and volume regulation in bovine ciliary epithelial cells. J Physiol. 1998;511:33–44. doi: 10.1111/j.1469-7793.1998.033bi.x. [DOI] [PMC free article] [PubMed] [Google Scholar]
- Waugh MG, Chu KM, Clayton EL, Minogue S, Hsuan JJ. Detergent-free isolation and characterization of cholesterol-rich membrane domains from trans-Golgi network vesicles. J Lipid Res. 2011;52:582–589. doi: 10.1194/jlr.D012807. [DOI] [PMC free article] [PubMed] [Google Scholar]
- Yao Y, Hong S, Zhou H, Yuan T, Zeng R, Liao K. The differential protein and lipid compositions of noncaveolar lipid microdomains and caveolae. Cell Res. 2009;19:497–506. doi: 10.1038/cr.2009.27. [DOI] [PubMed] [Google Scholar]