

Abstract
Action inhibition can globally prevent all motor output or selectively cancel specific actions during concurrent motor output. Here we examine the behavioral and neural basis of selective inhibition focusing on the role of preparation. In 18 healthy human participants we manipulated the extent to which they could prepare for selective inhibition by providing or withholding information on what actions might need to be stopped. We show that, on average, information improves both speed and selectivity of inhibition. Functional magnetic resonance imaging data show that preparation for selective inhibition engages the inferior frontal gyrus, supplementary motor area, and striatum. Examining interindividual differences, we find the benefit of proactive control to speed and selectivity of inhibition trade off against each other, such that an improvement in stopping speed leads to a deterioration of selectivity of inhibition, and vice versa. This trade-off is implemented through engagement of the dorsolateral prefrontal cortex and putamen. Our results suggest proactive selective inhibition is implemented within frontostriatal structures, and we provide evidence that a speed-selectivity trade-off might underlie a range of findings reported previously.
Introduction
The prefrontal cortex is thought to represent goals that are subsequently imposed on the motor system (Koechlin et al., 2003). Such executive control also involves the inhibition of actions that are misaligned with current goals, for example, when overriding habits or impulsive responses (Isoda and Hikosaka, 2011). Failures of executive control, and in particular its expression during inhibition, are thought to be common in disorders such as addiction (Ersche et al., 2012) and attention deficit hyperactivity disorder (Casey et al., 1997).
Response inhibition is often studied using the stop-signal task (SST), which requires the inhibition of an action following an unpredictable stop signal (Logan et al., 1984). This type of inhibition has been referred to as “global” because all actions are inhibited, and “reactive” because no information is used to prepare for inhibition (Aron and Verbruggen, 2008).
The antipodes of reactive and global inhibition are proactive and selective inhibition, respectively (Aron, 2011). “Proactive” refers to the use of information from the environment that helps prepare an upcoming stop response. “Selective” refers to the inhibition of only a subset of all ongoing actions. When selective inhibition is executed without preparation, i.e., reactively, it causes interference with all ongoing actions (Coxon et al., 2007, 2009; Aron and Verbruggen, 2008). This suggests inhibition is implemented by a global “brake” followed by reinitiation of the remaining action. One framework suggests such a global stop involves the subthalamic nucleus (STN) in the hyperdirect pathway, whereas selective inhibition engages a more action-specific indirect pathway of the basal ganglia (Aron, 2011). However, others have found that the inferior frontal gyrus (IFG), supplementary motor area (SMA)/pre-SMA, and entire basal ganglia are involved in preparing for global inhibition (Chikazoe et al., 2009; Jahfari et al., 2012; Zandbelt et al., 2013).
Behavioral and transcranial magnetic stimulation studies have shown that preparation reduces interference between the inhibitory process and the remaining actions, potentially mediated by selective suppression of action representations in primary motor cortex (Aron and Verbruggen, 2008; Mars et al., 2009; Claffey et al., 2010; Neubert et al., 2010; Cai et al., 2011; Majid et al., 2012, 2013). However, there is to our knowledge no characterization of the full neural network underlying prepared versus unprepared selective inhibition. Such data might extend models of inhibition beyond a current emphasis on reactive global inhibition (Aron, 2011; Schall and Godlove, 2012).
We investigated proactive selective inhibition in healthy human adults by manipulating the information provided about the potential stop target. We hypothesized that preparation would reduce interference caused by an inhibitory process upon the remaining response, and such an improvement in selectivity might lead to a deterioration in the speed of inhibition, essentially posing a speed-selectivity trade-off in inhibition (Aron and Verbruggen, 2008). An existing framework predicts such an improvement in selectivity, rather than speed, reflects greater engagement of an indirect relative to hyperdirect basal ganglia pathway, and involvement of dorsolateral prefrontal cortex (dlPFC) rather than right IFG (rIFG; Aron, 2011). Thus, this model predicts that proactive selective inhibition will engage striatum and dlPFC, but not STN and rIFG (Aron, 2011).
Materials and Methods
Participants.
Nineteen healthy adults participated in the experiment. We excluded one participant because a brain mask could not be created for all functional scans due to movement in the scanner, leaving 18 participants for further analysis (11 females; age range 19–25 years; mean = 21.2, SD = 2.1 years). Fifteen participants were classified as right-handed and three as ambidextrous (Oldfield, 1971). All participants had normal or corrected-to-normal vision, no history of psychiatric or neurological disorder, and provided written informed consent for the experiment, which was approved by the Research Ethics Committee at University College London, UK.
Experimental design.
We modified a task previously used to study prepared and unprepared selective action inhibition (Aron and Verbruggen, 2008; Fig. 1). In brief, on each trial participants responded to a Go signal with either both middle or both index fingers, depending on whether the top or bottom circles displayed on a screen were filled, respectively. On some trials a red cross was presented over one of the two filled circles of the Go signal after a stop-signal delay (SSD). The stop signal indicated that the response with the corresponding finger should be withheld, whereas the other finger should still press down as fast as possible.
Figure 1.

Proactive selective inhibition task. The task was designed to study the influence of prior information about inhibition targets on behavior and neural responses. Responses were made using both index or middle fingers, the four circles on the screen corresponding to fingers on a keypad as indicated by the lower left inset. At the start of each trial faded red crosses cued the participant about the potential locations of a stop signal. In the Informed condition this would be either both the left or right circles (left or right hand, respectively), in the Uninformed condition the stop signal could appear over any of the four circles, and in the noStop condition there would never be a stop signal. After a jittered anticipation period a Go cue was presented, comprised of four circles with either the top or bottom two filled. The fingers corresponding to the filled circles had to press down as fast as possible. In the Informed and Uninformed condition a stop signal was presented on 30% of trials after a staircased stop-signal delay. The location of the stop signal always followed the restrictions set by the cue (i.e., the cued side in Informed condition, or either side in Uninformed condition). Participants had to stop the finger corresponding to the stop signal, but still go with the finger corresponding to the filled circle without the stop signal. No feedback was provided.
To specifically study preparation for selective inhibition each Go signal was preceded by one of four cues showing the potential locations of the stop signal for that trial. In the Uninformed condition the cue indicated the stop signal could appear anywhere by showing faded red crosses over all four circles, precluding participants from setting up a selective inhibitory representation. In the Informed condition the cue indicated that the stop signal could only appear on the left or only on the right by showing faded red crosses only over the left or right circles, respectively. Previous work has shown that participants use such cues to set up an inhibitory process specific to the actions that need to be inhibited (Claffey et al., 2010; Majid et al., 2012). In both Uninformed and Informed conditions the overall probability of a stop signal occurring was 30%. To balance the factor of Information (with levels Uninformed and Informed), 40% of trials were Uninformed, 20% of trials Informed-left, and 20% of trials Informed-right. The remaining 20% of trials were noStop trials: the cue consisted of four filled white circles with no faded red crosses, indicating that no stop signal would be presented on that trial. This control condition can reveal strategic slowing (Jahfari et al., 2012), but was not used in the imaging analysis as their frequency was not matched with the Information conditions. The design was fully counterbalanced over index and middle fingers.
Trial timings took the following form: the cue was presented for 1 s, followed by 1, 2, or 3 s of anticipation (intervals with probability 0.4, 0.2, and 0.4, respectively). The Go signal appeared on the screen for 1 s, and in 30% of trials was overlaid by a stop signal after an SSD. The Go stimulus remained on the screen for 1 s regardless of button presses, after which a 2 s intertrial interval (ITI) started. No feedback was provided.
Participants completed 100 trials per block (10 min) in the scanner, for four blocks during one session. Participants were then taken from the scanner and given 45–90 min of rest. During this time they were asked to wait in a waiting room and we provided no feedback on their performance. They then underwent another four blocks for a total of 800 trials per participant (>80 min of functional imaging). This yields 96 stop trials in both the Uninformed and Informed condition, in line with the number of stop trials in previous studies using the SST (Aron and Poldrack, 2006; Li et al., 2006; Chikazoe et al., 2009). Trial order was randomized for every block.
We used four independent SSD staircases, one for each of the cue-stop signal combinations (Uninformed left stop, Uninformed right stop, Informed left stop, Informed right stop). The SSD became longer after a successful stop, and shorter after a failed stop, in 50 ms steps. This tracking procedure yields a p(stopSuccess) of ∼0.5, which is optimal for estimation of the stop-signal reaction time (SSRT; Verbruggen and Logan, 2009b; Congdon et al., 2012; see below). The staircases started at values determined during a training session 1–7 d before the scanning session.
During that training session, the participant first learned how to respond to Go cues (10 trials) and stop signals (20 trials), and then performed two blocks of 100 trials on the full task. Trial-by-trial feedback up until halfway through the first full training block aided instruction. Feedback consisted of success and error messages and a warning when the left and right buttons on Go trials were pressed >70 ms apart (asynchronous response). The four SSD staircases started off at 100 ms for the last full block, and the participant's last SSD in each staircase became the starting SSD for the scanning session. We instructed participants to use the cue to prepare for the Go signal, and explained it would be impossible to stop every time the stop signal appeared. We also emphasized that responding fast would be more important than correctly stopping on every stop trial. These instructions aim to prevent a “waiting” strategy, which invalidates assumptions of the horse race model used to calculate the SSRT (Logan, 1994).
This experiment was realized using Cogent 2000 developed by the Cogent 2000 team at the Wellcome Trust Centre for Neuroimaging and the Institute of Cognitive Neuroscience, and John Romaya developed Cogent Graphics at the Laboratory of Neurobiology at the Wellcome Department of Imaging Neuroscience.
Behavioral data analysis.
Our analyses followed recommendations from the literature (Logan, 1994; Band et al., 2003; Verbruggen and Logan, 2009b; Congdon et al., 2012). We excluded participants if p(stop) for any of the four SSD staircases was lower than 0.25, or larger than 0.75, and if the proportion of correct Go trials (cued fingers pressed down within 70 ms of each other) following any of the four cues was <0.7. All 18 participants passed these criteria. We further computed, for each condition, measures of the Go distribution and number of errors. To validate assumptions of the independent race model we computed stopFail reactive time (RT) as a function of SSD, and z-scored relative finishing time (ZRFT) calculated as (Gomean − SSD − SSRT)/GoSD, evaluated at SSDs of 150–500 ms in 50 ms steps (Logan et al., 1984; Verbruggen and Logan, 2009b).
Two key behavioral measures characterizing stopping in this task are (1) the SSRT, which represents the speed of inhibition, and (2) interference, which represents the inverse selectivity of inhibition. We computed SSRT using the quantile method (Band et al., 2003; Congdon et al., 2012). For each condition (Informed left, Informed right, Uninformed) all Go RTs were arranged in descending order. The RT corresponding to the participant's probability of successfully stopping in that condition was selected (e.g., for a p(stop) of 0.45 we selected the RT 45% down the ordered list), and we subtracted the mean SSD to yield the SSRT. SSRT in the Informed condition was averaged across left and right cues as an estimate of the time it takes for the participant to inhibit an upcoming motor response after presentation of the stop signal.
We calculated interference of inhibition, or inverse selectivity, as RT on stopSuccess trials − RT on Go trials for each condition separately (Aron and Verbruggen, 2008). Recall that in all stop trials, participants had to stop one finger and still press down with the other as fast as possible. A positive value in this measure of interference indicates that responses were slower when the participant had to stop a finger compared with Go trials. Interference in the Informed condition was averaged across left and right cues. We then compared these values across conditions to observe changes in interference, i.e., selectivity, with experimental condition.
We observed that the benefit of Information on SSRT and interference trade off, such that participants seem to focus on improving either speed or selectivity of inhibition, but not both. We therefore computed a measure of this trade-off as (SSRTUninformed − SSRTInformed) − (InterferenceUninformed − InterferenceInformed). This means that a high trade-off represents a focus on improvement of SSRT with Information, whereas a low value represents a focus on improvement of interference (i.e., selectivity) with Information. Furthermore, we observed that the trade-off is not static over time (see Results; correlation between trade-off in first half vs second half of experiment, r = −10, p = 0.68), suggesting use of information to prepare selective inhibition is not necessarily homogenous across the entire duration of an experiment. To characterize the brain correlates of this fluctuating use of information for proactive selective inhibition we calculated the magnitude of the trade-off for each trial t and used it as a parametric modulator in the functional magnetic resonance imaging (fMRI) analysis. This trial-by-trial trade-off estimate was calculated using a running average from RT data from trial t − 75 to t + 75 (i.e., sliding window of 150 trial width). For trial 1–75, the window spanned [1 t + 75], and for trial 725–800 the window spanned [t − 75 800]. Although a smaller width would provide a more fine-grained estimate of the trade-off, this has to be balanced against the number of data points used to calculate the interference and SSRT. With a window size of 150 trials, each Information condition contains 18 stop trials in each window on average, which is sufficient for reliable estimation of the SSRT (Congdon et al., 2012). Using this dynamic measure we could then interrogate neural signatures of this trade-off as expressed during Go and Stop trials in the task.
Behavioral analyses were performed in MATLAB (Mathworks) and SPSS 19 (IBM). We used two-tailed permutation tests with 104 draws for paired tests (or 107 draws for p values < 0.001), ANOVAs to test for interactions, and one-sample t tests to compare outcomes to zero.
MRI data acquisition and preprocessing.
We performed MRI on a 3 T Siemens Trio magnetic resonance scanner. Functional data were acquired over eight runs, each run consisting of 208 whole-brain 3D echoplanar imaging (EPI) volumes (spatial resolution = 2.3 × 2.3 × 2.3 mm3; 80 slices; echo time (TE) = 32.84 ms; volume repetition time (TR) = 2.96 s; Lutti et al., 2013). Parallel imaging (GRAPPA image reconstruction; Griswold et al., 2002, acceleration factor 2 along the partition-encoding direction) was used to speed up the acquisition of each image volume. Acquisition of dummy volumes to allow for longitudinal magnetization to reach steady-state and of the GRAPPA reconstruction kernel was implemented before the acquisition of image data. We acquired B0 field maps for each session using a double-echo FLASH sequence (matrix size = 64 × 64; 64 slices; spatial resolution = 3 × 3 × 3 mm3; gap = 1 mm; short TE = 10 ms; long TE = 12.46 ms; TR = 1020 ms) to correct EPI images for distortion in the B0 field (Weiskopf et al., 2006). Field maps were estimated from the phase difference between the short and long TE using the FieldMap toolbox for SPM (Hutton et al., 2002). Cardiac rate was recorded using an MRI-compatible pulse oximeter (Model 8600 F0; Nonin Medical), and respiration was monitored using a pneumatic belt positioned around the abdomen. We processed these data as described in the literature (Hutton et al., 2011) and included them as regressors of no interest in all first-level general linear models (GLMs; see below). We acquired proton density (PD)-weighted, T1-weighted, and magnetization transfer (MT)-weighted images at 1 × 1 × 1 mm3 resolution for each participant using multi-echo 3D FLASH (Helms et al., 2008). Fully quantitative maps of the MR parameters MT, R1, PD, and R2* were extracted from the acquired data as described previously (Helms et al., 2008). A B1 map was acquired using a 3D SE/STE EPI method (Lutti et al., 2012) to correct for the effects of inhomogeneous radiofrequency excitation on the quantitative maps.
We analyzed the MRI data in SPM8 (Wellcome Trust Centre for Neuroimaging, University College London; www.fil.ion.ucl.ac.uk/spm). Functional images were corrected for signal bias at low spatial frequencies, realigned to the first functional image, distortion corrected using the B0 distortion maps, coregistered to the MT structural image (which has superior subcortical performance in white and gray matter segmentation compared with T1-weighted images; Helms et al., 2009), and normalized to Montreal Neurology Institute (MNI) space using transformation parameters from unified segmentation of the MT image. Functional data were smoothed using either a 4 mm or 10 mm full-width at half-maximum Gaussian kernel. We used two smoothing levels to optimize sensitivity to widespread activations as well as focused subcortical activations in, e.g., pallidum and STN. The time series for each voxel were high-pass filtered at a cutoff of 128 s and whitened using an AR(1) model following standard preprocessing procedures.
fMRI data analysis.
The preprocessed images were analyzed in an event-related design using a GLM with 15 explanatory variables (EVs) of interest. We modeled 12 EVs as stick regressors at time of Information cue onset. Of these, four EVs described correct Go trials (Uninformed, Informed left, Informed right, noStop), and eight EVs described stop trials, crossing information (Uninformed, Informed), stop-signal side (left, right), and outcome (stopSuccess or stopFail). A further three regressors were added at the time of the imperative cue (i.e., the go signal): one for all Go trials, one for all stopSuccess trials, and one for all stopFail trials. As all these imperative cues are identical between Information conditions, we did not separately model the information regressors at the imperative cue. As such, the 12 regressors modeled at the time of the precue capture blood oxygenation level-dependent (BOLD) changes during both the anticipation epoch and the action execution epoch. We opted for a fast event-related design with a large number of trials, foregoing the opportunity to dissociate activity from these two epochs in each trial.
As described previously we obtained a measure of the speed-selectivity trade-off, i.e., the extent to which the participant uses Information to improve the speed or selectivity of inhibition for each trial. We hypothesized that a focus on speeded inhibition would result in a differential engagement of a stopping network compared with a focus on selective inhibition (Aron, 2011). We modeled the trade-off as a parametric modulator on the stick events of each of the 12 regressors at the time of precue, allowing us to examine how each of these events was modulated by the speed-selectivity trade-off. We decided to test for effects of trade-off on Go trials as well as Stop trials in view of the fact that the trade-off is a dynamic state measure, such that participants focus relatively more on speed or selectivity across trials. Although such focus only manifests on stop trials, the participant cannot dissociate stop from go trials until the stop signal is presented. Thus, it can be reasonably expected that changes in trade-off are also reflected in proactive control during Go trials. We added the following nuisance regressors: two regressors for error trials with or without a response; 6 movement regressors produced by the realignment procedure; 14 physiological regressors for cardiac and respiratory variables (Hutton et al., 2011); and 7 block regressors covering run 1–7, respectively. The eighth block was subsumed in the constant of the design matrix. The GLM thus contained a total of 57 regressors over 1664 volumes per participant, and each GLM was estimated separately for each participant for the 4 and 10 mm smoothed images. All EVs (but not physiological regressors) were convolved with a canonical hemodynamic response function (Friston et al., 1995).
Our primary interest was a comparison of Go trials between Uninformed and Informed conditions. Such a contrast elucidates the implementation of proactive control without contamination by the execution of stops as both conditions are equal in terms of motor execution. Furthermore these trials are matched for (violations of) expectations related to stop-signal probability (Zandbelt et al., 2013). To obtain group statistics each participant's contrast image was entered into a second-level random-effects analysis using one-sample t tests across participants. We used 10 mm smoothed images for whole-brain analyses, and corrected for multiple comparisons with cluster-level correction at p < 0.05 (initial threshold at p < 0.001 uncorrected). We further used a region of interest (ROI) approach to examine four areas for which we had strong a priori hypotheses regarding their involvement in proactive selective control (Aron, 2011; Jahfari et al., 2012; Zandbelt et al., 2013): the right STN (unthresholded probabilistic ROI as created previously Forstmann et al., 2012) and the right caudate, right putamen, and right pallidum from the Automated Anatomical Labeling (AAL) atlas. We chose right-lateralized ROIs based on previous work (Jahfari et al., 2012).
For analysis of the parametric modulators we used a similar approach. First we used a whole-brain analysis at cluster-level corrected p < 0.05 (initial threshold at p < 0.001 uncorrected). Second, we extracted parameter estimates from functional ROIs resulting from the Informed > Uninformed Go contrast at 4 mm smoothing, thresholded at p < 0.01 uncorrected, and masked by anatomical ROIs. In addition to the anatomical ROIs described above, we also examined the right IFG (as defined by inferior operculum in the AAL atlas) and left SMA/pre-SMA from the AAL atlas (Tzourio-Mazoyer et al., 2002). These two regions were included based on their activation in Informed versus Uninformed Go trials (see Fig. 5). In all cases where parameter estimates were extracted from ROIs we used MarsBar (Brett et al., 2002) on the 4 mm smoothed images to minimize inclusion of signal not originating from the ROI itself.
Figure 5.

Informed > Uninformed Go trials. We observed stronger BOLD response to Informed compared with Uninformed Go trials in bilateral PMd, left SMA/pre-SMA, right IFG, and bilateral parietal structures. All maps were thresholded at p < 0.001 uncorrected (shown here for illustration purposes) and statistical significance was assessed at p < 0.05 cluster-level corrected threshold. Results were projected on coronal slices of the MNI 152T1 template (left = left) using xjView (www.alivelearn.net/xjview). We extracted β coefficients for the Informed and Uninformed Go regressors from four anatomical ROIs and performed pairwise permutation tests. The putamen and pallidum showed significantly stronger responses during Informed compared with Uninformed Go trials, whereas the STN and caudate showed no such effect. The coefficients are mean centered for each participant for visualization purposes. The axial slice was taken from the “ch2” template in MRIcron (left = left; Rorden and Brett, 2000). Error bars indicate SEM. a.u., arbitrary units.
Results
Accuracy and SSD staircase procedure
Go trials were matched between the Uninformed and Informed condition for overall accuracy (mean (SD) proportion correct Go trials: Uninformed = 0.87 (0.01), Informed = 0.86 (0.01), noStop = 0.87 (0.01); Uninformed vs Informed, p = 0.39). The SSD staircase procedure ensured p(stop) remained close to 0.50 for both Information conditions. We observed a small, but significant, increase in p(stop) for the Informed compared with Uninformed condition (mean (SD) p(stop): Uninformed = 0.52 (0.01), Informed = 0.53 (0.01), p = 0.01). This suggests participants gradually slowed down responses in Go trials over the course of the experiment (Logan, 1994), marginally more so during Informed compared with Uninformed trials. Note that this difference does not impact on the applicability of the race model (see below).
Previous work has emphasized that participants show a general slowing (rather than slowing over time) when faced with a potential stop versus noStop (Chikazoe et al., 2009; Verbruggen and Logan, 2009a; Jahfari et al., 2010, 2012; Zandbelt et al., 2013). In keeping with this we observed a significantly higher RT compared with noStop for both the Uninformed (p = 8.9 × 10⁻⁶) and Informed (p = 5.4 × 10⁻⁶) Go conditions consistent with such strategic slowing, but at the same time we found no evidence for a difference between Information conditions (GoUninformed vs GoInformed, p = 0.24). Participants also committed more asynchronous (two fingers > 70 ms apart) Go responses in the Informed compared with Uninformed condition (mean (SD) proportion asynchronous Go: Uninformed = 0.03 (0.005), Informed = 0.05 (0.006), noStop = 0.02 (0.005); Uninformed vs Informed, p = 0.02). An increase in asynchronous errors suggests a higher degree of lateral asymmetry in action preparation. To avoid contamination in other analyses, asynchronous responses were treated as errors and discarded from further analysis. For the remaining trials we computed the frequency of left responses leading right responses, and vice versa, for Informed-left, Informed-right, and Uninformed trials. We observed no difference in frequency of these events between Informed-left and Uninformed (χ2 test with Yates' correction, χ2 (1) = 0.06, p = 0.81) or Informed-right and Uninformed (χ2 (1) = 0.03, p = 0.86). This suggests excluding asynchronous trials successfully removed the asymmetry in action execution.
Selective inhibition satisfies independent race model assumptions
A dominant model in the inhibition literature is the independent race model (Logan et al., 1984). It is unclear, however, whether selective inhibition is accurately described by this class of model. It has been suggested that more complex models such as an interactive race model are required when assumptions of the independent race model are not met (Boucher et al., 2007; Verbruggen and Logan, 2009b; Schall and Godlove, 2012). We show that in our task, selective inhibition conforms to all assumptions of the independent race model, both for the Informed as well as the Uninformed conditions (Fig. 2).
Figure 2.

RT data satisfy race model assumptions. A, RTs were faster in stopFail trials compared with Go trials for both the Uninformed and Informed condition. We further observed that noStop trials were faster than Go trials in both Information conditions, indicative of strategic slowing. B, StopFail RT increased linearly with SSD, as predicted by the independent race model. C, The ZRFT indicates the finishing time of a Stop and Go process, with higher values indicating a late finishing time for the stop process relative to the go process. Each participant is represented by a thin gray line. A cumulative Gaussian was fit for each participant, and the bold black lines were generated by averaging parameter fits over participants. Both Uninformed (left) and Informed (right) conditions show that as ZRFT increases, the probability of stopFail increases. When the ZRFT is 0 the probability of stopSuccess and stopFail was close to 0.5, as predicted by the independent race model. Error bars indicate SEM.
Three basic conditions must be met for the independent race model to be valid. First, trials in which a stop signal occurs but the participant fails to stop (“stopFail”) should represent the fast half of the RT distribution. Thus, stopFail RTs must be faster than Go RTs within the same condition. We observed that this was the case for both the Uninformed (p = 8.5 × 10⁻⁶) and Informed (p = 9.3 × 10⁻⁶) condition (Fig. 2A). Furthermore this difference between stopFail and Go was not significantly different between Uninformed and Informed conditions (repeated-measures ANOVA interaction: F(1,17) = 1.1, p = 0.31). The second condition for the independent race model is that stopFail RTs should increase as the SSD increases due to the stop process finishing later. We observed such a linear increase in stopFail RT with SSD for both the Uninformed (Fig. 2B; linear regression for each participant, mean (SD) over population: intercept = 368 (74) ms, slope = 0.30 (0.25); one-sample t test on slope, t(17) = 5.0, p = 5.5 × 10⁻⁵) and Informed (intercept = 347 (86) ms, slope = 0.38 (0.32), t(17) = 5.2, p = 3.6 × 10⁻⁵) condition. There was no difference between the Uninformed and Informed condition in the intercept (p = 0.27) or slope (p = 0.21). Thus, stopFail RT significantly increased linearly with SSD, with no evidence for any difference between the Uninformed and Informed condition. The third condition is that the p(stopFail) should predictably change with the ZRFT of the Stop and Go process (see Materials and Methods for calculation). A negative ZRFT indicates that the stop process finished earlier than the Go process and the participant should thus have a low p(stopFail); a positive ZRFT indicates the Go process finished before the Stop process and the participant should be likely to erroneously respond, i.e., have a high p(stopFail). When the ZRFT is zero, the model predicts that both processes finished simultaneously and p(stopFail) should be 0.5.
We plot p(stopFail) as a function of ZRFT and fit a cumulative Gaussian to each participant's data individually. The bold curves in Figure 2C represent the average of each participant's fits. The mean of either bold curve was not significantly different from zero (Uninformed: one-sample t test, t(17) = 1.2, p = 0.25; Informed: t(17) < 1), nor were the means significantly different between conditions (p = 0.14). The SD of the curve was larger in the Informed than Uninformed condition (p = 0.02), indicating a significant decrease in the accuracy with which the ZRFT of the Stop and Go process predicts the outcome of the race in the Informed compared with Uninformed condition. Nonetheless, the analyses presented here confirm that selective inhibition conforms to all assumptions of the independent race model regardless of proactive control. We can then use the race model to calculate parameters for further behavioral and fMRI analyses.
Modulation of speed and selectivity of inhibition by preparation
The previous analyses show that the Informed and Uninformed condition are matched across a range of characteristics including accuracy, RTs, and strategic slowing, and that behavior in this task can be modeled using the independent race model. From this model we derived the SSRT, and found that SSRT improved with prior knowledge of the hand that needs to be stopped, i.e., when selective inhibition could be prepared (Fig. 3A; Uninformed vs Informed SSRT: p = 0.02). Preparation also improved interference, i.e., the selectivity of inhibition (Fig. 3B; Uninformed vs Informed interference: p = 0.02). Thus, at the group level, both speed and selectivity of inhibition improved with preparation. This result contrasts with a previous report showing that preparation reduces interference but paradoxically lengthens the SSRT (Aron and Verbruggen, 2008). As in the current study, the task used in the latter required participants respond to a stop signal by stopping one finger while at the same time pressing down with their other finger as fast as possible. Consequently, we asked whether these two task requirements draw on some shared resource and trade off against each other. Specifically, when participants are provided with information they may prepare for a fast stop (i.e., improved SSRT), a fast remaining response (i.e., improved interference), or both. We showed that at the group level preparation favors both speed and selectivity (Fig. 3). However, when looking at interindividual differences, we found preparation trades off speed against selectivity: the benefit of information to SSRT is negatively correlated with the benefit of information to interference (Fig. 4A; r = −0.70, p = 0.001). For example, some participants show SSRT improvements in the Informed compared with Uninformed condition, but show no improvement in interference (Fig. 4A, lower right). Other participants reduced their interference in the Informed compared with Uninformed condition, but did not improve their stopping speed (Fig. 4A, upper left). To quantify this trade-off we calculated a summary measure (SSRTUninformed − SSRTInformed) − (InterferenceUninformed − InterferenceInformed) for each participant. This trade-off is high when preparation is used to improve speed, and low when preparation is used to improve selectivity (i.e., to reduce interference).
Figure 3.

Information improves the speed and selectivity of inhibition. A, SSRT, representing the speed of inhibition, is faster in the Informed compared with Uninformed condition. B, The interference between the inhibition process and the remaining action is reduced in the Informed compared with Uninformed condition. Error bars indicate SEM.
Figure 4.

Preparation for selective inhibition trades off improvements in speed against selectivity. A, Each black dot represents a participant. We observed a negative correlation between the effect of Information on SSRT and the effect of Information on Interference: the more participants used the Informed cue to stop fast, the less they used the Informed cue to reduce interference, and vice versa. B, We calculated a relative measure of speed-selectivity trade-off as (SSRTUninformed − SSRTInformed) − (InterferenceUninformed − InterferenceInformed). However, there was no correlation between a participant's trade-off in the first compared with second session. This suggests that a single trade-off measure does not adequately describe a participant's trade-off during the entire experiment. C, Despite this instability over time, the way in which a participant's behavior changed over time was again governed by the speed-selectivity trade-off: participants that, from their first to second session, increased use of the Informed cue to stop fast decreased use of the Informed cue to stop selectively. D, To examine BOLD responses that might reflect this trade-off we calculated a trade-off measure for each trial based on RT data from a window around that trial. Each column represents a participant, each row represents a trial. A measure of trade-off over the entire experiment (top) ignores variance that is evident in trial-by-trial estimates of the trade-off (bottom).
A key observation in our study was that this trade-off measure based on the entire dataset (i.e., ∼80 min of time on task) is not necessarily fully representative of a participant's trade-off at any time point in the experiment, as shown by the lack of correlation between a participant's trade-off calculated separately for the first compared with the second half of the experiment (Fig. 4B; r = −10, p = 0.68). However, when we examined how participants changed their behavior from the first to the second half of the experiment, we again observed a speed-selectivity trade-off: those participants that improved on SSRT from the first to second half deteriorated on interference, and vice versa (Fig. 4C; r = −0.75, p = 0.0003). These results suggest the speed-selectivity trade-off is dynamic, and that an estimate of the trade-off based on a participant's entire dataset might not accurately describe the trade-off at any given point in the experiment. We therefore calculated a trade-off for each trial using a running average over RT data (see Materials and Methods for details; Fig. 4D). This dynamic measure of the speed-selectivity trade-off was then used to interrogate the neuronal data on how proactive selective control is instantiated in the brain, providing the key test to identify regions that promote slow and selective versus fast and global inhibition.
BOLD responses in Uninformed versus Informed Go trials
We first compared BOLD responses between Uninformed and Informed correct Go trials. Note any effects in this contrast can be attributed to anticipation and preparation for selective inhibition without being confounded by differences in the actual stopping process such as SSRT and interference. Moreover, behavior was matched between these Go conditions in terms of motor demands, accuracy, and RTs (Fig. 2).
We observed a number of regions that responded more strongly to an Informed compared with Uninformed cue, including the right IFG, left SMA/pre-SMA, bilateral dorsal premotor cortex (PMd), and bilateral parietal cortex (Fig. 5; p < 0.05 cluster-level corrected). To complement this voxel-based analysis, and given the strong a priori hypothesis for involvement of the right basal ganglia in response inhibition (Zandbelt and Vink, 2010; Aron, 2011; Jahfari et al., 2012), we also performed a hypothesis-driven anatomical ROI analysis (Fig. 5; α = 0.013, Bonferroni corrected for four ROIs). This showed that right putamen had a greater BOLD response to the Informed compared with the Uninformed cue (p = 0.005), with only weak evidence for involvement of the right pallidum (p = 0.02), and no significant effects observed for right STN (p = 0.08) or right caudate nucleus (p = 0.17) (Fig. 5). Together this suggests that proactive selective inhibition engages a set of regions also involved in global and reactive inhibition (Aron, 2011), with the notable exception of STN and caudate nucleus (cf. Majid et al., 2013) where we observed a null effect. We observed no clusters in the brain that responded more strongly during Uninformed compared with Informed Go trials.
Speed-selectivity trade-off in frontostriatal regions
To understand how the brain uses information to promote the speed or selectivity of stopping we used a metric of the dynamic trade-off (Fig. 4D) as parametric modulator on each of the EVs of interest. Note that the trade-off is a relative measure, such that a low trade-off could be due to slower and more selective inhibition across Informed trials, or conversely speeded and more nonselective inhibition across Uninformed trials. Thus, any brain region that promotes fast but nonselective inhibition would show a negative coefficient for Uninformed, or positive coefficient for Informed stop trials. Vice versa, regions that promote selective but slow inhibition would show a positive coefficient for Uninformed, or negative coefficient for Informed stop trials. Crucially, for either type of region, the coefficients should be different between Information conditions. Thus, a two-tailed contrast of parametric modulators Trade-offUninformed-stop versus Trade-offInformed-stop identifies the regions that putatively modulate the speed versus selectivity of inhibition. Post hoc t tests can then confirm that the coefficients are significantly different from zero. We did not observe any such effect for the parametric modulator on Go trials (data not shown), and we therefore only report findings on Uninformed versus Informed Stop trials. We combined stopSuccess and stopFail trials to sample the entire distribution of responses; they comprise the fast and slow part of the Go distribution, respectively, such that the subset of trials that falls in either category is a function of SSRT, and thus of trade-off. By selecting all stop trials we prevent a confounding effect of general RT.
We observed only one cluster that survived multiple-comparison correction in the Trade-offInformed-stop > Trade-offUninformed-stop with a peak activation at MNI coordinates [34, 30, 24] (Fig. 6A; p < 0.05 cluster-level corrected), a cluster that incorporates the middle frontal gyrus, i.e., dlPFC. We extracted parameter estimates from the significant cluster (defined at p < 0.001 uncorrected) to test whether the cluster's activity reflects the speed-selectivity trade-off during Uninformed or Informed inhibition, or both (Fig. 6A, right). Whereas the trade-off did not modulate activity during Uninformed trials (one-sample t test, t(17) < 1), the cluster was significantly positive in the Informed condition (t(17) = 3.63, p = 0.002) suggesting increased activity in this region leads to speeded but nonselective inhibition during Informed trials.
Figure 6.
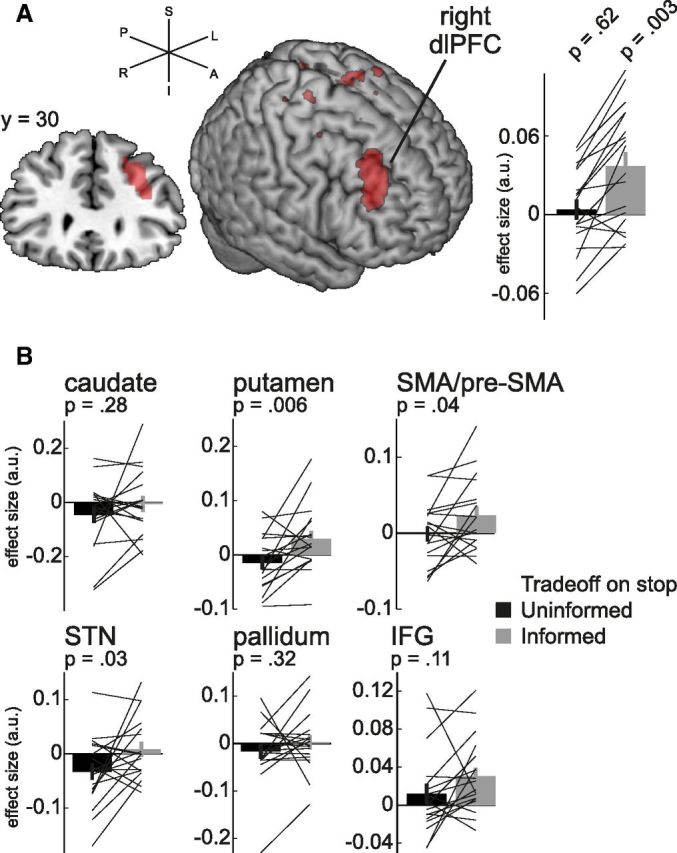
Expression of the speed-selectivity trade-off during stop trials. A, The trade-off reflects a dynamic focus on speeded or selective inhibition in Informed relative to Uninformed stop trials. We asked whether any regions modulated their activity to reflect this trade-off. Based on how we defined the trade-off (see Materials and Methods) one would predict that regions underlying speeded (but nonselective) inhibition have a negative coefficient in the Uninformed, or a positive coefficient in the Informed condition. In a whole-brain analysis we observed a cluster in the Trade-offInformed-stop > Trade-offUninformed-stop contrast corresponding to right dlPFC (left). Extraction of the coefficients showed that this cluster specifically promoted speeded (but nonselective) inhibition during Informed, but not Uninformed, inhibition (right). Results visualized in MRIcron at p < 0.001 uncorrected. B, The putamen, SMA/pre-SMA, and STN showed the same effect as the cluster in Figure 6A, linking them to speeded inhibition. Of these, the SMA/pre-SMA and putamen mediated fast inhibition only in Informed trials, whereas the STN mediated fast inhibition only in Uninformed trials. Error bars indicate SEM. a.u., arbitrary units; S, superior; I, inferior; P, posterior; L, left; R, right; A, anterior.
To further explore this effect we reasoned that the trade-off could be expressed within voxels sensitive to information in brain regions implicated in the implementation of stopping (Jahfari et al., 2011; Zandbelt et al., 2013; i.e., rIFG, SMA/pre-SMA, caudate, putamen, pallidum, STN). To test this hypothesis we built functional ROIs by thresholding the Informed > Uninformed Go contrast at p < 0.01 and constraining these to an anatomical mask of each region (see Materials and Methods for details on ROI construction). As shown in Figure 6 we found evidence for an effect of Information on the trade-off in the putamen (p = 0.006) when using Bonferroni correction for six tests (α = 0.008). A similar pattern, but only significant at uncorrected threshold of p < 0.05, was found in the right STN (p = 0.03) and left SMA/pre-SMA (p = 0.04). All three showed the signature of regions that promote speeded but nonselective inhibition. To understand in what condition each region contributed most strongly we tested the individual coefficients against zero (all one-sample t tests with 17 df) to reveal the putamen (Uninformed, t = 1.2, p = 0.25; Informed, t = 2.1, p = 0.05) and SMA/pre-SMA (Uninformed, t < 1; Informed, t = 2.0, p = 0.06) mediated speeded but nonselective inhibition, which was most pronounced when information was available. In contrast, the STN promoted speeded but nonselective inhibition only in the Uninformed condition (Uninformed, t = 2.2, p = 0.05; Informed, t < 1). We did not identify any regions that promoted selective but slow inhibition. Together, this provides tentative evidence that the speed-selectivity trade-off was driven by changes toward a focus on speed implemented by different neural structures depending on the availability of prior information: the dlPFC, the putamen, and the SMA/pre-SMA when information was available (proactive inhibition) and the STN when no information was provided (reactive inhibition).
Discussion
Our data show that participants trade off speed and selectivity in stopping when performing proactive selective inhibition, an effect implemented through engagement of dlPFC and striatum. These two regions, contrary to predictions, promote speeded rather than selective inhibition. Provision of information to prepare selective inhibition recruits a set of brain regions implicated in the implementation of inhibition, including the SMA/pre-SMA, IFG, and putamen.
A recent model of response inhibition describes action inhibition along two axes: global-selective (i.e., whether all or only a subset of actions is stopped) and reactive–proactive (i.e., the extent of preparation for inhibition; Aron, 2011). Our task examined selective inhibition in a proactive versus reactive context by providing or withholding from participants the specific information about the target of inhibition, respectively. This extends findings on global inhibition along a reactive–proactive scale (Verbruggen and Logan, 2009a; Jahfari et al., 2012; Zandbelt et al., 2013) and selective inhibition in the reactive domain (Coxon et al., 2007, 2009; Ko and Miller, 2013). In comparison to these different types of inhibition one unresolved question is whether selective inhibition is sufficiently similar to global inhibition, such that it too can be analyzed using the independent race model or might require a more elaborate interactive race model (Boucher et al., 2007; Verbruggen and Logan, 2009b; Schall and Godlove, 2012). Here we confirm that both proactive and reactive selective inhibition satisfy all assumptions of the independent race model. Given the current debate, however, it would be best to consider the validity of the independent race model on a study-by-study basis.
Applying the race model to our data, we observed proactive control improved speed (i.e., SSRT) and selectivity (i.e., interference) of inhibition compared with reactive control. This partly contrasts with results from a recent series of behavioral and transcranial magnetic stimulation studies that show preparation reduces interference, as found here, but either leads to a deterioration (Aron and Verbruggen, 2008) or does not affect (Claffey et al., 2010; Majid et al., 2012) the SSRT. These seemingly contradictory results can potentially be explained by our finding that each participant is trading off SSRT with interference (i.e., speed and selectivity). To illustrate this point, our participant cohort contains subgroups that improve in selectivity but deteriorate in SSRT (Aron and Verbruggen, 2008; Figure 4A, left top quadrant), improve on both characteristics (Fig. 4A, right top quadrant), and improve SSRT but deteriorate in selectivity (Fig. 4A, right lower quadrant). Such a trade-off suggests that global inhibition is fast whereas selective inhibition is slow. Furthermore we show that the trade-off can change over time. It is an open question what exactly drives these changes in trade-off. Previous work has shown that participants can flexibly adjust their Go versus Stopping speed to optimize rewards (Leotti and Wager, 2010), and one might expect that participants can similarly adjust their trade-off when incentivized to do so. In addition to such top-down control, experimental factors are likely to influence the speed-selectivity trade-off, such as the probability of a stop signal occurring, the dynamics of the SSD staircasing procedure, or the nature of the instructions and feedback provided to the participants. The results presented here show that this trade-off exists, and new experiments could usefully explore the factors that affect it.
Our imaging analysis tested a number of predictions from the action inhibition framework suggested previously (Aron, 2011). Briefly, the model suggests that reactive selective inhibition engages the IFG whereas proactive selective inhibition engages the dlPFC in association with the indirect pathway of the basal ganglia (but excluding the STN). However, we observed that the IFG, but not dlPFC, is more active during proactive selective control. Additionally, this form of anticipation engaged other regions previously implicated in reactive response inhibition itself, including SMA/pre-SMA and striatum. This is reminiscent of findings that stop-signal probability (a manipulator of proactive control) positively correlates with activity in this inhibition network (Jahfari et al., 2012). A notable difference with our study is that we find activity despite keeping the stop-signal probability equal between Uninformed and Informed conditions, thus preventing a confound where the rIFG responds to the violation of an expectation rather than the preparation for inhibition itself (Zandbelt et al., 2013). As such, the increase in activity is likely to reflect additional processing required for proactive selective inhibition, which might involve, for example, attentional processes or the maintenance of inhibitory set, processes that can only be uncovered by targeted experimental designs that are not suitable to test our current hypothesis (Li et al., 2006; Zandbelt and Vink, 2010). A shortcoming of our fast event-related design was that our results remain inconclusive regarding the exact component processes that each of these areas subserves (Ridderinkhof et al., 2004; Neubert et al., 2013), or how changes in activity in these areas relate to changes in performance. We also could not dissociate neural activity from the anticipation epoch from activity during the response epoch, such that the reported changes in neural activity might span either or both of these time windows. Despite these limitations our analysis shows that neural processing associated with prior information occurs within the known pathways of inhibition, which include IFG, SMA/pre-SMA, and striatum, rather than in the dlPFC as suggested previously (Aron, 2011). Further research is required to ascertain the specific timing and cognitive processes implemented within the dlPFC during proactive inhibition.
The involvement of this “classic” stopping network in proactive selective control contrasts with the absence of evidence for engagement of STN during proactive control, in line with a priori predictions (Aron, 2011). The STN has been widely implicated in the execution of global inhibition (Aron and Poldrack, 2006; Frank et al., 2007; Eagle et al., 2008) and more recently, in the preparation for global inhibition (Jahfari et al., 2012). Our results suggest that, at least with regards to preparation, the STN is not involved in selective inhibition. As noted earlier, selective inhibition might circumvent this pathway, and its associated global inhibitory effect, by inhibiting a specific motor command exclusively through the indirect pathway of the striatum (Baker et al., 2010; Aron, 2011; Majid et al., 2013). We observed that the putamen is engaged in proactive selective control, whereas we observed a null effect for the STN in the same contrast (but note this null effect does not prove a lack of involvement). Regarding the striatum, we present evidence for involvement of the putamen, but not caudate nucleus, whereas we note other recent work has implicated both structures in proactive selective control (Majid et al., 2013). Given that the putamen, more so than the caudate, is a fundamental component of a basal ganglia motor loop (Alexander et al., 1986), we suggest that the putamen plays a pivotal role in implementing selective response inhibition. A closer inspection of the electrophysiology of the striatum might provide insights into the differential roles of putamen and caudate nucleus (as in Schmidt et al., 2013).
Activation within right dlPFC and right putamen most strongly reflected a speed-selectivity trade-off during stop trials: activations in these regions positively correlated with a focus on speeded rather than selective inhibition when information about which response to inhibit was available. This finding suggests that the dlPFC, together with the striatum, processes available information to prioritize and prepare the speed of inhibition for an action. This role of the dlPFC in setting and prioritizing among future action goals resonates with recent findings suggesting that speed-accuracy trade-off (SAT) often observed in perception and action (Schouten and Bekker, 1967) is resolved within frontobasal ganglia pathways (Forstmann et al., 2008; van Veen et al., 2008; Bogacz et al., 2010). Specifically, activity in the dlPFC and basal ganglia positively correlates with a focus on speeded rather than accurate responses. Note, however, these two types of trade-off are not identical: we find that Information affects the speed and selectivity of inhibition, but not the RT or accuracy of responses. However, similar to the SAT (van Veen et al., 2008) it might be a change in baseline firing rate that governs whether participants emphasize one or the other. These findings implicate dlPFC and striatum in selective inhibition as suggested by the Aron model, but it also suggests a refinement in which the putamen and dlPFC are more, rather than less, active when focusing on speed over selectivity. On the other hand, our data suggest that the STN is engaged when fast inhibition is prioritized over selectivity when no information is provided. In these circumstances selective stopping could not be prepared and had to be executed on line. These findings are compatible with the notion that the STN is engaged in fast but nonselective inhibition (Coxon et al., 2009).
Our finding that frontostriatal circuits mediate proactive control raises a number of questions. First, activity in frontostriatal circuits associated with proactive control might reflect either targeted inhibition or enhancement of specific actions. For example, low interference in this task could be caused by inhibition of the action that needs to be stopped, or enhancement of the actions that still need to be executed. These functions might be subserved by indirect and direct pathways, respectively, but disentangling these different neuronal populations in human fMRI is a major challenge due to their likely anatomical overlap (Gerfen and Surmeier, 2011). In fact recent evidence indicates that the direct and indirect pathway are simultaneously active during action initiation, thus suggesting their concurrent activation is required for an execution of a complex motor plan (Cui et al., 2013). Second, fMRI is not well suited to understanding the temporal dynamics of proactive control, which needs to be informed by stimulation studies (Mars et al., 2009; Neubert et al., 2010) and electrophysiological recordings (Isoda and Hikosaka, 2008, 2011).
A recent surge of interest in response inhibition that goes beyond all-out, reactive stopping motivated us to examine the role of preparation in selective inhibition. Our data reveal that the opportunity to prepare for inhibition poses a trade-off between either faster or more selective inhibition. This trade-off is expressed in frontostriatal structures commonly associated with the preparation for, and execution of, response inhibition and allows adjustments of behavior mandated by current context.
Footnotes
This work was supported by the Wellcome Trust (4 year PhD Grant to P.S., 092859/Z/10/Z; Senior Investigator Award to R.J.D., 098362/Z/12/Z; and the Wellcome Trust Centre for Neuroimaging is supported by core funding from the Wellcome Trust 091593/Z/10/Z) and a Max Planck Award (R.J.D. and M.G.-M.). We are grateful to B. Forstmann and S. Jahfari for providing region of interest masks.
The authors declare no competing financial interests.
References
- Alexander GE, DeLong MR, Strick PL. Parallel organization of functionally segregated circuits linking basal ganglia and cortex. Annu Rev Neurosci. 1986;9:357–381. doi: 10.1146/annurev.ne.09.030186.002041. [DOI] [PubMed] [Google Scholar]
- Aron AR. From reactive to proactive and selective control: developing a richer model for stopping inappropriate responses. Biol Psychiatry. 2011;69:e55–68. doi: 10.1016/j.biopsych.2010.07.024. [DOI] [PMC free article] [PubMed] [Google Scholar]
- Aron AR, Poldrack RA. Cortical and subcortical contributions to Stop signal response inhibition: role of the subthalamic nucleus. J Neurosci. 2006;26:2424–2433. doi: 10.1523/JNEUROSCI.4682-05.2006. [DOI] [PMC free article] [PubMed] [Google Scholar]
- Aron AR, Verbruggen F. Stop the presses: dissociating a selective from a global mechanism for stopping. Psychol Sci. 2008;19:1146–1153. doi: 10.1111/j.1467-9280.2008.02216.x. [DOI] [PubMed] [Google Scholar]
- Baker KB, Lee JY, Mavinkurve G, Russo GS, Walter B, DeLong MR, Bakay RA, Vitek JL. Somatotopic organization in the internal segment of the globus pallidus in Parkinson's disease. Exp Neurol. 2010;222:219–225. doi: 10.1016/j.expneurol.2009.12.030. [DOI] [PMC free article] [PubMed] [Google Scholar]
- Band GP, van der Molen MW, Logan GD. Horse-race model simulations of the stop-signal procedure. Acta Psychol. 2003;112:105–142. doi: 10.1016/S0001-6918(02)00079-3. [DOI] [PubMed] [Google Scholar]
- Bogacz R, Wagenmakers EJ, Forstmann BU, Nieuwenhuis S. The neural basis of the speed-accuracy tradeoff. Trends Neurosci. 2010;33:10–16. doi: 10.1016/j.tins.2009.09.002. [DOI] [PubMed] [Google Scholar]
- Boucher L, Palmeri TJ, Logan GD, Schall JD. Inhibitory control in mind and brain: an interactive race model of countermanding saccades. Psychol Rev. 2007;114:376–397. doi: 10.1037/0033-295X.114.2.376. [DOI] [PubMed] [Google Scholar]
- Brett M, Anton J-L, Valabregue R, Poline J-B. Region of interest analysis using the MarsBar toolbox for SPM 99. Neuroimage. 2002;16:S497. [Google Scholar]
- Cai W, Oldenkamp CL, Aron AR. A proactive mechanism for selective suppression of response tendencies. J Neurosci. 2011;31:5965–5969. doi: 10.1523/JNEUROSCI.6292-10.2011. [DOI] [PMC free article] [PubMed] [Google Scholar]
- Casey BJ, Castellanos FX, Giedd JN, Marsh WL, Hamburger SD, Schubert AB, Vauss YC, Vaituzis AC, Dickstein DP, Sarfatti SE, Rapoport JL. Implication of right frontostriatal circuitry in response inhibition and attention-deficit/hyperactivity disorder. J Am Acad Child Adolesc Psychiatry. 1997;36:374–383. doi: 10.1097/00004583-199703000-00016. [DOI] [PubMed] [Google Scholar]
- Chikazoe J, Jimura K, Hirose S, Yamashita K, Miyashita Y, Konishi S. Preparation to inhibit a response complements response inhibition during performance of a stop-signal task. J Neurosci. 2009;29:15870–15877. doi: 10.1523/JNEUROSCI.3645-09.2009. [DOI] [PMC free article] [PubMed] [Google Scholar]
- Claffey MP, Sheldon S, Stinear CM, Verbruggen F, Aron AR. Having a goal to stop action is associated with advance control of specific motor representations. Neuropsychologia. 2010;48:541–548. doi: 10.1016/j.neuropsychologia.2009.10.015. [DOI] [PMC free article] [PubMed] [Google Scholar]
- Congdon E, Mumford JA, Cohen JR, Galvan A, Canli T, Poldrack RA. Measurement and reliability of response inhibition. Front Psychol. 2012;3:37. doi: 10.3389/fpsyg.2012.00037. [DOI] [PMC free article] [PubMed] [Google Scholar]
- Coxon JP, Stinear CM, Byblow WD. Selective inhibition of movement. J Neurophysiol. 2007;97:2480–2489. doi: 10.1152/jn.01284.2006. [DOI] [PubMed] [Google Scholar]
- Coxon JP, Stinear CM, Byblow WD. Stop and go: the neural basis of selective movement prevention. J Cogn Neurosci. 2009;21:1193–1203. doi: 10.1162/jocn.2009.21081. [DOI] [PubMed] [Google Scholar]
- Cui G, Jun SB, Jin X, Pham MD, Vogel SS, Lovinger DM, Costa RM. Concurrent activation of striatal direct and indirect pathways during action initiation. Nature. 2013;494:238–242. doi: 10.1038/nature11846. [DOI] [PMC free article] [PubMed] [Google Scholar]
- Eagle DM, Baunez C, Hutcheson DM, Lehmann O, Shah AP, Robbins TW. Stop-signal reaction-time task performance: role of prefrontal cortex and subthalamic nucleus. Cereb Cortex. 2008;18:178–188. doi: 10.1093/cercor/bhm044. [DOI] [PubMed] [Google Scholar]
- Ersche KD, Jones PS, Williams GB, Turton AJ, Robbins TW, Bullmore ET. Abnormal brain structure implicated in stimulant drug addiction. Science. 2012;335:601–604. doi: 10.1126/science.1214463. [DOI] [PubMed] [Google Scholar]
- Forstmann BU, Dutilh G, Brown S, Neumann J, von Cramon DY, Ridderinkhof KR, Wagenmakers EJ. Striatum and pre-SMA facilitate decision-making under time pressure. Proc Natl Acad Sci U S A. 2008;105:17538–17542. doi: 10.1073/pnas.0805903105. [DOI] [PMC free article] [PubMed] [Google Scholar]
- Forstmann BU, Keuken MC, Jahfari S, Bazin PL, Neumann J, Schäfer A, Anwander A, Turner R. Cortico-subthalamic white matter tract strength predicts interindividual efficacy in stopping a motor response. Neuroimage. 2012;60:370–375. doi: 10.1016/j.neuroimage.2011.12.044. [DOI] [PubMed] [Google Scholar]
- Frank MJ, Samanta J, Moustafa AA, Sherman SJ. Hold your horses: impulsivity, deep brain stimulation, and medication in parkinsonism. Science. 2007;318:1309–1312. doi: 10.1126/science.1146157. [DOI] [PubMed] [Google Scholar]
- Friston KJ, Holmes AP, Poline JB, Grasby PJ, Williams SS, Frackowiak RS, Turner R. Analysis of fMRI time-series revisited. Neuroimage. 1995;2:45–53. doi: 10.1006/nimg.1995.1007. [DOI] [PubMed] [Google Scholar]
- Gerfen CR, Surmeier DJ. Modulation of striatal projection systems by dopamine. Annu Rev Neurosci. 2011;34:441–466. doi: 10.1146/annurev-neuro-061010-113641. [DOI] [PMC free article] [PubMed] [Google Scholar]
- Griswold MA, Jakob PM, Heidemann RM, Nittka M, Jellus V, Wang J, Kiefer B, Haase A. Generalized autocalibrating partially parallel acquisitions (GRAPPA) Magn Reson Med. 2002;47:1202–1210. doi: 10.1002/mrm.10171. [DOI] [PubMed] [Google Scholar]
- Helms G, Dathe H, Kallenberg K, Dechent P. High-resolution maps of magnetization transfer with inherent correction for RF inhomogeneity and T1 relaxation obtained from 3D FLASH MRI. Magn Reson Med. 2008;60:1396–1407. doi: 10.1002/mrm.21732. [DOI] [PubMed] [Google Scholar]
- Helms G, Draganski B, Frackowiak R, Ashburner J, Weiskopf N. Improved segmentation of deep brain grey matter structures using magnetization transfer (MT) parameter maps. Neuroimage. 2009;47:194–198. doi: 10.1016/j.neuroimage.2009.03.053. [DOI] [PMC free article] [PubMed] [Google Scholar]
- Hutton C, Bork A, Josephs O, Deichmann R, Ashburner J, Turner R. Image distortion correction in fMRI: a quantitative evaluation. Neuroimage. 2002;16:217–240. doi: 10.1006/nimg.2001.1054. [DOI] [PubMed] [Google Scholar]
- Hutton C, Josephs O, Stadler J, Featherstone E, Reid A, Speck O, Bernarding J, Weiskopf N. The impact of physiological noise correction on fMRI at 7T. Neuroimage. 2011;57:101–112. doi: 10.1016/j.neuroimage.2011.04.018. [DOI] [PMC free article] [PubMed] [Google Scholar]
- Isoda M, Hikosaka O. Role for subthalamic nucleus neurons in switching from automatic to controlled eye movement. J Neurosci. 2008;28:7209–7218. doi: 10.1523/JNEUROSCI.0487-08.2008. [DOI] [PMC free article] [PubMed] [Google Scholar]
- Isoda M, Hikosaka O. Cortico-basal ganglia mechanisms for overcoming innate, habitual and motivational behaviors. Eur J Neurosci. 2011;33:2058–2069. doi: 10.1111/j.1460-9568.2011.07698.x. [DOI] [PMC free article] [PubMed] [Google Scholar]
- Jahfari S, Stinear CM, Claffey M, Verbruggen F, Aron AR. Responding with restraint: what are the neurocognitive mechanisms? J Cogn Neurosci. 2010;22:1479–1492. doi: 10.1162/jocn.2009.21307. [DOI] [PMC free article] [PubMed] [Google Scholar]
- Jahfari S, Waldorp L, van den Wildenberg WP, Scholte HS, Ridderinkhof KR, Forstmann BU. Effective connectivity reveals important roles for both the hyperdirect (fronto-subthalamic) and the indirect (fronto-striatal-pallidal) fronto-basal ganglia pathways during response inhibition. J Neurosci. 2011;31:6891–6899. doi: 10.1523/JNEUROSCI.5253-10.2011. [DOI] [PMC free article] [PubMed] [Google Scholar]
- Jahfari S, Verbruggen F, Frank MJ, Waldorp LJ, Colzato L, Ridderinkhof KR, Forstmann BU. How preparation changes the need for top-down control of the basal ganglia when inhibiting premature actions. J Neurosci. 2012;32:10870–10878. doi: 10.1523/JNEUROSCI.0902-12.2012. [DOI] [PMC free article] [PubMed] [Google Scholar]
- Ko YT, Miller J. Signal-related contributions to stopping-interference effects in selective response inhibition. Exp Brain Res. 2013;228:205–212. doi: 10.1007/s00221-013-3552-y. [DOI] [PubMed] [Google Scholar]
- Koechlin E, Ody C, Kouneiher F. The architecture of cognitive control in the human prefrontal cortex. Science. 2003;302:1181–1185. doi: 10.1126/science.1088545. [DOI] [PubMed] [Google Scholar]
- Leotti LA, Wager TD. Motivational influences on response inhibition measures. J Exp Psychol Hum Percept. 2010;36:430–447. doi: 10.1037/a0016802. [DOI] [PMC free article] [PubMed] [Google Scholar]
- Li CS, Huang C, Constable RT, Sinha R. Imaging response inhibition in a stop-signal task: neural correlates independent of signal monitoring and post-response processing. J Neurosci. 2006;26:186–192. doi: 10.1523/JNEUROSCI.3741-05.2006. [DOI] [PMC free article] [PubMed] [Google Scholar]
- Logan GD. On the ability to inhibit thought and action: a users' guide to the stop signal paradigm. In: Dagenbach D, Carr TH, editors. Inhibitory processes in attention, memory, and language. San Diego: Academic; 1994. pp. 189–239. [Google Scholar]
- Logan GD, Cowan WB, Davis KA. On the ability to inhibit simple and choice reaction time responses: a model and a method. J Exp Psychol Hum Percept. 1984;10:276–291. doi: 10.1037/0096-1523.10.2.276. [DOI] [PubMed] [Google Scholar]
- Lutti A, Stadler J, Josephs O, Windischberger C, Speck O, Bernarding J, Hutton C, Weiskopf N. Robust and fast whole brain mapping of the RF transmit field B1 at 7T. PLoS One. 2012;7:e32379. doi: 10.1371/journal.pone.0032379. [DOI] [PMC free article] [PubMed] [Google Scholar]
- Lutti A, Thomas DL, Hutton C, Weiskopf N. High-resolution functional MRI at 3 T: 3D/2D echo-planar imaging with optimized physiological noise correction. Magn Reson Med. 2013;69:1657–1664. doi: 10.1002/mrm.24398. [DOI] [PMC free article] [PubMed] [Google Scholar]
- Majid DS, Cai W, Corey-Bloom J, Aron AR. Proactive selective response suppression is implemented via the basal ganglia. J Neurosci. 2013;33:13259–13269. doi: 10.1523/JNEUROSCI.5651-12.2013. [DOI] [PMC free article] [PubMed] [Google Scholar]
- Majid DS, Cai W, George JS, Verbruggen F, Aron AR. Transcranial magnetic stimulation reveals dissociable mechanisms for global versus selective corticomotor suppression underlying the stopping of action. Cereb Cortex. 2012;22:363–371. doi: 10.1093/cercor/bhr112. [DOI] [PMC free article] [PubMed] [Google Scholar]
- Mars RB, Klein MC, Neubert FX, Olivier E, Buch ER, Boorman ED, Rushworth MF. Short-latency influence of medial frontal cortex on primary motor cortex during action selection under conflict. J Neurosci. 2009;29:6926–6931. doi: 10.1523/JNEUROSCI.1396-09.2009. [DOI] [PMC free article] [PubMed] [Google Scholar]
- Neubert FX, Mars RB, Buch ER, Olivier E, Rushworth MF. Cortical and subcortical interactions during action reprogramming and their related white matter pathways. Proc Natl Acad Sci U S A. 2010;107:13240–13245. doi: 10.1073/pnas.1000674107. [DOI] [PMC free article] [PubMed] [Google Scholar]
- Neubert F-X, Mars RB, Rushworth MF. Is there an inferior frontal cortical network for cognitive control and inhibition? In: Stuss DT, Knight RT, editors. Principles of frontal lobe function. Ed 2. Oxford: Oxford UP; 2013. pp. 332–352. [Google Scholar]
- Oldfield RC. The assessment and analysis of handedness: the Edinburgh inventory. Neuropsychologia. 1971;9:97–113. doi: 10.1016/0028-3932(71)90067-4. [DOI] [PubMed] [Google Scholar]
- Ridderinkhof KR, van den Wildenberg WP, Segalowitz SJ, Carter CS. Neurocognitive mechanisms of cognitive control: the role of prefrontal cortex in action selection, response inhibition, performance monitoring, and reward-based learning. Brain Cogn. 2004;56:129–140. doi: 10.1016/j.bandc.2004.09.016. [DOI] [PubMed] [Google Scholar]
- Rorden C, Brett M. Stereotaxic display of brain lesions. Behav Neurol. 2000;12:191–200. doi: 10.1155/2000/421719. [DOI] [PubMed] [Google Scholar]
- Schall JD, Godlove DC. Current advances and pressing problems in studies of stopping. Curr Opin Neurobiol. 2012;22:1012–1021. doi: 10.1016/j.conb.2012.06.002. [DOI] [PMC free article] [PubMed] [Google Scholar]
- Schmidt R, Leventhal DK, Mallet N, Chen F, Berke JD. Canceling actions involves a race between basal ganglia pathways. Nat Neurosci. 2013;16:1118–1124. doi: 10.1038/nn.3456. [DOI] [PMC free article] [PubMed] [Google Scholar]
- Schouten JF, Bekker JA. Reaction time and accuracy. Acta Psychol. 1967;27:143–153. doi: 10.1016/0001-6918(67)90054-6. [DOI] [PubMed] [Google Scholar]
- Tzourio-Mazoyer N, Landeau B, Papathanassiou D, Crivello F, Etard O, Delcroix N, Mazoyer B, Joliot M. Automated anatomical labeling of activations in SPM using a macroscopic anatomical parcellation of the MNI MRI single-subject brain. Neuroimage. 2002;15:273–289. doi: 10.1006/nimg.2001.0978. [DOI] [PubMed] [Google Scholar]
- van Veen V, Krug MK, Carter CS. The neural and computational basis of controlled speed-accuracy tradeoff during task performance. J Cogn Neurosci. 2008;20:1952–1965. doi: 10.1162/jocn.2008.20146. [DOI] [PubMed] [Google Scholar]
- Verbruggen F, Logan GD. Proactive adjustments of response strategies in the stop-signal paradigm. J Exp Psychol Hum Percept Perform. 2009a;35:835–854. doi: 10.1037/a0012726. [DOI] [PMC free article] [PubMed] [Google Scholar]
- Verbruggen F, Logan GD. Models of response inhibition in the stop-signal and stop-change paradigms. Neurosci Biobehav Rev. 2009b;33:647–661. doi: 10.1016/j.neubiorev.2008.08.014. [DOI] [PMC free article] [PubMed] [Google Scholar]
- Weiskopf N, Hutton C, Josephs O, Deichmann R. Optimal EPI parameters for reduction of susceptibility-induced BOLD sensitivity losses: a whole-brain analysis at 3 T and 1.5 T. Neuroimage. 2006;33:493–504. doi: 10.1016/j.neuroimage.2006.07.029. [DOI] [PubMed] [Google Scholar]
- Zandbelt BB, Vink M. On the role of the striatum in response inhibition. PLoS One. 2010;5:e13848. doi: 10.1371/journal.pone.0013848. [DOI] [PMC free article] [PubMed] [Google Scholar]
- Zandbelt BB, Bloemendaal M, Neggers SF, Kahn RS, Vink M. Expectations and violations: delineating the neural network of proactive inhibitory control. Hum Brain Mapp. 2013;34:2015–2024. doi: 10.1002/hbm.22047. [DOI] [PMC free article] [PubMed] [Google Scholar]