JNK signaling mediates metabolic stress responses caused by a high-fat diet. Vernia et al. find that mice lacking Jnk genes in the anterior pituitary gland exhibit increased pituitary expression of TSH, increased blood concentration of thyroid hormone (T4), increased energy expenditure, and reduced obesity. The increase in pituitary TSH was caused by reduced expression of type 2 iodothyronine deiodinase (Dio2). These results provide a mechanism through which JNK regulates energy expenditure and the development of obesity.
Keywords: DIO2, JNK, obesity, pituitary gland, thyroid hormone
Abstract
The cJun N-terminal kinase (JNK) signaling pathway is a key mediator of metabolic stress responses caused by consuming a high-fat diet, including the development of obesity. To test the role of JNK, we examined diet-induced obesity in mice with targeted ablation of Jnk genes in the anterior pituitary gland. These mice exhibited an increase in the pituitary expression of thyroid-stimulating hormone (TSH), an increase in the blood concentration of thyroid hormone (T4), increased energy expenditure, and markedly reduced obesity compared with control mice. The increased amount of pituitary TSH was caused by reduced expression of type 2 iodothyronine deiodinase (Dio2), a gene that is required for T4-mediated negative feedback regulation of TSH expression. These data establish a molecular mechanism that accounts for the regulation of energy expenditure and the development of obesity by the JNK signaling pathway.
Human obesity is a serious health problem that is associated with increased mortality arising from a number of complications, including cardiovascular and kidney disease, diabetes, and some forms of cancer (Flegal et al. 2013). It is therefore alarming that the worldwide incidence of human obesity is rapidly increasing (World Health Organization Consultation on Obesity 2000). The design of potential therapeutic interventions to address this problem requires knowledge of the molecular mechanisms that contribute to obesity.
The cJun N-terminal kinase signaling (JNK) pathway (Davis 2000) is implicated in the development of obesity (Sabio and Davis 2010). Indeed, obesity is associated with increased JNK activity in human omental adipose tissue (Bashan et al. 2007). Obesity-induced JNK activation is mediated, in part, by free fatty acids (FFAs) that activate the mixed-lineage protein kinase pathway (Jaeschke and Davis 2007; Gadang et al. 2013; Kant et al. 2013). The mechanism of FFA signaling may involve G-protein-coupled receptors (Talukdar et al. 2011) or nonreceptor mechanisms (Holzer et al. 2011) that cause activation of the tyrosine kinase Src in lipid raft domains of the plasma membrane (Holzer et al. 2011).
Hyperphagic and high-fat diet (HFD) models of obesity in mice demonstrate activation of the JNK pathway (Hirosumi et al. 2002). Importantly, JNK deficiency prevents the development of obesity in these mouse models (Hirosumi et al. 2002). Tissue-specific gene ablation studies indicate that JNK in peripheral tissues (adipose tissue, liver, muscle, and myeloid cells) does not influence obesity development (Sabio et al. 2008, 2009, 2010b; Han et al. 2013). In contrast, a central function of JNK is required for obesity development (Sabio and Davis 2010). Studies using mice with Nestin-cre-mediated ablation of floxed Jnk1 in the brain demonstrate that JNK deficiency causes increased energy expenditure that prevents obesity (Belgardt et al. 2010; Sabio et al. 2010a). This analysis indicates that JNK-mediated suppression of energy expenditure is critically required for obesity development (Sabio and Davis 2010).
The mechanism of JNK-mediated regulation of energy expenditure is unclear. The hypothalamic–pituitary–thyroid (HPT) hormone axis has been implicated in the JNK-mediated energy expenditure response (Sabio and Davis 2010). However, relevant molecular targets of the JNK signaling pathway have not been described. Here we identify the type 2 iodothyronine deiodinase (Dio2) gene as a target of JNK signaling that negatively regulates the HPT axis. We show that consuming a HFD causes JNK activation, increased Dio2 gene expression, and decreased HPT axis-mediated energy expenditure. JNK inhibition prevents DIO2-mediated negative feedback regulation of the HPT axis, increases energy expenditure, and reduces obesity. Together, these data identify the Dio2 gene as a critical target of the JNK signaling pathway that regulates energy expenditure and obesity.
Results
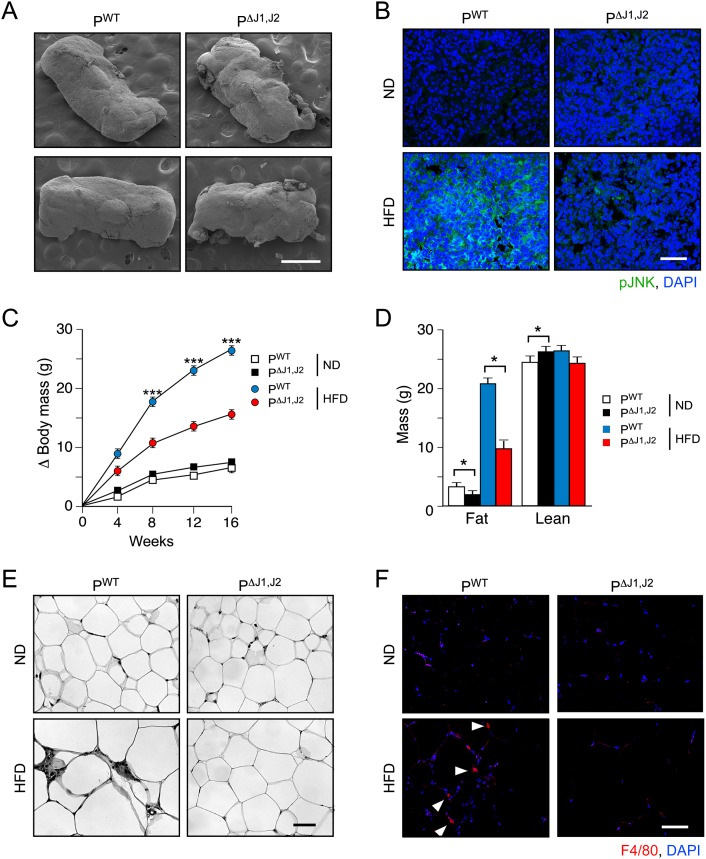
The pituitary gland is an essential component of the endocrine axis that regulates thyroid hormone signaling because it is the source of thyroid-stimulating hormone (TSH), a glycoprotein hormone that regulates the endocrine function of the thyroid gland. The potential role of the pituitary gland in JNK-mediated obesity development is intriguing. To test JNK function, we established mice with targeted ablation of the ubiquitously expressed Jnk1 and Jnk2 genes using the glycoprotein hormone α subunit (Cga) promoter to drive expression of Cre recombinase in the anterior pituitary gland. Genotype analysis demonstrated ablation of the Jnk1 and Jnk2 genes in the anterior pituitary gland of Cre+ Jnk1LoxP/LoxP Jnk2LoxP/LoxP mice (PΔJ1,J2 mice) (Supplemental Fig. S1). No defects in JNK expression in other tissues were detected (Supplemental Fig. S1). Microscopic examination of the pituitary gland demonstrated that JNK deficiency did not cause marked changes in morphology (Fig. 1A; Supplemental Fig. S2). Feeding a HFD to control mice (PWT mice) caused robust activation of JNK in the anterior pituitary gland but not in PΔJ1,J2 mice (Fig. 1B). These data establish that PΔJ1,J2 mice represent a model that can be used to test the role of HFD-induced JNK activation in the anterior pituitary gland.
Figure 1.
JNK in the anterior pituitary gland is required for HFD-induced obesity. (A) The morphology of the pituitary gland of PWT and PΔJ1,J2 mice was examined by scanning electron microscopy. Bar, 500 μm. (B) Sections of the anterior pituitary gland of PWT and PΔJ1,J2 mice were stained with an antibody to phosphoJNK. DNA was stained with DAPI. The effect of feeding mice an ND or a HFD for 16 wk was examined. Bar, 50 μm. (C) The total body mass gain of ND-fed and HFD-fed mice was examined (mean ± SEM; n = 10∼25). Significant differences between PWT and PΔJ1,J2 mice were detected. (***) P < 0.001. (D) The fat and lean mass of ND-fed and HFD-fed (16 wk) mice were measured by 1H-MRS analysis (mean ± SEM; n = 8∼10). Significant differences between PWT and PΔJ1,J2 mice were detected. (*) P < 0.05. (E,F) Sections of epididymal adipose tissue of ND-fed and HFD-fed (16 wk) mice were stained with hematoxylin and eosin (E) or an antibody to the macrophage marker F4/80 plus DAPI (F). Bar, 125 μm.
JNK in the anterior pituitary gland promotes obesity and insulin resistance
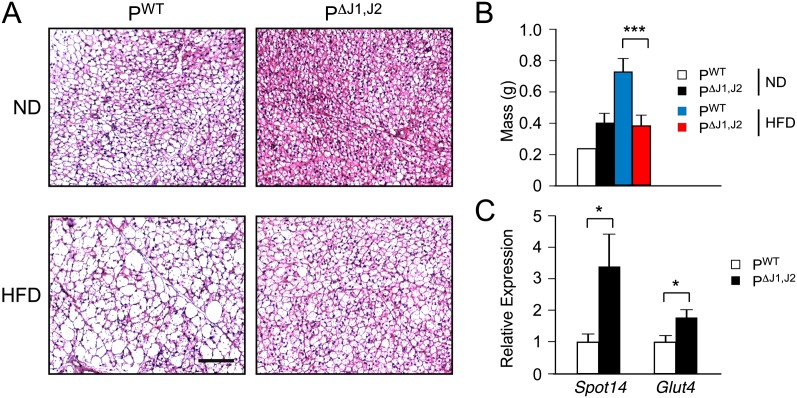
We examined the body mass of PWT and PΔJ1,J2 mice when fed a normal chow diet (ND) or a HFD for 16 wk. No significant difference in total body mass was detected in ND-fed mice, but the JNK-deficient mice exhibited markedly decreased body mass compared with PWT mice when fed a HFD (Fig. 1C). These changes in body mass were not associated with changes in body length (Supplemental Fig. 1B). The decreased body mass was largely accounted for by reduced fat mass (Fig. 1D). Adipokine expression (Supplemental Fig. S3B), adipocyte hypertrophy (Fig. 1E; Supplemental Fig. S3A), and adipose tissue infiltration by macrophages (Fig. 1E,F; Supplemental Fig. S3C) were suppressed in HFD-fed PΔJ1,J2 mice compared with HFD-fed PWT mice. JNK deficiency in the anterior pituitary gland also suppressed HFD-induced hepatic steatosis (Supplemental Fig. S4) and brown fat cell hypertrophy (Fig. 2A). Indeed, brown fat mass in HFD-fed mice was significantly reduced in PΔJ1,J2 mice compared with PWT mice (Fig. 2B). Together, these data implicate HFD-induced JNK activation in the anterior pituitary gland (Fig. 1B) as a signaling mechanism that controls the development of obesity (Fig. 1C).
Figure 2.
JNK in the anterior pituitary gland promotes HFD-induced hypertrophy of brown adipose tissue. (A) PWT and PΔJ1,J2 mice were fed an ND or a HFD (16 wk). Sections of interscapular brown adipose tissue were stained with hematoxylin and eosin. Bar, 125 μm. (B) Total interscapular brown adipose tissue mass was measured (mean ± SEM; n = 14∼20). (***) P < 0.001. (C) The expression of Spot14 and Glut4 mRNA in brown adipose tissue was measured by quantitative RT–PCR assays (mean ± SEM; n = 10∼12). (*) P < 0.05.
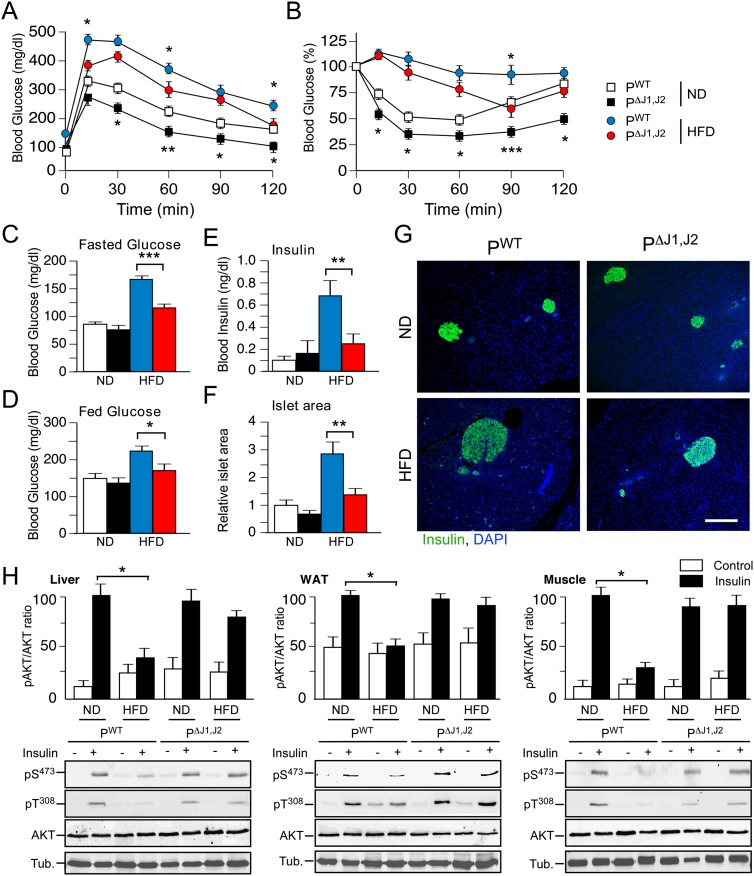
Obesity is a major contributor to the development of prediabetes, including impaired glycemia and insulin resistance (Kahn et al. 2006). We therefore anticipated that defects in obesity would lead to improved glucose metabolism in PΔJ1,J2 mice. Indeed, PΔJ1,J2 mice showed improved glucose and insulin tolerance (Fig. 3A,B), reduced hyperglycemia (Fig. 3C,D), reduced hyperinsulinemia (Fig. 3E), and reduced islet hypertrophy (Fig. 3F,G) compared with PWT mice. Moreover, the HFD-fed PΔJ1,J2 mice showed improved insulin-stimulated AKT activation in adipose tissue, liver, and skeletal muscle (Fig. 3H). It is likely that these phenotypes are a consequence of the reduced obesity of PΔJ1,J2 mice compared with PWT mice (Fig. 1).
Figure 3.
JNK-mediated obesity causes insulin resistance. (A,B) The effect of consuming a HFD (16 wk) on glucose tolerance (A) and insulin tolerance (B) was examined (mean ± SEM; n = 8∼12). Significant differences between PWT and PΔJ1,J2 mice were detected. (*) P < 0.05; (**) P < 0.01; (***) P < 0.001. (C,D) The blood glucose concentration in mice fasted overnight (C) or fed ad libitum (D) was measured (mean ± SEM; n = 20). (*) P < 0.05; (**) P < 0.01. (E) The blood insulin concentration in mice fasted overnight was measured (mean ± SEM; n = 20). (**) P < 0.01. (F,G) Sections of the pancreas of PWT and PΔJ1,J2 mice fed an ND or a HFD (16 wk) were stained with an antibody to insulin. DNA was stained with DAPI (blue). Bar, 150 μm. The relative area of islets in pancreatic sections is presented as the mean ± SEM (n = 25∼35). (**) P < 0.01. (H) Mice were starved overnight and treated by intraperitoneal injection with saline (control) or insulin (1.5 U/kg). (Top panels) Tissue extracts prepared at 15 min post-injection were examined by multiplexed ELISA for pAKT and AKT (mean ± SEM; n = 5∼6). (*) P < 0.05. Representative extracts were also examined by immunoblot analysis using antibodies to αTubulin (Tub.), AKT, and phospho-AKT (pSer473 and pThr308).
Pituitary gland JNK decreases energy expenditure and promotes obesity
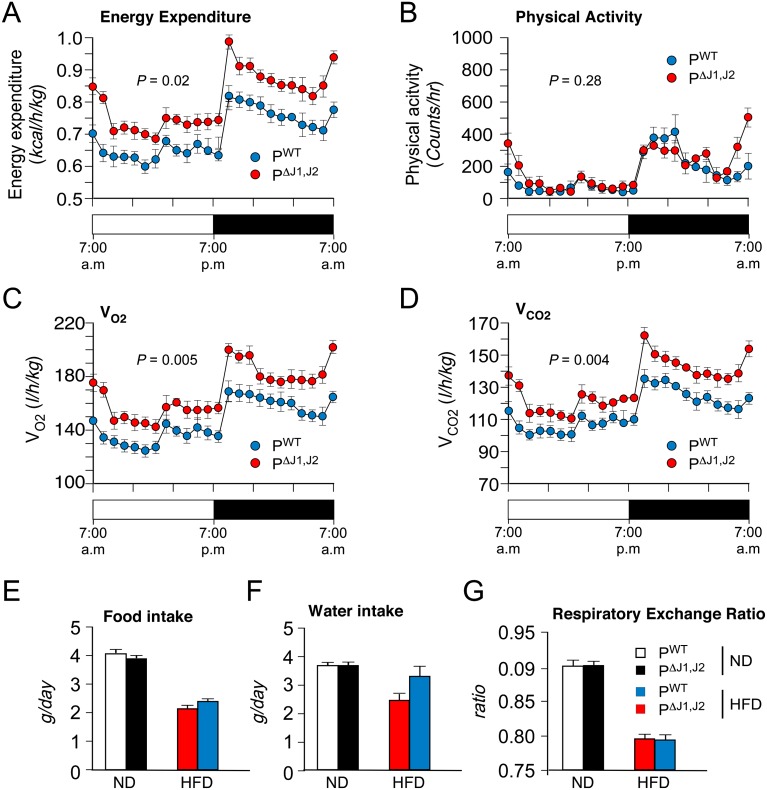
We performed metabolic cage analysis to examine mechanisms that might account for the reduced obesity of HFD-fed PΔJ1,J2 mice compared with PWT mice. These studies demonstrated that the physical activity and the amount of food eaten by PWT and PΔJ1,J2 mice were similar, but energy expenditure by HFD-fed PΔJ1,J2 mice was significantly greater than that of HFD-fed PWT mice (Fig. 4). These data indicate that increased energy expenditure is a major contributor to the resistance of PΔJ1,J2 mice to HFD-induced obesity.
Figure 4.
JNK suppresses energy expenditure. (A–D) Metabolic cage analysis of HFD-fed (4 wk) PWT and PΔJ1,J2 mice was performed to measure energy expenditure (A), physical activity (B), oxygen consumption (VO2) (C), and carbon dioxide release (VCO2) (D). The data presented are the mean ± SEM (n = 6), and the statistical significance of differences is indicated. (E–G) ND-fed and HFD-fed (4 wk) PWT and PΔJ1,J2 mice were examined in metabolic cages to measure food intake (E), water intake (F), and the respiratory exchange ratio (VCO2/VO2) (G). The data presented are the mean ± SEM (n = 6). No statistically significant differences between PWT and PΔJ1,J2 mice were detected.
The JNK1 and JNK2 isoforms exhibit partial functional redundancy
To examine the relative contributions of the JNK1 and JNK2 isoforms, we investigated the effect of feeding a HFD to mice with ablation of Jnk1 or Jnk2 only (PΔJ1 and PΔJ2 mice) in the anterior pituitary gland. This analysis demonstrated that HFD-fed PΔJ1 mice, PΔJ2 mice, and PWT mice exhibited similar HFD-induced obesity, glucose and insulin tolerance, energy expenditure, and food consumption (Supplemental Figs. S5, S6). These data contrast with studies of PΔJ1,J2 mice (Figs. 1–3) and indicate that JNK1 and JNK2 play partially redundant roles in the anterior pituitary gland.
JNK regulates the expression of pituitary hormones
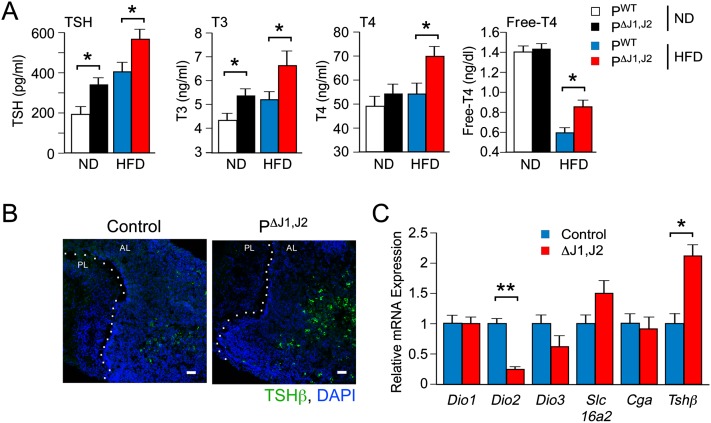
A major function of the anterior pituitary gland is the production of hormones that regulate metabolism and reproduction. The blood concentration of growth hormone (GH) and adrenocorticotrophic hormone (ACTH; a component of the pituitary–adrenal axis) was similar in PWT and PΔJ1,J2 mice, but a modest increase in the blood concentration of the reproductive hormones follicle-stimulating hormone (FSH) and luteinizing hormone (LH) was detected in the blood of PΔJ1,J2 mice compared with PWT mice (Supplemental Fig. S7). The relevance of these changes to the development of obesity is unclear. However, the increased blood concentration of TSH in PΔJ1,J2 mice compared with PWT mice (Fig. 5A) may contribute to the resistance of PΔJ1,J2 mice to HFD-induced obesity.
Figure 5.
JNK deficiency causes increased TSH expression. (A) The blood concentration of TSH, T3, T4, and free T4 in ND-fed and HFD-fed (4 wk) PWT and PΔJ1,J2 mice following overnight starvation was measured by ELISA (mean ± SEM; n = 8∼12). (*) P < 0.05. (B) Sections of the pituitary gland were stained with an antibody to TSHβ. DNA was stained with DAPI. The anterior lobe (AL) and posterior lobe (PL) of the pituitary gland are indicated. (C) Total RNA was isolated from primary cultures of pituitary cells isolated from control and JNK-deficient mice. Gene expression was measured by quantitative RT–PCR analysis of mRNA (mean ± SEM; n = 6∼8). (*) P < 0.05; (**) P < 0.01.
We found increased amounts of TSH (Fig. 5B) and increased expression of Tshβ mRNA [but not Cga (Tshα) mRNA] in the anterior pituitary gland of PΔJ1,J2 mice compared with PWT mice (Fig. 5C). The increased amount of blood TSH (Fig. 5A) was associated with an increased concentration of thyroid hormone (T3 and T4) in the blood of HFD-fed PΔJ1,J2 mice compared with HFD-fed PWT mice (Fig. 5A). Indeed, increased thyroid hormone-dependent gene expression was detected in the liver and brown adipose tissue of PΔJ1,J2 mice compared with PWT mice (Fig. 2C; Supplemental Fig. S4D). Together, these data indicate that JNK deficiency in the pituitary gland increases the thyroid hormone signaling axis.
Thyroid hormone mediates the effects of pituitary JNK deficiency on obesity
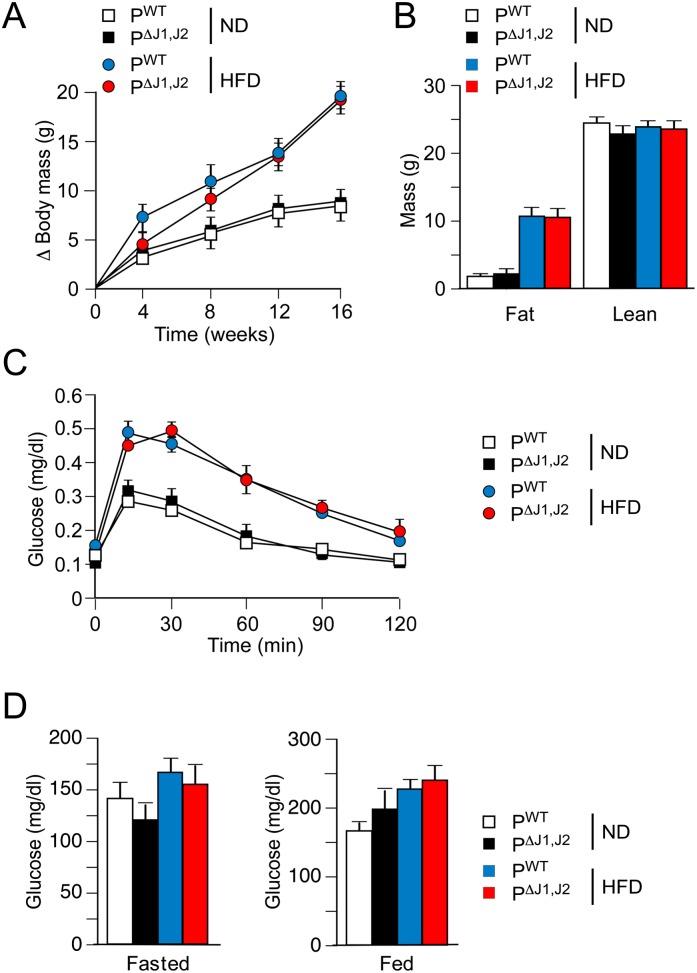
To test the role of thyroid hormone on the resistance of PΔJ1,J2 mice to HFD-induced obesity (Fig. 1), we examined the effect of propylthiouracil (PTU), a drug that inhibits thyroperoxidase and reduces thyroid hormone production by the thyroid gland (Björkman and Ekholm 2000). Treatment of mice with PTU reduced the circulating concentration of T4 (Supplemental Fig. S8). No significant differences in blood T4 concentration were detected between PTU-treated PWT and PΔJ1,J2 mice (Supplemental Fig. S8). We found that PTU prevented the resistance of PΔJ1,J2 mice to HFD-induced obesity (Fig. 6A,B) and also prevented the improved hyperglycemia and glucose tolerance of HFD-fed PΔJ1,J2 mice (Figs. 6C,D). These data indicate that the thyroid hormone pathway is required for the resistance of PΔJ1,J2 mice to HFD-induced obesity.
Figure 6.
Thyroid hormone is required for glycemic regulation caused by JNK deficiency in the pituitary gland. (A) The total body mass gain of PTU-treated ND-fed and HFD-fed mice treated with PTU in the drinking water was examined (mean ± SEM; n = 7∼10). No significant differences between PWT and PΔJ1,J2 mice were detected. P > 0.05. (B) The fat and lean mass of PTU-treated ND-fed and HFD-fed (16 wk) mice were measured by 1H-MRS analysis (mean ± SD; n = 7∼10). No significant differences between PWT and PΔJ1,J2 mice were detected. P > 0.05. (C) The effect of consuming a HFD (16 wk) on glucose tolerance of PTU-treated mice was examined (mean ± SEM; n = 8∼12). No significant differences between PWT and PΔJ1,J2 mice were detected. P > 0.05. (D) PTU-treated PWT and PΔJ1,J2 mice were fed an ND or a HFD (16 wk). The blood glucose concentration in mice fasted overnight or fed ad libitum was measured (mean ± SEM; n = 7∼12). P > 0.05.
Pituitary JNK deficiency promotes TSH expression
The increase in Tshβ expression detected in JNK-deficient pituitary glands could be mediated by increased positive regulation or by decreased negative regulation. We therefore examined changes in positive and negative regulation of Tshβ expression in PWT and PΔJ1,J2 mice.
Tshβ expression is positively regulated by the transcription factors Gata2 and Pou1f1 and negatively regulated by the thyroid hormone receptor Thrβ (Gordon et al. 1997; Abel et al. 1999). Comparison of the anterior pituitary glands of PWT and PΔJ1,J2 mice demonstrated no significant differences in the expression of the Gata2, Pou1f1, and Thrβ transcription factors (Supplemental Fig. S9), although we cannot exclude the possibility that JNK alters the activity of one or more of these transcription factors. Tshβ expression is also positively regulated by hypothalamic expression of thyrotropin-releasing hormone (TRH) that binds receptors (TRHR) on thyrotrophs. No significant difference in the anterior pituitary expression of Trhr was detected between PWT and PΔJ1,J2 mice (Supplemental Fig. S9). Similarly, hypothalamic expression of Trh was unchanged in chow-fed PWT and PΔJ1,J2 mice but was decreased in HFD-fed PΔJ1,J2 mice compared with HFD-fed PWT mice (Supplemental Fig. S10). This reduction in hypothalamic Trh expression may reflect negative feedback regulation (Segerson et al. 1987) by the increased concentration of circulating T4 detected in HFD-fed PΔJ1,J2 mice compared with HFD-fed PWT mice (Fig. 5A). In addition, the reduced blood leptin concentration in HFD-fed PΔJ1,J2 mice (Supplemental Fig. S3B) may also contribute to the decreased hypothalamic Trh expression (Nillni et al. 2000; Guo et al. 2004; Perello et al. 2010). Together, these data do not provide evidence for increased positive regulation of Tshβ expression in HFD-fed PΔJ1,J2 mice.
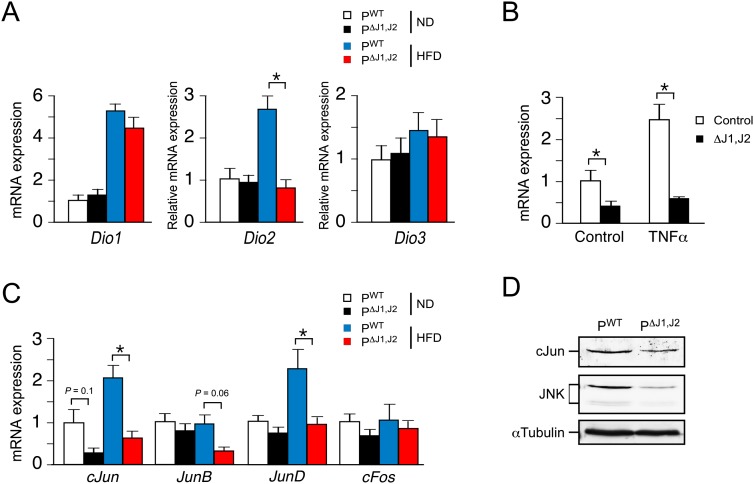
Reduced negative regulation represents a potential mechanism that contributes to increased TSH expression detected in PΔJ1,J2 mice compared with PWT mice. A major mechanism of negative regulation of Tshβ expression in the pituitary gland is mediated by T3 (Silva and Larsen 1977). The bioavailability of T3 is critically controlled by the thyroid hormone transporter Slc16A2 (Visser et al. 2011) and Dio genes (Bianco and Larsen 2005). Indeed, Dio2 is critically required for prohormone T4 conversion to biologically active T3 (Bianco and Kim 2006), and Dio3 plays a key role in signal termination by converting T3 to inactive reverse T3 (Bianco and Larsen 2005). Increased Tshβ expression by PΔJ1,J2 mice may therefore be caused by increased expression of Dio3 or reduced expression of Slc16A2 or Dio2. However, a comparison of PWT and PΔJ1,J2 mice demonstrated no significant differences in the expression of Slc16A2, Dio1, and Dio3, but JNK deficiency caused markedly reduced Dio2 gene expression (Figs. 5C, 7A). These data indicate that Dio2 may contribute to the effects of JNK on TSH expression by thyrotrophs.
Figure 7.
JNK promotes expression of Dio2 in the anterior pituitary gland. (A) PWT and PΔJ1,J2 mice were fed an ND or a HFD (16 wk). Total RNA was isolated from the anterior pituitary gland, and the expression of Dio (Dio1, Dio2, and Dio3) mRNA was measured by quantitative RT–PCR assays (mean ± SEM, n = 7∼12). (*) P < 0.05. (B) Primary cultures of anterior pituitary gland cells were treated without and with 10 ng/mL TNFα (12 h). The expression of Dio2 mRNA was measured by quantitative RT–PCR assays (mean ± SEM; n = 6). (*) P < 0.05. (C) PWT and PΔJ1,J2 mice were fed a ND or a HFD (16 wk). Total RNA was isolated from the anterior pituitary gland, and the expression of AP-1 transcription factor (cJun, JunB, JunD, and cFos) mRNA was measured by quantitative RT–PCR assays (mean ± SEM, n = 7∼12). (*) P < 0.05. (D) Extracts prepared from the anterior pituitary gland of PWT and PΔJ1,J2 mice were examined by immunoblot analysis by probing with antibodies to cJun, JNK, and αTubulin.
JNK regulates Dio2 gene expression
Dio2 gene expression is induced by activating protein 1 (AP1) transcription factors (Canettieri et al. 2008). This is significant because AP1 expression and function are direct targets of the JNK signaling pathway (Davis 2000). We therefore examined AP1 expression in the pituitary gland of PWT and PΔJ1,J2 mice. JNK deficiency was found to cause reduced expression of the AP1 transcription factors cJun and JunD (Fig. 7C,D). This reduced AP1 expression was associated with decreased Dio2 gene expression in the anterior pituitary gland of PΔJ1,J2 mice compared with PWT mice (Fig. 7C). Moreover, tumor necrosis factor (TNF), a JNK-dependent activator of AP1 (Ventura et al. 2003), strongly induces Dio2 gene expression (Baur et al. 2000) in thyrotrophs of PWT mice but not PΔJ1,J2 mice (Fig. 7B). Together, these observations indicate that the JNK pathway, activated by consuming a HFD (Fig. 1B), regulates Dio2 gene expression in the anterior pituitary gland of HFD-fed mice (Fig. 7A).
JNK deficiency in the anterior pituitary gland mimics Dio2 deficiency
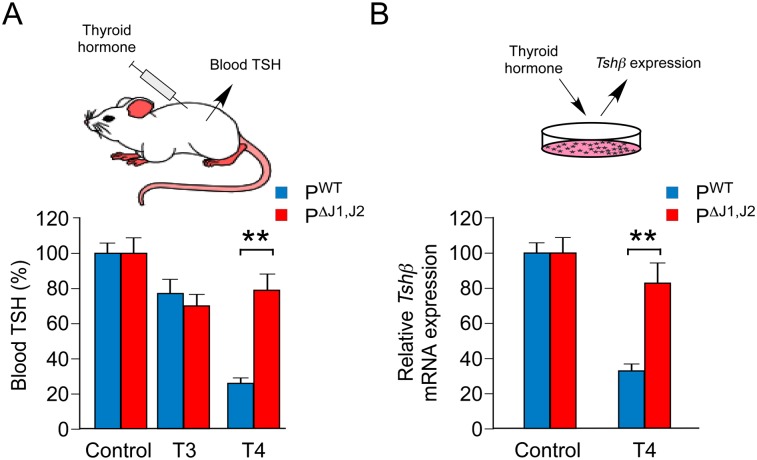
To test whether decreased Dio2 gene expression in the anterior pituitary gland contributes to the phenotype of PΔJ1,J2 mice, we examined the effect of thyroid hormone on negative regulation of TSH expression. It is established that Dio2 gene ablation prevents T4-mediated inhibition of TSH expression (Schneider et al. 2001). We therefore investigated the effect of thyroid hormone on TSH expression by PWT and PΔJ1,J2 mice. Control studies demonstrated that T3 caused a similar small decrease in the blood concentration of TSH in PWT and PΔJ1,J2 mice (Fig. 8). In contrast, T4 strongly suppressed the amount of TSH in the blood of PWT mice but not PΔJ1,J2 mice (Fig. 8A). Moreover, in vitro studies using primary anterior pituitary cell cultures demonstrated that JNK deficiency prevented T4-mediated repression of Tshβ gene expression (Fig. 8B). This defect in T4-mediated negative feedback regulation of TSH expression caused by JNK deficiency is similar to that found in Dio2-deficient mice (Schneider et al. 2001). These data strongly support the conclusion that JNK-regulated Dio2 gene expression mediates the effects of JNK on TSH expression in the anterior pituitary gland.
Figure 8.
JNK is required for negative feedback regulation of the pituitary gland by thyroid hormone. (A) PWT and PΔJ1,J2 mice were fed a HFD and treated with PTU in the drinking water (16 wk). The blood concentration of TSH was measured by ELISA. The effect of intraperitoneal injection of solvent (control) or thyroid hormone (30 μg/kg T3 or 10 μg/kg T4) was examined (5 h). The data presented show the decrease in blood TSH concentration caused by treatment with thyroid hormone (mean ± SEM; n = 10). (**) P < 0.01. (B) Primary cultures of anterior pituitary cells were incubated (12 h) with vehicle (control) or T4 (25 nM). Tshβ mRNA expression was measured by quantitative RT–PCR analysis (mean ± SEM; n = 8). (**) P < 0.01.
Discussion
The JNK signaling pathway is activated in response to metabolic stress. Recent studies have demonstrated that JNK activation caused by consuming a HFD contributes to two different metabolic responses: the development of insulin resistance and obesity (Sabio and Davis 2010). These two responses represent separate targets of the JNK signaling pathway. Thus, tissue-specific gene ablation studies indicate that JNK in peripheral tissues is required for HFD-induced insulin resistance but not obesity (Sabio and Davis 2010). In contrast, a central function of JNK to regulate energy expenditure is required for HFD-induced obesity (Sabio and Davis 2010).
The effects of JNK on insulin resistance may be mediated by phosphorylation of target proteins, including the insulin receptor adapter protein IRS1 (Aguirre et al. 2000). However, the mechanism of central JNK signaling that regulates energy expenditure and obesity is unclear. Studies of mice with JNK deficiency in the brain have identified the HPT axis as a potential mediator of JNK signaling (Belgardt et al. 2010; Sabio et al. 2010a). It was found that JNK deficiency in the brain caused increased energy expenditure that was dependent on the HPT axis (Sabio and Davis 2010). However, the molecular targets of JNK that mediate the effects of HFD-induced JNK activation on the HPT axis have not been defined.
Hypothalamic TRH acts on thyrotrophs in the anterior pituitary gland that respond by secreting TSH, a glycoprotein hormone that stimulates the thyroid gland to increase thyroid hormone production. In obese mice, the adipokine leptin acts on the hypothalamus to increase TRH-mediated TSH expression (Nillni et al. 2000; Perello et al. 2010). TRH also promotes TSH glycosylation and bioactivity (Weintraub et al. 1989; Magner 1990). The resulting increase in thyroid hormone production is limited by thyroid hormone-mediated feedback inhibition of TRH and TSH expression (Silva and Larsen 1977; Segerson et al. 1987). The HPT axis is therefore subject to complex regulatory control by neuronal innervation together with hormones and adipokines. Indeed, regulation of the HPT axis by diet-induced obesity may involve changes in TRH expression, TSH expression and bioactivity, and the amount of thyroid hormone in the blood.
To test JNK function in the anterior pituitary gland, we established mice with targeted ablation of the ubiquitously expressed Jnk1 and Jnk2 genes using the Cga promoter to drive expression of Cre recombinase. The PΔJ1,J2 mice were found to be resistant to HFD-induced obesity (Fig. 1). This reduced obesity was caused by increased energy expenditure (Fig. 4) and was dependent on the HPT axis (Fig. 6).
The discovery of increased TSH and thyroid hormone in the blood of HFD-fed PΔJ1,J2 mice compared with HFD-fed PWT mice (Fig. 5) was surprising because it is established that thyroid hormone causes profound negative feedback regulation of both hypothalamic TRH and pituitary TSH production (Silva and Larsen 1977; Segerson et al. 1987). TRH expression was reduced in HFD-fed PΔJ1,J2 mice compared with HFD-fed PWT mice, consistent with negative feedback regulation by thyroid hormone (Supplemental Fig. S10). However, TSH expression by HFD-fed PΔJ1,J2 mice was increased (compared with HFD-fed PWT mice) despite reduced hypothalamic TRH expression (Supplemental Fig. S10) and increased amounts of thyroid hormone in the blood (Fig. 5). This observation suggests that the primary phenotype of HFD-fed PΔJ1,J2 mice is failure of the negative regulation of TSH expression by thyroid hormone. Indeed, PΔJ1,J2 mice were found to be resistant to T4-mediated negative feedback regulation of TSH production (Fig. 8). This defect in negative regulation contributes to increased HPT axis function in HFD-fed PΔJ1,J2 mice compared with HFD-fed PWT mice.
It is established that the inhibition of TSH production caused by thyroid hormone requires the DIO2-dependent intracellular conversion of the prohormone T4 to biologically active T3 (Bianco and Kim 2006). Dio2 gene ablation prevents T4-mediated inhibition of TSH expression (Schneider et al. 2001), and DIO2 deficiency in the pituitary gland causes reduced obesity (Fonseca et al. 2013). Dio2 therefore represents a potential JNK target gene that mediates HPT axis regulation by JNK. Indeed, Dio2 gene expression was reduced in the pituitary gland of HFD-fed PΔJ1,J2 mice compared with HFD-fed PWT mice (Fig. 7).
Collectively, these data indicate that JNK-promoted obesity is mediated in part by HFD-induced JNK activation in the anterior pituitary gland, increased expression of the JNK target gene Dio2, increased negative feedback regulation of TSH production, and reduced energy expenditure. We cannot exclude the possibility that additional JNK target genes play important roles. Other factors may also contribute to the phenotype of PΔJ1,J2 mice, including changes in TRH-regulated TSH bioactivity. Moreover, our analysis does not exclude contributing roles for inflammatory cytokines, hormones, and adipokines. Indeed, the reduced inflammation detected in PΔJ1,J2 mice (Fig. 1E,F; Supplemental Fig. S3) may contribute to improved glycemia (Han et al. 2013). Altered inflammation may also influence thyroid gland function by changing the expression of thyrotropin, thyroperoxidase, and the Na+/I− symporter (Velez et al. 2006; Nicola et al. 2009; Nazar et al. 2012). Nevertheless, our data establish that Dio2 is a key JNK target gene in the anterior pituitary gland that contributes to obesity.
We speculate that DIO2 may play a similar role in the regulation of TRH expression by hypothalamic JNK (Sabio and Davis 2010). Mice with JNK deficiency in the brain exhibit increased hypothalamic TRH expression despite increased amounts of thyroid hormone in the blood (Sabio and Davis 2010). The T4-mediated negative feedback pathway that represses neuronal TRH expression requires nonneuronal cells that express DIO2, including tanycytes (Kakucska et al. 1992; Rodriguez et al. 2005; Fekete and Lechan 2007). A working hypothesis for future studies is that increased hypothalamic TRH expression detected in mice with JNK deficiency in the brain (Sabio and Davis 2010) is mediated by loss of JNK function in tanycytes, reduced Dio2 expression, and, consequently, reduced T4-mediated feedback inhibition of neuronal TRH expression.
Conclusions
We identify the Dio2 gene as a key target of the JNK signaling pathway during the development of obesity. Consuming a HFD causes JNK activation in the anterior pituitary gland, increased Dio2 gene expression, decreased energy expenditure, and the development of obesity. Disruption of JNK signaling in the anterior pituitary gland increases energy expenditure and suppresses obesity. Together, these data identify a molecular mechanism that contributes to JNK-dependent development of obesity in response to feeding a HFD.
Materials and methods
Mice
We previously described Jnk1LoxP/LoxP mice (Das et al. 2007), Jnk2LoxP/LoxP mice (Han et al. 2013), and Rosa-CreERT Jnk1LoxP/LoxP Jnk2−/− mice (Das et al. 2007). C57BL/6J mice (stock no. 000664), Rosa-CreERT mice (stock no. 00487) (Badea et al. 2003), and Cga-Cre mice (stock no. 004426) (Cushman et al. 2000) were obtained from The Jackson Laboratory. The mice were backcrossed to the C57BL/6J strain (10 generations) and housed in a facility accredited by the American Association for Laboratory Animal Care (AALAC). The mice were genotyped by PCR analysis of genomic DNA (Das et al. 2007; Han et al. 2013). All studies were performed using male mice (8–24 wk old). Rosa-CreERT mice and Rosa-CreERT Jnk1LoxP/LoxP Jnk2−/− mice were treated with 1 mg of tamoxifen (Sigma) by intraperitoneal (i.p.) injection once each day for five consecutive days. Male mice (8 wk old) were fed a ND or a HFD (Iso Pro 3000 [Purina] and F3282 [Bioserve, Inc.]) for 16 wk. Whole-body fat and lean mass were noninvasively measured using 1H-MRS (Echo Medical Systems). The animal studies were approved by the Institutional Animal Care and Use Committee of the University of Massachusetts Medical School.
Primary cell culture
Anterior pituitary cells were established in primary culture (Koenig et al. 1984). Briefly, pituitaries were removed from tamoxifen-treated Rosa-CreERT (PWT) and Rosa-CreERT Jnk1LoxP/LoxP Jnk2−/− (PΔJ1,J2) male mice (12–16 wk old). The posterior and intermediate lobes were discarded. The anterior pituitaries were digested in HBSS containing 1 mg/mL trypsin, 2 mg/mL collagenase, and 1 mg/mL DNase for 30 min at 37°C. Digested pituitary glands were washed and triturated in DMEM/F12 supplemented with 10% charcoal-stripped FBS (Invitrogen). The single-cell suspension was then plated onto poly-D-lysine-coated 24-well plates (Life Technologies). The cells were harvested for analysis after 24 h in culture.
RNA analysis
The expression of mRNA was examined by quantitative PCR analysis using a Quantstudio PCR machine (Life Technologies). TaqMan assays were used to quantitate Ccl2 (Mm00441242_m1), cFos (Mm00487425_m1), cJun (Mm00495062_s1), Cga/Tsha (Mm01209400_m1), Dio1 (Mm00839358_m1), Dio2 (Mm00515664_m1), Dio3 (Mm00548953_s1), Emr1 (F4/80) (Mm00802530_m1), Gata2 (Mm00492301_m1), Glut4 (Mm00436615-m1), Jnk1 (Mm00489514_m1), Jnk2 (Mm00444231_m1), JunB (Mm00492781_s1), JunD (Mm00495088_s1), Ldhb (Mm00493146_m1), Leptin (Mm00434759_m1), Pou1f1 (Mm00476852_m1), Slc16a2 (Mm00486204_m1), Spot14 (Mm01273967_m1), Thrb (Mm00437044_m1), Trh (Mm01963590_s1), Trhr (Mm00443262_m1), Tshb (Mm00437190_m1), and Tnfα (Mm00443258_m1). The relative mRNA expression was normalized by measurement of the amount of 18S RNA in each sample using TaqMan assays (catalog no. 4308329, Life Technologies).
Immunoblot analysis
Tissue extracts were prepared using Triton lysis buffer (20 mM Tris at pH 7.4, 1% Triton X-100, 10% glycerol, 137 mM NaCl, 2 mM EDTA, 25 mM β-glycerophosphate, 1 mM sodium orthovanadate, 1 mM phenylmethylsulfonyl fluoride, 10 mg/mL aprotinin and leupeptin). Extracts (20–50 μg of protein) were examined by protein immunoblot analysis by probing with antibodies to AKT, phospho-Thr308 AKT, and phospho-Ser473 AKT (Cell Signaling); cJun (Santa Cruz Biotechnology); JNK (Pharmigen); and αTubulin (Sigma). Immunocomplexes were detected using the Odyssey infrared imaging system (LI-COR Biosciences).
Blood analysis
Blood glucose was measured with an Ascensia Breeze 2 glucometer (Bayer). Adipokines, cytokines, pituitary hormones, and insulin in plasma were measured by multiplexed ELISA using a Luminex 200 machine (Millipore). T3 and T4 in plasma were measured using an ELISA kit (Calbiotech). Free T4 was measured using a kit purchased from Leinco Technologies.
Glucose and insulin tolerance tests
Glucose and insulin tolerance tests were performed by i.p. injection of mice with 2 g/kg glucose or 0.5 U/kg insulin using methods described previously (Sabio et al. 2008).
Treatment of mice with thyroid hormone
Mice were treated (16 wk) with PTU in the drinking water (cherry-flavored Kool-Aid supplemented without [Control] or with 1.2 mM PTU [Sigma]). The mice were injected i.p. with saline (solvent control) or thyroid hormone (30 μg/kg T3 or 10 μg/kg T4). The amount of TSH in the blood prior to injection and at 5 h post-injection was measured by ELISA.
Metabolic cages
The analysis was performed by the Mouse Metabolic Phenotyping Center at the University of Massachusetts Medical School. The mice were housed under controlled temperature and lighting with free access to food and water. The food/water intake, energy expenditure, respiratory exchange ratio, and physical activity were measured using metabolic cages (TSE Systems).
Analysis of tissue sections
Histology was performed using tissue fixed in 10% formalin for 24 h, dehydrated, and embedded in paraffin. Sections (7 μm) were cut and stained using hematoxylin and eosin (American Master Tech Scientific). Paraffin sections were stained with an antibody to F4/80 (Abcam), insulin (Dako), perilipin (Abcam), phosphoJNK (Cell Signaling), and TSHβ (a gift from Dr. A. Parlow, National Institute of Diabetes and Digestive and Kidney Diseases). The primary antibodies were detected by incubation with anti-guinea pig Ig, anti-rat Ig, or anti-rabbit Ig conjugated to Alexa Fluor 488 or 633 (Life Technologies). DNA was detected by staining with DAPI (Life Technologies). Fluorescence was visualized using a Leica TCS SP2 confocal microscope equipped with a 405-nm diode laser. Islet area was determined by dividing total β-cell area (marked by staining with insulin antibodies) by the pancreatic area per section using ImageJ64 software. Hepatic steatosis was examined using sections (7 μm) prepared from tissue frozen in O.C.T. compound (Tissue-Tek) and staining with Sudan black (American Master Tech Scientific).
Electron microscopy
Transmission electron microscopy was performed using tissue washed with 0.1 M sodium cacodylate buffer (pH 7.2) and fixed with 2.5% glutaraldehyde for 30 min at room temperature and in the same fresh fixative overnight at 4°C. The tissue was rinsed (10 min) in 0.1 M sodium cacodylate buffer (pH 7.2) three times and then post-fixed (1 h) in 1% (w/v) osmium tetroxide in distilled water. The fixed tissue was rinsed in double-distilled water and dehydrated through a graded ethanol series (10%, 30%, 50%, 70%, 85%, and 95% for 20 min each) before two changes of ethanol (100%). The samples then were treated with two changes of propylene oxide and with a propylene oxide/SPI-Pon 812 resin mixture (1/1). On the following day, three changes of fresh SPI-Pon 812 resin were performed before the samples were polymerized at 68°C in flat embedding molds. The epoxy blocks were cut and mounted on blank epoxy stubs with a drop of superglue. Ultrathin sections were cut on a Reichart-Jung ultramicrotome using a diamond knife. The sections were collected and mounted on copper support grids, contrasted with lead citrate and uranyl acetate, and examined using a FEI Tecnai 12 BT electron microscope with 80 kV accelerating voltage. Images were captured using a Gatan TEM CCD camera.
Scanning electron microscopy was performed using tissue fixed as described for transmission electron microscopy and washed three times in the same fixation buffer. The samples were then dehydrated through a graded series of ethanol (10%, 30%, 50%, 70%, 85%, and 95% for 20 min each) before two changes of ethanol (100%) and then critical point-dried in liquid CO2. The dried samples were mounted onto aluminum stubs with carbon tape, carbon-coated (10 nm), and then sputter-coated (8 nm) with Au/Pd (80/20). The specimens were examined using a FEI Quanta 200 FEG MK II scanning electron microscope at 5 kV accelerating voltage.
Statistical analysis
Differences between groups were examined for statistical significance using the Student's test or analysis of variance (ANOVA) with the Fisher's test.
Acknowledgments
We thank Dr. A. Parlow (National Institute of Diabetes and Digestive and Kidney Diseases) for providing the antibody to TSH, Lara Strittmatter and Greg Hendricks for assistance with electron microscopy, Yoshihiro Azuma and Vicky Benoit for expert technical assistance, and Kathy Gemme for administrative assistance. These studies were supported by a grant from the National Institutes of Health (DK090963). The University of Massachusetts Mouse Metabolic Phenotyping Center is supported by grant DK093000. The University of Massachusetts Electron Microscopy Core is supported by grants from the National Center For Research Resources (S10RR021043 and S10RR027897). S.V. was supported by a fellowship from the Ramon Areces Foundation. R.J.D. and J.K.K. are members of the University of Massachusetts Diabetes and Endocrinology Research Center (DK032520). R.J.D. is an investigator of the Howard Hughes Medical Institute.
Footnotes
Supplemental material is available for this article.
Article is online at http://www.genesdev.org/cgi/doi/10.1101/gad.223800.113.
References
- Abel ED, Boers ME, Pazos-Moura C, Moura E, Kaulbach H, Zakaria M, Lowell B, Radovick S, Liberman MC, Wondisford F 1999. Divergent roles for thyroid hormone receptor β isoforms in the endocrine axis and auditory system. J Clin Invest 104: 291–300 [DOI] [PMC free article] [PubMed] [Google Scholar]
- Aguirre V, Uchida T, Yenush L, Davis RJ, White MF 2000. The c-Jun NH(2)-terminal kinase promotes insulin resistance during association with insulin receptor substrate-1 and phosphorylation of Ser(307). J Biol Chem 275: 9047–9054 [DOI] [PubMed] [Google Scholar]
- Badea TC, Wang Y, Nathans J 2003. A noninvasive genetic/pharmacologic strategy for visualizing cell morphology and clonal relationships in the mouse. J Neurosci 23: 2314–2322 [DOI] [PMC free article] [PubMed] [Google Scholar]
- Bashan N, Dorfman K, Tarnovscki T, Harman-Boehm I, Liberty IF, Bluher M, Ovadia S, Maymon-Zilberstein T, Potashnik R, Stumvoll M, et al. 2007. Mitogen-activated protein kinases, inhibitory-κB kinase, and insulin signaling in human omental versus subcutaneous adipose tissue in obesity. Endocrinology 148: 2955–2962 [DOI] [PubMed] [Google Scholar]
- Baur A, Bauer K, Jarry H, Kohrle J 2000. Effects of proinflammatory cytokines on anterior pituitary 5′-deiodinase type I and type II. J Endocrinol 167: 505–515 [DOI] [PubMed] [Google Scholar]
- Belgardt BF, Mauer J, Wunderlich FT, Ernst MB, Pal M, Spohn G, Bronneke HS, Brodesser S, Hampel B, Schauss AC, et al. 2010. Hypothalamic and pituitary c-Jun N-terminal kinase 1 signaling coordinately regulates glucose metabolism. Proc Natl Acad Sci 107: 6028–6033 [DOI] [PMC free article] [PubMed] [Google Scholar]
- Bianco AC, Kim BW 2006. Deiodinases: Implications of the local control of thyroid hormone action. J Clin Invest 116: 2571–2579 [DOI] [PMC free article] [PubMed] [Google Scholar]
- Bianco AC, Larsen PR 2005. Cellular and structural biology of the deiodinases. Thyroid 15: 777–786 [DOI] [PubMed] [Google Scholar]
- Björkman U, Ekholm R 2000. Biochemistry of thyroid hormone formation and secretion. In The thyroid gland (ed. Greer MA), pp. 83–125. Raven Press, New York [Google Scholar]
- Canettieri G, Franchi A, Guardia MD, Morantte I, Santaguida MG, Harney JW, Larsen PR, Centanni M 2008. Activation of thyroid hormone is transcriptionally regulated by epidermal growth factor in human placenta-derived JEG3 cells. Endocrinology 149: 695–702 [DOI] [PMC free article] [PubMed] [Google Scholar]
- Cushman LJ, Burrows HL, Seasholtz AF, Lewandoski M, Muzyczka N, Camper SA 2000. Cre-mediated recombination in the pituitary gland. Genesis 28: 167–174 [DOI] [PubMed] [Google Scholar]
- Das M, Jiang F, Sluss HK, Zhang C, Shokat KM, Flavell RA, Davis RJ 2007. Suppression of p53-dependent senescence by the JNK signal transduction pathway. Proc Natl Acad Sci 104: 15759–15764 [DOI] [PMC free article] [PubMed] [Google Scholar]
- Davis RJ 2000. Signal transduction by the JNK group of MAP kinases. Cell 103: 239–252 [DOI] [PubMed] [Google Scholar]
- Fekete C, Lechan RM 2007. Negative feedback regulation of hypophysiotropic thyrotropin-releasing hormone (TRH) synthesizing neurons: Role of neuronal afferents and type 2 deiodinase. Front Neuroendocrinol 28: 97–114 [DOI] [PMC free article] [PubMed] [Google Scholar]
- Flegal KM, Kit BK, Orpana H, Graubard BI 2013. Association of all-cause mortality with overweight and obesity using standard body mass index categories: A systematic review and meta-analysis. JAMA 309: 71–82 [DOI] [PMC free article] [PubMed] [Google Scholar]
- Fonseca TL, Correa-Medina M, Campos MP, Wittmann G, Werneck-de-Castro JP, Arrojo e Drigo R, Mora-Garzon M, Ueta CB, Caicedo A, Fekete C, et al. 2013. Coordination of hypothalamic and pituitary T3 production regulates TSH expression. J Clin Invest 123: 1492–1500 [DOI] [PMC free article] [PubMed] [Google Scholar]
- Gadang V, Kohli R, Myronovych A, Hui DY, Perez-Tilve D, Jaeschke A 2013. MLK3 promotes metabolic dysfunction induced by saturated fatty acid-enriched diet. Am J Physiol Endocrinol Metab 305: E549–E556 [DOI] [PMC free article] [PubMed] [Google Scholar]
- Gordon DF, Lewis SR, Haugen BR, James RA, McDermott MT, Wood WM, Ridgway EC 1997. Pit-1 and GATA-2 interact and functionally cooperate to activate the thyrotropin β-subunit promoter. J Biol Chem 272: 24339–24347 [DOI] [PubMed] [Google Scholar]
- Guo F, Bakal K, Minokoshi Y, Hollenberg AN 2004. Leptin signaling targets the thyrotropin-releasing hormone gene promoter in vivo. Endocrinology 145: 2221–2227 [DOI] [PubMed] [Google Scholar]
- Han MS, Jung DY, Morel C, Lakhani SA, Kim JK, Flavell RA, Davis RJ 2013. JNK expression by macrophages promotes obesity-induced insulin resistance and inflammation. Science 339: 218–222 [DOI] [PMC free article] [PubMed] [Google Scholar]
- Hirosumi J, Tuncman G, Chang L, Gorgun CZ, Uysal KT, Maeda K, Karin M, Hotamisligil GS 2002. A central role for JNK in obesity and insulin resistance. Nature 420: 333–336 [DOI] [PubMed] [Google Scholar]
- Holzer RG, Park EJ, Li N, Tran H, Chen M, Choi C, Solinas G, Karin M 2011. Saturated fatty acids induce c-Src clustering within membrane subdomains, leading to JNK activation. Cell 147: 173–184 [DOI] [PMC free article] [PubMed] [Google Scholar]
- Jaeschke A, Davis RJ 2007. Metabolic stress signaling mediated by mixed-lineage kinases. Mol Cell 27: 498–508 [DOI] [PMC free article] [PubMed] [Google Scholar]
- Kahn SE, Hull RL, Utzschneider KM 2006. Mechanisms linking obesity to insulin resistance and type 2 diabetes. Nature 444: 840–846 [DOI] [PubMed] [Google Scholar]
- Kakucska I, Rand W, Lechan RM 1992. Thyrotropin-releasing hormone gene expression in the hypothalamic paraventricular nucleus is dependent upon feedback regulation by both triiodothyronine and thyroxine. Endocrinology 130: 2845–2850 [DOI] [PubMed] [Google Scholar]
- Kant S, Barrett T, Vertii A, Noh YH, Jung DY, Kim JK, Davis RJ 2013. Role of the mixed-lineage protein kinase pathway in the metabolic stress response to obesity. Cell reports 4: 681–688 [DOI] [PMC free article] [PubMed] [Google Scholar]
- Koenig RJ, Leonard JL, Senator D, Rappaport N, Watson AY, Larsen PR 1984. Regulation of thyroxine 5′-deiodinase activity by 3,5,3′-triiodothyronine in cultured rat anterior pituitary cells. Endocrinology 115: 324–329 [DOI] [PubMed] [Google Scholar]
- Magner JA 1990. Thyroid-stimulating hormone: Biosynthesis, cell biology, and bioactivity. Endocr Rev 11: 354–385 [DOI] [PubMed] [Google Scholar]
- Nazar M, Nicola JP, Velez ML, Pellizas CG, Masini-Repiso AM 2012. Thyroid peroxidase gene expression is induced by lipopolysaccharide involving nuclear factor (NF)-κB p65 subunit phosphorylation. Endocrinology 153: 6114–6125 [DOI] [PubMed] [Google Scholar]
- Nicola JP, Velez ML, Lucero AM, Fozzatti L, Pellizas CG, Masini-Repiso AM 2009. Functional toll-like receptor 4 conferring lipopolysaccharide responsiveness is expressed in thyroid cells. Endocrinology 150: 500–508 [DOI] [PubMed] [Google Scholar]
- Nillni EA, Vaslet C, Harris M, Hollenberg A, Bjorbak C, Flier JS 2000. Leptin regulates prothyrotropin-releasing hormone biosynthesis. Evidence for direct and indirect pathways. J Biol Chem 275: 36124–36133 [DOI] [PubMed] [Google Scholar]
- Perello M, Cakir I, Cyr NE, Romero A, Stuart RC, Chiappini F, Hollenberg AN, Nillni EA 2010. Maintenance of the thyroid axis during diet-induced obesity in rodents is controlled at the central level. Am J Physiol Endocrinol Metab 299: E976–E989 [DOI] [PMC free article] [PubMed] [Google Scholar]
- Rodriguez EM, Blazquez JL, Pastor FE, Pelaez B, Pena P, Peruzzo B, Amat P 2005. Hypothalamic tanycytes: A key component of brain-endocrine interaction. Int Rev Cytol 247: 89. [DOI] [PubMed] [Google Scholar]
- Sabio G, Davis RJ 2010. cJun NH2-terminal kinase 1 (JNK1): Roles in metabolic regulation of insulin resistance. Trends Biochem Sci 35: 490–496 [DOI] [PMC free article] [PubMed] [Google Scholar]
- Sabio G, Das M, Mora A, Zhang Z, Jun JY, Ko HJ, Barrett T, Kim JK, Davis RJ 2008. A stress signaling pathway in adipose tissue regulates hepatic insulin resistance. Science 322: 1539–1543 [DOI] [PMC free article] [PubMed] [Google Scholar]
- Sabio G, Cavanagh-Kyros J, Ko HJ, Jung DY, Gray S, Jun JY, Barrett T, Mora A, Kim JK, Davis RJ 2009. Prevention of steatosis by hepatic JNK1. Cell Metab 10: 491–498 [DOI] [PMC free article] [PubMed] [Google Scholar]
- Sabio G, Cavanagh-Kyros J, Barrett T, Jung DY, Ko HJ, Ong H, Morel C, Mora A, Reilly J, Kim JK, et al. 2010a. Role of the hypothalamic–pituitary–thyroid axis in metabolic regulation by JNK1. Genes Dev 24: 256–264 [DOI] [PMC free article] [PubMed] [Google Scholar]
- Sabio G, Kennedy NJ, Cavanagh-Kyros J, Jung DY, Ko HJ, Ong H, Barrett T, Kim JK, Davis RJ 2010b. Role of muscle c-Jun NH2-terminal kinase 1 in obesity-induced insulin resistance. Mol Cell Biol 30: 106–115 [DOI] [PMC free article] [PubMed] [Google Scholar]
- Schneider MJ, Fiering SN, Pallud SE, Parlow AF, St Germain DL, Galton VA 2001. Targeted disruption of the type 2 selenodeiodinase gene (DIO2) results in a phenotype of pituitary resistance to T4. Mol Endocrinol 15: 2137–2148 [DOI] [PubMed] [Google Scholar]
- Segerson TP, Kauer J, Wolfe HC, Mobtaker H, Wu P, Jackson IM, Lechan RM 1987. Thyroid hormone regulates TRH biosynthesis in the paraventricular nucleus of the rat hypothalamus. Science 238: 78–80 [DOI] [PubMed] [Google Scholar]
- Silva JE, Larsen PR 1977. Pituitary nuclear 3,5,3′-triiodothyronine and thyrotropin secretion: An explanation for the effect of thyroxine. Science 198: 617–620 [DOI] [PubMed] [Google Scholar]
- Talukdar S, Olefsky JM, Osborn O 2011. Targeting GPR120 and other fatty acid-sensing GPCRs ameliorates insulin resistance and inflammatory diseases. Trends Pharmacol Sci 32: 543–550 [DOI] [PMC free article] [PubMed] [Google Scholar]
- Velez ML, Costamagna E, Kimura ET, Fozzatti L, Pellizas CG, Montesinos MM, Lucero AM, Coleoni AH, Santisteban P, Masini-Repiso AM 2006. Bacterial lipopolysaccharide stimulates the thyrotropin-dependent thyroglobulin gene expression at the transcriptional level by involving the transcription factors thyroid transcription factor-1 and paired box domain transcription factor 8. Endocrinology 147: 3260–3275 [DOI] [PubMed] [Google Scholar]
- Ventura JJ, Kennedy NJ, Lamb JA, Flavell RA, Davis RJ 2003. c-Jun NH(2)-terminal kinase is essential for the regulation of AP-1 by tumor necrosis factor. Mol Cell Biol 23: 2871–2882 [DOI] [PMC free article] [PubMed] [Google Scholar]
- Visser WE, Friesema EC, Visser TJ 2011. Minireview: Thyroid hormone transporters: The knowns and the unknowns. Mol Endocrinol 25: 1–14 [DOI] [PMC free article] [PubMed] [Google Scholar]
- Weintraub BD, Gesundheit N, Taylor T, Gyves PW 1989. Effect of TRH on TSH glycosylation and biological action. Ann N Y Acad Sci 553: 205–213 [DOI] [PubMed] [Google Scholar]
- World Health Organization Consultation on Obesity 2000. Obesity: Preventing and managing the global epidemic. Report of a WHO consultation. World Health Organ Tech Rep Ser 894: 1–253 [PubMed] [Google Scholar]


