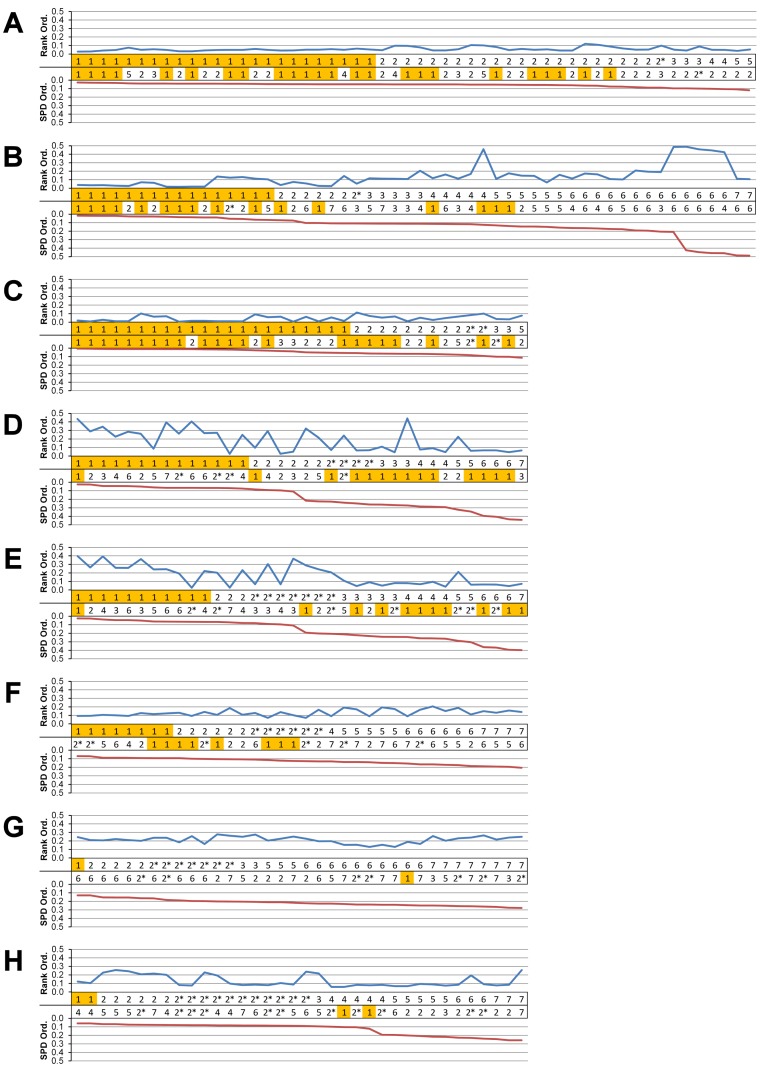
Figure 5. Standard pattern difference summary.
Standard pattern difference (SPD) is the difference in values of standard pattern for individual species models between condition pairs within comparative sets, i.e., the difference in the relative performance of each species model to M. cataphractus. Between comparison sets (e.g. HET vs HOM) the average SPD of all species models is calculated for each condition-pair giving an overall measure of pattern difference. For each comparison set this average SPD for each condition is plotted two ways: (1) ‘Rank Order’ (above central horizontal line) orders conditions from best to worst (left to right) consistency in predictive rank (blue trace), where predictions of rank for each condition comparison are numbered according to whether 1, 2, 3, 4, 5, 6, or 7 species models had different ranks (1 indicates identical predictions - coloured orange); (2) ‘SPD Order’ orders conditions from lowest to highest (left to right) average SPD (red trace). High absolute values of either the red or blue traces indicate large (averaged across all species models) differences in standard pattern, i.e., large differences in relative performance. Ordering SPD in these two ways allows visualisation of the correlation between predictive rank and overall differences in the pattern of results. This figure summarises the broad trends in SPD. However, for greater details see the supplementary figures indicated in the following: (A) isotropic heterogeneous vs isotropic homogeneous material properties (Fig. S2), (B) Linear Load Case comparisons (Fig. S10), (C) volume- vs surface-scaling (Fig. S6), (D) volume- vs length-scaling (Fig. S7), (E) surface- vs length-scaling (Fig. S8), (F) front vs mid bite positions (Fig. S14), (G) front vs back bite positions (Fig. S15), (H) mid vs back bite positions (Fig. S16). Note that linear load case comparisons (B) and all bite position comparisons (F–H) have a bigger effect on the results than material properties (A) or volume vs surface area scaling (D).

