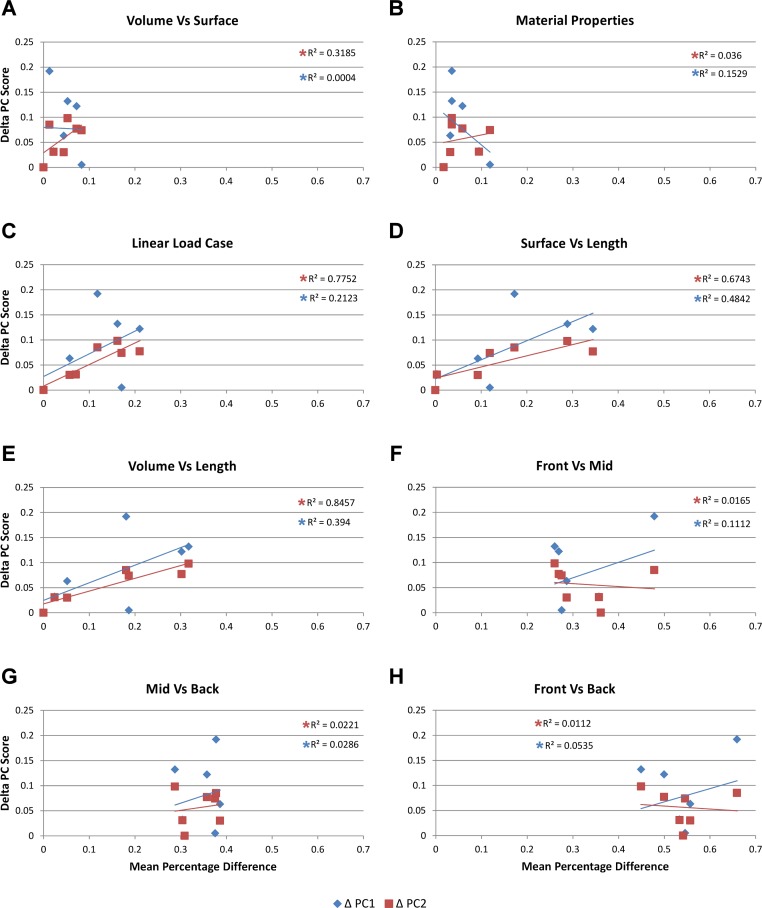
Figure 6. Mean percentage difference for each modelling factor vs PC scores.
The relative difference in shape is calculated using principal component values (PC1 and PC2) from Walmsley et al. (2013) by taking the difference between all species models to that of M. cataphractus for PC1 and PC2, yielding a ΔPC1 and ΔPC2 value for each species model. These are plotted against the mean percentage difference values of each species for each comparison set. Note the good correlation with shape for Linear Load Cases, surface- vs length-scaling, and volume- vs length-scaling for ΔPC2 measures of shape. (A) Volume- vs surface-scaling, (B) isotropic heterogeneous vs isotropic homogeneous material properties, (C) TeT/MeM vs NoLLC/ELA Linear Load Cases, (D) surface- vs length-scaling, (E) volume- vs length-scaling, (F) front vs mid bite position, (G) mid vs back bite position, (H) front vs back bite position. Note that TeT (‘tooth equals tooth’), NoLLC (‘no linear load case’), ELA (‘equal lever arm’), and MeM (‘moment equals moment’) each indicate the type of linear load case used in the simulation. Under biting, TeT simulates all species biting with identical ‘resultant’ bite force to M. cataphractus, while NoLLC simulates all species biting at their maximal muscle force. Under shaking, TeT simulates an identical magnitude of shake force to M. cataphractus, while ELA simulates shaking prey of identical mass at the same frequency. Under twisting, MeM simulates an identical magnitude of twisting force, while ELA simulates a constant ratio of skull width to twisting force between each species.

