

Abstract
Objectives. We investigated whether periodic increases in minimum alcohol prices were associated with reduced alcohol-attributable hospital admissions in British Columbia.
Methods. The longitudinal panel study (2002–2009) incorporated minimum alcohol prices, density of alcohol outlets, and age- and gender-standardized rates of acute, chronic, and 100% alcohol-attributable admissions. We applied mixed-method regression models to data from 89 geographic areas of British Columbia across 32 time periods, adjusting for spatial and temporal autocorrelation, moving average effects, season, and a range of economic and social variables.
Results. A 10% increase in the average minimum price of all alcoholic beverages was associated with an 8.95% decrease in acute alcohol-attributable admissions and a 9.22% reduction in chronic alcohol-attributable admissions 2 years later. A Can$ 0.10 increase in average minimum price would prevent 166 acute admissions in the 1st year and 275 chronic admissions 2 years later. We also estimated significant, though smaller, adverse impacts of increased private liquor store density on hospital admission rates for all types of alcohol-attributable admissions.
Conclusions. Significant health benefits were observed when minimum alcohol prices in British Columbia were increased. By contrast, adverse health outcomes were associated with an expansion of private liquor stores.
Approximately 9.2% of the global burden of disease and injury in the World Health Organization Americas Region is attributable to alcohol, with a higher proportion in developed countries.1 Causal relationships have been established between alcohol use and liver diseases, epilepsy, poisonings, road traffic injuries, assault injuries, several types of cancer, and many other acute and chronic health outcomes. Alcohol is also estimated to be the third highest risk factor for disease and disability globally and the highest in the World Health Organization Americas Region.2
Increases in the price of alcohol, whether through taxation or by other means, have been well established to effectively reduce the burden of disease and injury.3,4 However, increasing the price of alcohol across the board is often unpopular, especially among populations with high levels of consumption.5 There is increasing interest in minimum pricing as a more targeted strategy that may meet with less popular and political opposition. Using various published data sources and evidence that heavier drinkers tend to pay less per unit of alcohol than lighter drinkers,6,7 the health and economic impacts of setting different minimum prices have been modeled for different populations of interest.7,8 Recently, the Scottish Parliament passed legislation to set a minimum price of £0.50 per 8-gram unit of alcohol9 by April 2013 and the UK government also announced its intention of introducing a £0.45 minimum price per unit for England and Wales.10 To date, however, no direct empirical studies have been conducted on the effectiveness of minimum prices as a means of reducing alcohol-related harm.
The relationship between alcohol pricing, consumption, and related harms11–14 is well established, but scant research has been concerned with minimum alcohol prices specifically. Gruenewald et al.15 showed that Swedish drinkers compensated for price increases by shifting consumption to brands with low cost relative to alcohol content. They hypothesized that those already drinking cheap alcohol would be less able to make this compensation and so were more likely to reduce consumption.15 In most Canadian provinces, government alcohol monopolies set floor or minimum prices for alcoholic drinks. A recent analysis of a 20-year data series from British Columbia generated the estimate that each 10% increase in average minimum alcohol prices yielded a net 3.4% decrease in alcohol consumption.16 Using a time series of 52 financial periods across 4 years from Saskatchewan, researchers estimated that a 10% increase in average minimum price was associated with an 8.4% reduction in total alcohol consumption,17 with larger impacts on higher strength beverages. The greater impact in Saskatchewan was attributed to minimum prices being applied comprehensively to all drinks with adjustment for beverage strength. The decrease in alcohol consumption was also noted to have been obtained alongside a simultaneous increase in government revenue from alcohol.16
We explored associations between minimum alcohol prices and rates of alcohol-attributable hospital admissions in British Columbia (BC), a Western Canadian province with a population in 2012 of 4.6 million. We exploited the availability of uniquely detailed data on alcohol outlets and rates of hospital admission arranged across 89 geographic areas (local health areas [LHAs]) and 32 time points over 8 years. We adjusted for large co-occurring changes in the number of privately owned liquor stores associated with the partial privatization of the BC government alcohol monopoly.18 These adjustments were necessary because rates of private liquor stores per head of population are known to predict increased per capita alcohol consumption18 and alcohol-related mortality.19 Canadian alcohol monopolies set and update minimum retail prices for alcohol sold in government-owned liquor stores in most provinces. These same prices also determine what the government charges when it distributes alcohol to private liquor stores, bars, and restaurants. In British Columbia, bar and restaurant owners must pay the same prices as customers of government liquor stores, whereas owners of private liquor stores currently receive a 16% discount on these prices. Final retail prices in these private establishments, however, vary at the discretion of their owners and differ significantly from prices in government liquor stores.20 Thus, because the effect of minimum prices in a particular area is likely to be highly influenced by the number and type of local liquor outlets, we chose to measure and adjust for variation in this critical factor in our study of how minimum price changes are associated with rates of alcohol-related harm.
Both theoretical and empirical reasons exist to suppose that alcohol price changes might have a more immediate effect on acute morbidity (e.g., injuries and poisonings) than on gradually developing chronic diseases (e.g., cancers and liver disease). Some previous population-level studies exploring relationships between per capita alcohol consumption and different alcohol-related diseases have reported delayed or lagged effects for chronic diseases associated with heavy alcohol consumption.21 Immediate associations, however, might be expected between price changes and rates of acute alcohol-related harm, such as injuries and poisonings caused by the short-term effects of heavy alcohol consumption. This distinction between acute and chronic harm was supported in an Australian study that found evidence for immediate impacts of alcohol price increase on acute but not chronic alcohol-attributable mortality.22 Another consideration is that the use of the attributable fraction methodology involves adjustments for rates of population consumption.23 Such adjustments are not required for conditions that are wholly or 100% alcohol caused such as alcoholic gastritis and alcoholic pancreatitis. For each of these reasons, we partitioned our outcome variable of interest, rate of alcohol-attributable admissions, into acute events, chronic diseases, and 100% alcohol-attributable conditions because they may react differently to price changes.22
In this study, we hypothesized that minimum price increases would be associated with (1) more immediate decreases in acute alcohol-attributable admissions, (2) delayed decreases in chronic alcohol-attributable admissions, and (3) delayed decreases in 100% alcohol-attributable admissions because these conditions are mostly associated with the long-term consequences of hazardous alcohol use. In the event that delayed or lagged effects were identified, we sought to pinpoint the time periods over which these applied. Additionally, we hypothesized that changes in the rate of private liquor stores per 100 000 residents would be positively related to changes in rates of all alcohol-attributable admissions.
METHODS
We designed a cross-sectional (89 LHAs) versus time-series (32 annual quarters, 2002–2009) panel study24 with adjustment for density of different liquor outlets, temporal trends, season, socioeconomic and demographic characteristics, and spatial and temporal autocorrelation. The LHAs are nested within 16 larger health service delivery areas (HSDAs). The analyses measured and corrected for the effect of correlation between LHA-level values of dependent variables within each HSDA.
Data Sources
Alcohol-attributable hospital admissions.
We estimated alcohol-attributable completed hospital admissions by applying population alcohol-attributable fractions (AAFs) to admission data for 60 categories of disease and injury.2 For non-100% alcohol-attributable diseases, we calculated AAFs from the level of exposure to alcohol and the risk relations between consumption and different disease categories using the formula
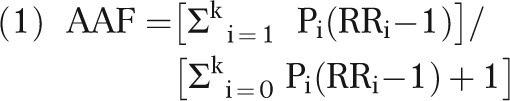 |
where k = total levels of exposure; i = exposure category, with baseline exposure or no exposure i = 0; RRi = relative risk at exposure level i compared with no consumption; and Pi = prevalence of the ith category of exposure
We obtained relative risk estimates from published meta-analyses25,26 and prevalence data on drinking behaviors from the 2004 Canadian Addiction Survey.27 For injuries attributable to alcohol, we based alcohol-attributable fractions on direct estimates of alcohol involvement from the published literature.25 Alcohol-attributable fractions were multiplied with overall numbers of completed hospital admissions (i.e., those that had resulted in a discharge) for each International Classification of Diseases-1028 code and summed to obtain the total burden of disease from alcohol by age and gender for each of the 89 LHAs.
The BC Ministry of Health provided data for the relevant International Classification of Diseases-10 codes (see Appendix A, available as a supplement to the online version of this article at http://www.ajph.org, and Rehm et al.25) using the most responsible diagnosis by 5-year age group, gender, LHA, and quarter.
We adjusted the survey-based estimates of alcohol exposure for underestimation by comparison with local per capita alcohol consumption for each of 5 BC health authorities29; the overall method is described in more detail elsewhere.30 Rates of alcohol-attributable admissions were age and gender standardized with reference to the 2001 BC population.31
Minimum alcohol prices.
We obtained minimum alcohol prices from the Liquor Distribution Branch of the BC Ministry of Public Safety and Solicitor General.16 During the study, spirit minimum prices increased in 4 increments from Can$ 25.91 to Can$ 30.66 per liter of beverage, and packaged and draft beer prices each increased in increments from Can$ 3.00 and Can$ 2.05, respectively, to Can$ 3.54 and Can$ 2.22. Other minimum prices were unchanged. We then recalculated mean minimum prices as dollar values per standard drink (17.05 ml ethanol) using precise estimates of mean percentage of alcohol content for each main beverage type, adjusted by the Consumer Price Index.16
Alcohol outlet data.
We obtained the number of restaurants, bars, and government and private liquor stores from the BC Liquor Distribution Branch for each of the 89 LHAs and 32 time periods.
Population data.
We obtained population data for each LHA from BC STATS32 to calculate the rates of admissions per 100 000 population and alcohol outlet densities per 100 000 residents aged 15 years and older for these areas. The population data projected and estimated by BC STATS combines information33 from the 2006 Census of Canada along with population projections for non-census years.
Socioeconomic data.
Socioeconomic and demographic variables likely to confound the relationships of interest were included in the models.18,19 We took from the 2006 Canadian census percentages of individuals who were aboriginal, were visible minorities, did not complete high school, and were in different household income brackets for each area. Population densities were calculated as total population divided by land area (km2).
Spatial data.
We obtained BC government data for LHA administrative areal units from DataBC.34 The geometric center (centroid) of each area was computed and included in the models. We used the centroids from the LHAs to incorporate spatial dependence in the model by using the distance between centroids to develop the spatial covariance structure using a semivariogram function.35
Statistical Analyses
A number of preparatory analyses were conducted. We computed Moran’s I for annual alcohol-attributable admission rates to test for spatial autocorrelation in these data and analyzed annual alcohol-attributable admission rates to examine trend changes using regression. We analyzed rates of age- and gender-standardized admissions using analysis of variance to examine seasonal differences. Bivariate regression was performed to examine the relationships between admissions and socioeconomic and demographic variables.
We then used mixed models,36 which provide straightforward but flexible methods for assessing spatial and temporal dynamics of longitudinal panels of data. More orthodox autoregressive integrated moving average models were not appropriate for these data because of (1) the need to adjust for variation in outlet density and other covariates across 89 geographic areas and (2) the availability of only 32 time periods. Mixed models permit tests of fixed effects through either maximum likelihood or restricted maximum likelihood estimation. These methods are superior to traditional repeated-measures analysis of variance because they allow simultaneous inference about spatial and temporal factors through the use of fixed and random effects and they also apply to a wide variety of covariance (correlation) structures. Thus, more appropriate covariance data structures can be analyzed. We included spatial and temporal autocorrelation effects in all models. Log transformations were applied when necessary to correct for significantly skewed distributions and make the variance stationary for dependent variables. Adjustments for temporal autocorrelation were made if it was detected by the Durbin-Watson statistic. The equation for the mixed models was as follows:
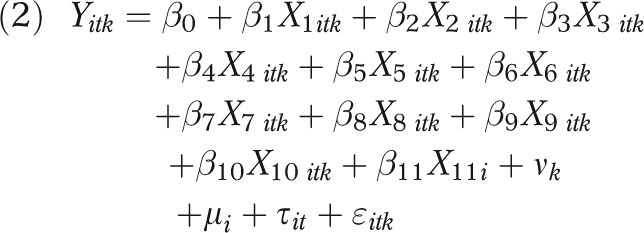 |
where i = 1–89 each LHA, t = 1–32 each time period, and k = 1–16 index values for each HSDA; Yitk is the rate of alcohol-attributable admissions at the ith LHA and kth HSDA at the tth annual quarter; β0 is the intercept; β1 is the percentage of change in rate of admissions resulting from a 1% increase in minimum price; X1itk is the Consumer Price Index–adjusted minimum price (Canadian dollars) per standard drink; and coefficients β2 to β10 represent the percentage of change in rate of alcohol-attributable admissions resulting from 1% increases in all other independent variables (i.e., the density of restaurants, government stores, and private stores and bars; percentages of the population that are aboriginal, visible minorities, high school completers, and in different income brackets; population density), the values for which are all represented by X2itk to X10itk. In addition, β11 is the estimated effect for the trend X11i (i.e., year); νk is the variance component for HSDA;  is the variance component for LHA; τit is the spatial and temporal autocorrelation effect; and ɛitk is the error term.
We conducted all statistical analyses using SAS version 9.3 (SAS Institute, Cary, NC).37 All significance tests assumed 2-tailed P values or 95% confidence intervals.
RESULTS
During the study period, alcohol-attributable admissions numbered 142 615, of which 48.07% were acute and 51.93% were chronic. Across all cases (acute and chronic), 17.57% were 100% alcohol-attributable admissions. Unadjusted rates for these different outcomes are summarized in Appendix B (available as a supplement to the online version of this article at http://www.ajph.org) for each of 16 HSDAs of British Columbia. The analysis of variance identified significant variance in these rates by both HSDA and LHA (P < .001 in each case). Unadjusted acute, chronic, 100%, and total alcohol-attributable admission rates each showed significantly increasing trends over the study period (P = .003, P < .001, P = .016, and P < .001, respectively). Rates of alcohol-attributable admissions were significantly associated with the percentage of population that was aboriginal, was a visible minority, and had not completed high school. Lower population density and higher family income were also significant predictors (P < .001 in each case). Moran’s I autocorrelation analyses identified significant spatial autocorrelation on rates at each centroid for each type of alcohol-attributable admission rate on the basis of a distance-defined neighborhood (P < .001 in each case). Durbin-Watson tests for rates of acute, 100%, and total alcohol-attributable admissions were also significant, confirming the presence of fourth-order temporal autocorrelation, corresponding to regular seasonal variation (P < .005 in each case).
The estimates in Table 1 fully adjusted for these spatial and temporal relationships and indicated that a 10% increase in minimum prices was significantly associated with an immediate 8.95% reduction in acute alcohol-attributable admissions but not with significant reductions in chronic or 100% alcohol-attributable admissions. This overall negative association is consistent with the unadjusted trends summarized in Figure 1, which depicts fluctuations in rates of deseasonalized acute alcohol-attributable admissions along with average minimum prices. The figure shows minimum prices initially declining in value and acute alcohol-attributable admissions increasing sharply, followed by a period when minimum prices first increased and then maintained their value, whereas the increase in alcohol-attributable admissions was stemmed. The model further estimated that a 10% increase in the density of private liquor stores was associated with small but significant increases in acute (1.00%), chronic (1.61%), 100% (1.43%), and total (1.26%) alcohol-attributable admissions. Conversely, we found that acute alcohol-attributable admissions were negatively associated with the density of government liquor stores. In most instances, controlling for the density of liquor outlets reduced estimates of the size of the association between minimum prices and alcohol-attributable admissions.
TABLE 1—
Estimated Associations Between Both Average Minimum Price for All Beverages (Can$/Standard Drink) and Different Types of Alcohol Outlet Density With Rates of Alcohol-Attributable Hospital Admission: British Columbia, 2002–2009
| Outlet Densities and Min. Price | Model 1,a B (95% CI) | Model 2,a B (95% CI) | Model 3,a B (95% CI) |
| Models for acute alcohol-attributable hospital admissions | |||
| Restaurants | 0.006 (−0.055, 0.067) | −0.004 (−0.066, 0.057) | |
| Government stores | −0.116 (−0.183, −0.049) | -0.118** (-0.185, −0.051) | |
| Bars | 0.009 (−0.080, 0.097) | 0.022 (−0.066, 0.111) | |
| Private stores | 0.124*** (0.064, 0.184) | 0.100** (0.037, 0.162) | |
| Min. price | -1.141*** (−1.759, −0.523) | -0.895** (−1.544, −0.246) | |
| Models for chronic alcohol-attributable hospital admissions | |||
| Restaurants | −0.008 (−0.086, 0.070) | −0.000 (−0.079, 0.078) | |
| Government stores | −0.022 (−0.119, 0.076) | −0.021 (−0.121, 0.079) | |
| Bars | −0.002 (−0.122, 0.117) | −0.015 (−0.136, 0.107) | |
| Private stores | 0.145*** (0.066, 0.223) | 0.161*** (0.079, 0.243) | |
| Min. price | 0.060 (−0.713, 0.833) | 0.531 (−0.284, 1.346) | |
| Models for 100% alcohol-attributable hospital admissions | |||
| Restaurants | −0.009 (−0.119, 0.100) | −0.003 (−0.114, 0.107) | |
| Government stores | 0.070 (−0.058, 0.198) | 0.071 (−0.057, 0.199) | |
| Bars | 0.058 (−0.105, 0.220) | 0.051 (−0.113, 0.214) | |
| Private stores | 0.130* (0.021, 0.239) | 0.143* (0.030, 0.257) | |
| Min. price | 0.036 (−1.062, 1.134) | 0.501 (−0.658, 1.660) | |
| Models for total alcohol-attributable hospital admissions | |||
| Restaurants | −0.016 (−0.070, 0.037) | −0.017 (−0.072, 0.037) | |
| Government stores | −0.033 (−0.103, 0.037) | −0.032 (−0.104, 0.039) | |
| Bars | 0.016 (−0.068, 0.100) | 0.015 (−0.070, 0.100) | |
| Private stores | 0.129*** (0.075, 0.184) | 0.126*** (0.068, 0.183) | |
| Min. price | −0.469 (−1.005, 0.067) | −0.146 (−0.710, 0.418) |
Note. CI = confidence interval; min. = minimum. Standard drink = 17.05 ml.
All the estimates in models 1, 2, and 3 are adjusted for trend (time = 1,…,32), seasonality (deseasonalized), age and gender (age–gender standardization), percentage of aboriginal to total population, percentage of visible minorities to total population, population density, family income, percentage of population aged 25–54 years without high school completion, spatial and temporal effects. Both alcohol outlet densities and minimum price included in model 3.
*P < .05 **P < .01 ***P < .001.
FIGURE 1—

Rates of acute alcohol-attributable hospital admission and CPI-adjusted minimum alcohol prices: British Columbia, 2002–2009.
Note. CPI = Consumer Price Index. Hospital admission rates and minimum prices are negatively associated (B = −0.895; P < .01).
Table 2 presents results from analyses similar to those presented in Table 1, but allowing for minimum prices to have both immediate effects and impacts lagged by as many as 12 quarters. We found some significant lagged effects of minimum prices on chronic and total alcohol-attributable admissions for almost 3 years after price changes. We also found significant lagged effects for minimum prices on acute alcohol-attributable admissions as much as 1 year postintervention.
TABLE 2—
Estimated Associations Between Minimum Alcohol Price Increases and Different Types of Alcohol-Attributable Hospital Admissions for Lags From 0 to 12 Annual Quarters: British Columbia, 2002–2009
| Lag Quarter | Acute, B (95% CI) | Chronic, B (95% CI) | 100% Attributable, B (95% CI) | Total, B (95% CI) |
| 0 | -0.895** (-1.544, -0.246) | 0.531 (-0.284, 1.346) | 0.501 (-0.658, 1.660) | 0.710 (0.146, 1.274) |
| 1 | -1.166*** (-1.816, 0.516) | 0.154 (-0.660, 0.968) | 0.479 (-0.678, 1.636) | -0.475 (-1.039, 0.089) |
| 2 | -0.557 (-1.204, 0.090) | 0.573 (-0.233, 1.379) | 0.364 (-0.791, 1.519) | 0.018 (-0.540, 0.576) |
| 3 | -0.749* (-1.393, -0.105) | 0.565 (-0.238, 1.368) | 0.095 (-1.053, 1.243) | 0.049 (-0.509, 0.607) |
| 4 | -0.861** (-1.500, -0.222) | 0.201 (-0.594, 0.996) | 0.851 (-0.291, 1.993) | -0.327 (-0.878, 0.224) |
| 5 | -0.251 (-0.885, 0.383) | 0.197 (-0.603, 0.997) | 0.448 (-0.701, 1.597) | -0.044 (-0.594, 0.506) |
| 6 | 0.217 (-0.415, 0.849) | -0.171 (-0.971, 0.629) | -0.031 (-1.179, 1.117) | 0.018 (-0.530, 0.566) |
| 7 | 0.181 (-0.457, 0.819) | -0.408 (-1.205, 0.389) | 0.084 (-1.054, 1.222) | -0.132 (-0.680, 0.416) |
| 8 | 0.167 (-0.481, 0.815) | -0.922* (-1.738, -0.106) | -0.421 (-1.601, 0.759) | -0.463 (-1.020, 0.094) |
| 9 | 0.131 (-0.524, 0.786) | -1.090** (-1.911, -0.269) | -0.994 (-2.187, 0.199) | -0.585* (-1.145, -0.025) |
| 10 | 0.029 (-0.627, 0.685) | -0.500 (-1.321, 0.321) | -0.455 (-1.649, 0.739) | -0.220 (-0.782, 0.342) |
| 11 | -0.098 (-0.770, 0.574) | -0.942* (-1.768, -0.116) | -0.246 (-1.454, 0.962) | -0.594* (-1.166, -0.022) |
| 12 | 0.318 (-0.389, 1.025) | -0.812 (-1.671, 0.047) | -0.725 (-1.988, 0.538) | -0.397 (-0.987, 0.193) |
Note. CI = confidence interval. Estimates are interpreted as percentage changes of alcohol-attributable hospital admission as minimum alcohol prices increase by 1%. All the estimates adjusted for trend (time = 1, …, 32), seasonality (deseasonalized), alcohol outlet densities, percentage of aboriginal to total population, percentage of visible minorities, percentage of population without high school completion, family income, population density, spatial and temporal effects.
*P < .05; **P < .01; ***P < .001.
Table 3 presents estimates of how many admissions per year might be prevented were minimum prices set at Can$ 1.25, 1.35, or 1.45 per standard drink, applying the results of the models presented in Table 2. We estimated that setting a fixed minimum price of Can$ 1.35 per drink (approximately a Can$ 0.20 increase compared with present prices) would be associated with an immediate reduction of 726 cases or 8.47% of acute alcohol-attributable admissions and a reduction in 997 cases or 10.77% of chronic alcohol-attributable admissions 2 years later. More alcohol-attributable admissions might be prevented if minimum prices were set at Can$ 1.45 per standard drink. We also estimated that a 0.12% increase in acute, a 0.19% increase in chronic, and 0.17% increase in 100% alcohol-attributable hospital admissions would occur if the province had 10 extra private liquor stores.
TABLE 3—
Estimated Numbers and Percentages of Alcohol-Attributable Hospital Admissions per Year That Would Be Prevented in British Columbia if Minimum Prices Were Set at Can$ 1.25, Can$ 1.35, or Can$ 1.45 per Standard Drink
| Alcohol-Attributable Hospital Admission Type/Impact | Mean No. of Hospital Admissions/Year | Minimum Price per Canadian Standard Drink |
||
| Can$ 1.25/Drink, No. (%)a | Can$ 1.35/Drink, No. (%)a | Can$ 1.45/Drink, No. (%)a | ||
| Acute/estimated immediate impact | 8569 | −166 (−1.94) | −726 (−8.47) | −1212 (−14.14) |
| Chronic/estimated additional impact after 2 y | 9258 | −275 (−2.97) | −997 (−10.77) | −1616 (−17.46) |
Note. Standard drink = 17.05 ml ethanol. Prices are in 2011–2012 Canadian dollar values.
Annual number of alcohol-attributable hospital admissions that can be prevented and percentage of alcohol-attributable hospital admissions prevented to annual alcohol-attributable hospital admissions.
Model estimates reported in Appendix C (available as a supplement to the online version of this article at http://www.ajph.org) show that minimum price increases for several beverage types were associated with immediate and significant reductions in acute outcomes. We estimated that a 10% increase in the respective minimum prices would be associated with a 3.56% decrease in acute outcomes for packaged beer and a 16.15% decrease for packaged coolers and ciders. We also found significant 2-year lagged associations for spirits and liqueurs (−9.72%), wines (−34.16%), and packaged coolers and ciders (−32.79%) with acute alcohol-attributable admissions after 10% increases in the minimum prices of these beverages. We also found significant 2-year lagged effects for 10% increases in minimum price of packaged beer and draft beer beverages for chronic alcohol-attributable admissions (−4.87% and −10.93%).
DISCUSSION
This study adds to the limited evidence base regarding the specific policy of applying minimum prices to alcoholic beverages as a public health and safety measure. To date, modeling exercises using evidence-based assumptions have predicted that minimum pricing has significant public health benefits and has a particular impact on younger and heavier drinkers.7,8 As such, minimum pricing may garner more public support than across-the-board price or tax increases.38 Canadian research has found that minimum alcohol prices are associated with significant reductions in the consumption of most types of alcoholic beverage.16,17 We extended this line of investigation in British Columbia using detailed data over 8 calendar years for 89 LHAs to look at impacts on alcohol-attributable hospital admissions. After controlling for the effects of changing liquor outlet densities and a range of social, demographic, and economic variables, we found significant negative associations between minimum prices and rates of age- and gender-standardized alcohol-attributable admissions. After controlling for the effects of changes to minimum alcohol prices, we also found small but significant positive associations between the local area density of private liquor stores and rates of acute alcohol-attributable admissions, thus replicating earlier findings.18,19
A notable temporal pattern was evident in the results. We observed immediate impacts of price changes only for acute alcohol-attributable admissions, which accounted for 48% of all alcohol-attributable admissions. By contrast, chronic alcohol-attributable admissions involving serious diseases such as cancer and liver cirrhosis when combined as a group were only significantly associated (negatively in each case) with minimum alcohol prices after a period of between 2 and 3 years. Such an immediate impact being evident only for acute and not for chronic alcohol-attributable conditions has previously been identified in response to taxation increases in the Northern Territory of Australia.22 Conceptually, this pattern of results makes sense. Increases in Canadian minimum prices have already been demonstrated to be associated with simultaneous reductions in alcohol consumption.16,17 One might expect that acute admissions (which are dominated by injuries) would respond immediately, whereas diseases, which develop over a longer period of heavy consumption, might not be immediately responsive, at least collectively. Some exceptions to this pattern have been identified in US but not European studies of liver cirrhosis.39 The size of reductions in alcohol-attributable admissions observed are substantial and in each case disproportionate to the previously estimated reductions in per capita alcohol consumption in British Columbia. Thus, we estimated that a 10% increase in the average minimum price of all alcoholic drinks was usually associated with a 8.95% decrease in acute admissions compared with a 3.4% immediate reduction in per capita consumption.16 The delayed impacts estimated for chronic alcohol-attributable conditions were also large, with a 10% increase in average minimum price estimated to be associated with a 9.22% reduction in chronic alcohol-attributable admissions after 2 years. On the basis of these models, we estimated that increasing minimum prices from an average of Can$ 1.15 to Can$ 1.35 per Canadian standard drink would result in an immediate reduction of 726 acute admissions over 1 year (8.47%) and a further reduction of 997 chronic admissions over 1 year (10.77%) 2 years later. If minimum prices were to be maintained at these higher levels and adjusted with the cost of living, these lower rates of alcohol-related harm would also be maintained in future years.
Several limitations of our study need to be acknowledged. First, it was an ecological observational study, and we used no control area or province for comparison in the analysis. The analysis takes advantage of variations in the value of minimum prices both in general and of specific beverages over an 8-year period resulting from both government intervention and changes in the cost of living. Although efforts were made to control for a range of important sociodemographic and economic variables, unmeasured and therefore uncontrolled confounding that could influence the results is likely.
A strength of the study was the availability of detailed data on alcohol outlet densities and changes to minimum prices provided by the government alcohol monopoly. The analyses demonstrated partially confounding effects of outlet density on the relationship between minimum price and rates of alcohol-attributable admissions. Assessing these relationships across multiple areas with differing densities was therefore important to estimate the associations between minimum prices and rates of alcohol-related harms.
We conclude that the policy of setting and periodically increasing minimum alcohol prices is associated with significant reductions in both acute and chronic alcohol-attributable admissions in BC. We also confirm earlier findings of adverse public health impacts resulting from increasing densities of private liquor stores. We recommend that further studies be conducted to investigate other potential impacts of this policy on consumer spending, government revenue, rates of alcohol-related crime, and other health and social harms from alcohol. Concerns about possible unintended negative consequences such as increased consumption of non-beverage alcohol also need to be discussed.40
Acknowledgments
Funding for this research was provided by the Canadian Institutes for Health Research (operating grant 102627, “Does Minimum Pricing Reduce the Burden of Injury and Illness Attributable to Alcohol?”; principal investigator, T. S.).
We gratefully acknowledge access to data on minimum price on alcohol sales from the BC Liquor Distribution Branch and access to the data on provincial hospital admissions from the BC Ministry of Health and BC Centre for Disease Control.
Human Participant Protection
Human participant protection was not required because this research was conducted using secondary analysis of aggregated statistical data provided by the listed government agencies and no individual could be identified.
References
- 1.Rehm J, Mathers C, Popova S, Thavorncharoensap M, Teerawattananon Y, Patra J. Global burden of disease and injury and economic cost attributable to alcohol use and alcohol-use disorders. Lancet. 2009;373(9682):2223–2233. doi: 10.1016/S0140-6736(09)60746-7. [DOI] [PubMed] [Google Scholar]
- 2.World Health Organization. 2011. Global status report on alcohol and health. Available at: http://www.who.int/substance_abuse/publications/global_alcohol_report/msbgsruprofiles.pdf. Accessed March 5, 2012. [Google Scholar]
- 3.Toumbourou JW, Stockwell T, Neighbors C, Marlatt GA, Sturge J, Rehm J. Interventions to reduce harm associated with adolescent substance use. Lancet. 2007;369(9570):1391–1401. doi: 10.1016/S0140-6736(07)60369-9. [DOI] [PubMed] [Google Scholar]
- 4.Anderson P, Chisholm D, Fuhr DC. Effectiveness and cost-effectiveness of policies and programmes to reduce the harm caused by alcohol. Lancet. 2009;373(9682):2234–2246. doi: 10.1016/S0140-6736(09)60744-3. [DOI] [PubMed] [Google Scholar]
- 5.Macdonald S, Stockwell T, Luo JS. The relationship between alcohol problems, perceived risks and attitudes toward alcohol policy in Canada. Drug Alcohol Rev. 2011;30(6):652–658. doi: 10.1111/j.1465-3362.2010.00259.x. [DOI] [PubMed] [Google Scholar]
- 6.Kerr WC, Greenfield TK. Distribution of alcohol consumption and expenditures and the impact of improved measurement on coverage of alcohol sales in the 2000 National Alcohol Survey. Alcohol Clin Exp Res. 2007;31(10):1714–1722. doi: 10.1111/j.1530-0277.2007.00467.x. [DOI] [PubMed] [Google Scholar]
- 7.Meier PS, Purshouse R, Brennan A. Policy options for alcohol price regulation: the importance of modelling population heterogeneity. Addiction. 2010;105(3):383–393. doi: 10.1111/j.1360-0443.2009.02721.x. [DOI] [PubMed] [Google Scholar]
- 8.Purshouse RC, Meier PS, Brennan A, Taylor KB, Rafia R. Estimated effect of alcohol pricing policies on health and health economic outcomes in England: an epidemiological model. Lancet. 2010;375(9723):1355–1364. doi: 10.1016/S0140-6736(10)60058-X. [DOI] [PubMed] [Google Scholar]
- 9. Alcohol (minimum pricing) (Scotland) bill (SP Bill 4). 2011.
- 10. Minimum alcohol price planned for England and Wales. BBC News UK. March 23, 2012. Available at: http://www.bbc.co.uk/news/uk-17482035. Accessed April 5, 2013.
- 11.Cook PJ. Paying the Tab: The Economics of Alcohol Policy. Princeton, NJ: Princeton University Press; 2007. [Google Scholar]
- 12.Babor T, Caetano R, Casswell S . Alcohol: No Ordinary Commodity—Research and Public Policy. Oxford, UK: Oxford University Press; 2010. [Google Scholar]
- 13.Wagenaar AC, Salois MJ, Komro KA. Effects of beverage alcohol price and tax levels on drinking: a meta-analysis of 1003 estimates from 112 studies. Addiction. 2009;104(2):179–190. doi: 10.1111/j.1360-0443.2008.02438.x. [DOI] [PubMed] [Google Scholar]
- 14.Wagenaar AC, Tobler AL, Komro KA. Effects of alcohol tax and price policies on morbidity and mortality: a systematic review. Am J Public Health. 2010;100(11):2270–2278. doi: 10.2105/AJPH.2009.186007. [DOI] [PMC free article] [PubMed] [Google Scholar]
- 15.Gruenewald PJ, Ponicki WR, Holder HD, Romelsjo A. Alcohol prices, beverage quality, and the demand for alcohol: quality substitutions and price elasticities. Alcohol Clin Exp Res. 2006;30(1):96–105. doi: 10.1111/j.1530-0277.2006.00011.x. [DOI] [PubMed] [Google Scholar]
- 16.Stockwell T, Auld MC, Zhao JH, Martin G. Does minimum pricing reduce alcohol consumption? The experience of a Canadian province. Addiction. 2012;107(5):912–920. doi: 10.1111/j.1360-0443.2011.03763.x. [DOI] [PubMed] [Google Scholar]
- 17.Stockwell T, Zhao J, Giesbrecht N, Macdonald S, Thomas G, Wettlaufer A. The raising of minimum alcohol prices in Saskatchewan, Canada: impacts on consumption and implications for public health. Am J Public Health. 2012;102(12):e103–e110. doi: 10.2105/AJPH.2012.301094. [DOI] [PMC free article] [PubMed] [Google Scholar]
- 18.Stockwell T, Zhao J, Macdonald S, Pakula B, Gruenewald P, Holder H. Changes in per capita alcohol sales during the partial privatization of British Columbia’s retail alcohol monopoly 2003-2008: a multi-level local area analysis. Addiction. 2009;104(11):1827–1836. doi: 10.1111/j.1360-0443.2009.02658.x. [DOI] [PubMed] [Google Scholar]
- 19.Stockwell T, Zhao JH, Macdonald S et al. Impact on alcohol-related mortality of a rapid rise in the density of private liquor outlets in British Columbia: a local area multi-level analysis. Addiction. 2011;106(4):768–776. doi: 10.1111/j.1360-0443.2010.03331.x. [DOI] [PubMed] [Google Scholar]
- 20.Treno AJ, Ponicki W, Stockwell T et al. Alcohol outlet densities and alcohol price: the British Columbia experiment in the partial privatization of alcohol sales off-premise. Alcohol Clin Exp Res. 2013 doi: 10.1111/acer.12065. Epub ahead of print. [DOI] [PMC free article] [PubMed] [Google Scholar]
- 21.Norström T, Skog OJ. Alcohol and mortality: methodological and analytical issues in aggregate analyses. Addiction. 2001;96(suppl 1):S5–S17. doi: 10.1080/09652140020021143. [DOI] [PubMed] [Google Scholar]
- 22.Chikritzhs T, Stockwell T, Pascal R. The impact of the Northern Territory’s Living with Alcohol Program, 1992-2002: revisiting the evaluation. Addiction. 2005;100(11):1625–1636. doi: 10.1111/j.1360-0443.2005.01234.x. [DOI] [PubMed] [Google Scholar]
- 23.Stockwell T, Chikritzhs T. International Guide for Monitoring Alcohol Consumption and Related Harm. Geneva, Switzerlands: World Health Organization; 2000. Available at: http://whqlibdoc.who.int/hq/2000/who_msd_msb_00.4.pdf. Accessed April 27, 2011. [Google Scholar]
- 24.Beck N. Time-series-cross-section data. Stat Neerl. 2001;55(2):111–133. [Google Scholar]
- 25.Rehm J, Baliunas D, Brochu S . Ottawa, Ontario, Canada: Canadian Centre on Substance Abuse; 2006. The cost of substance abuse in Canada 2002. Available at: http://koalicija.org/serveris/Metod_liter/Cost%20of%20substance%20abuse%20in%20Canada,%202002.pdf. Accessed April 30, 2012. [Google Scholar]
- 26.English DR, Holman CDJ, Milne E . The Quantification of Drug Caused Morbidity and Mortality in Australia. Canberra, Australian Capital Territory, Australia: Commonwealth Department of Human Services and Health; 1995. [Google Scholar]
- 27.Adlaf E, Ialomiteanu A. Canadian Addiction Survey 2004: Microdata eGuide. Ottawa, Ontario, Canada: Canadian Centre on Substance Abuse; 2005. Available at: http://www.ccsa.ca/2004%20CCSA%20Documents/ccsa-005363-2004.pdf. Accessed October 11, 2012. [Google Scholar]
- 28.World Health Organization. International Classification of Diseases, 10th Revision. Geneva, Switzerland: World Health Organization; 1980. [Google Scholar]
- 29.Stockwell T, Zhao J, Chikritzhs T, Greenfield TK. What did you drink yesterday? Public health relevance of a recent recall method used in the 2004 Australian National Drug Strategy Household Survey. Addiction. 2008;103(6):919–928. doi: 10.1111/j.1360-0443.2008.02219.x. [DOI] [PMC free article] [PubMed] [Google Scholar]
- 30.Buxton J, Stockwell T. Tracking trends of alcohol, illicit drugs and tobacco use through morbidity data. Contemp Drug Probl. 2009;36(3&4):485–498. [Google Scholar]
- 31.Lilienfeld DE, Stolley PD. Foundations of Epidemiology. 3rd. Oxford, UK: Oxford University Press; 1994. [Google Scholar]
- 32.BC Stats; 2012. Population estimates. Available at: http://www.bcstats.gov.bc.ca/StatisticsBySubject/Demography/PopulationEstimates.aspx. Accessed April 1, 2012. [Google Scholar]
- 33.BC Stats; 2011. Generalization estimation system (GES) small area population estimation method and error evaluation. Available at: http://www.bcstats.gov.bc.ca/StatisticsBySubject/Demography/TechnicalPapers.aspx. Accessed November 1, 2012. [Google Scholar]
- 34. Local health area boundaries. BC Stats. 2007. Available at: https://apps.gov.bc.ca/pub/geometadata/metadataDetail.do?recordUID=49698&recordSet=ISO19115. Accessed April 1, 2012.
- 35.Kleinschmidt I, Sharp BL, Clarke GPY, Curtis B, Fraser C. Use of generalized linear mixed models in the spatial analysis of small-area malaria incidence rates in KwaZulu Natal, South Africa. Am J Epidemiol. 2001;153(12):1213–1221. doi: 10.1093/aje/153.12.1213. [DOI] [PubMed] [Google Scholar]
- 36.Laird NM, Ware JH. Random-effects models for longitudinal data. Biometrics. 1982;38(4):963–974. [PubMed] [Google Scholar]
- 37.SAS Institute. SAS/STAT 9.3 User’s Guide. Cary, NC: SAS Institute, Inc.; 2011. Available at: http://support.sas.com/documentation/onlinedoc/stat/930/statug.pdf. Accessed August 25, 2012. [Google Scholar]
- 38.Thomas G. Price Policies to Reduce Alcohol-Related Harms in Canada: Current Context and Recommendations for Targeted Policies. Ottawa, Ontario, Canada: Canadian Centre on Substance Abuse; 2012. [Google Scholar]
- 39.Ponicki WR, Gruenewald PJ. The impact of alcohol taxation on liver cirrhosis mortality. J Stud Alcohol. 2006;67(6):934–938. doi: 10.15288/jsa.2006.67.934. [DOI] [PubMed] [Google Scholar]
- 40.Stockwell T, Williams N, Pauly B. Working and waiting: homeless drinkers responses to less affordable alcohol. Drug Alcohol Rev. 2012;31(6):823–824. doi: 10.1111/j.1465-3362.2012.00422.x. [DOI] [PubMed] [Google Scholar]