

Abstract
Background
Procollagen type III N-terminal peptide (P3NP) is released during collagen synthesis in muscle. Increased circulating P3NP is a marker not only of muscle growth, but also of muscle repair and fibrosis. Thus, P3NP may be a potential biomarker for sarcopenia.
Objective
To determine the association between plasma P3NP and lean mass and strength
Design, Setting, and Participants
A cross-sectional study of men and women from the Framingham Offspring Study. Participants included a convenience sample of 687 members with a measure of plasma P3NP and lean mass, and 806 members with P3NP and quadriceps strength assessment.
Measurements
Linear regression was used to estimate the association between total and appendicular lean mass and plasma P3NP, and quadriceps strength and P3NP
Results
Mean age was 58 years. Median plasma P3NP was similar in men (3.4 mg/L), premenopausal women (3.1 mg/L), and postmenopausal women (3.0 mg/L). In adjusted models, higher P3NP was associated with a modest decrease in total and appendicular lean mass in postmenopausal women [β= −0.13 unit P3NP/kg total lean mass; p=0.003]. A similar trend was found among premenopausal women, although results were not statistically significant [β=−0.10 unit P3NP/kg total lean mass; p=0.41]. No association between P3NP and lean mass was observed in men. P3NP was not associated with strength in men or women.
Conclusion
Our results suggest that plasma P3NP might be a useful biomarker of muscle mass in postmenopausal women if longitudinal studies demonstrate that it has adequate sensitivity and specificity to predict muscle loss.
Key terms: procollagen type III N-telopeptide, P3NP, lean mass
Introduction
Sarcopenia, which is characterized by reduced muscle mass and diminished muscle function [1,2], is common among elderly persons [3]. Although loss of lean mass may be a weak predictor of adverse health outcomes such as gait abnormalities and disability [4,5,6,7], muscle mass remains an important determinant of muscle function [8]. Despite the clinical significance of age-related declines in muscle mass and function, the mechanisms for this phenomenon are not fully understood, and to date, there are no approved therapies to maintain or improve muscle mass in older adults. The discovery of methods to identify persons at risk for loss of lean mass is therefore critical as they may lead to improved therapeutic options.
A potential biomarker to identify elders at risk for sarcopenia is procollagen III N-terminal peptide (P3NP). Procollagen type III is found abundantly in skeletal muscle and other soft tissues such as skin, and in negligible amounts in bone. During the late phases of collagen synthesis, the N-terminal end of procollagen type III is cleaved releasing P3NP into the circulation [9]. Thus, increased levels of P3NP have been observed during the normal increases in lean mass associated with puberty in adolescent boys and girls [10], as well as in response to endurance-type exercise in adult males [11].
High levels of P3NP have also been observed in pathologic conditions associated with abnormal collagen formation including congestive heart failure [12,13], hypertension [14], coronary artery disease [15], and cirrhosis[16]. In these diseases, it is postulated that inflammation leads to abnormal collagen synthesis and fibrosis of the associated soft tissues, which results in elevated P3NP levels [17]. With aging, healthy muscle fibers are lost and there is denervation of existing muscle fibers resulting in loss of muscle mass [2,18]. There is also an increase in inflammatory cytokines within the muscle leading to the deposition of non-contractile fibers within the muscle unit and consequent impaired muscle function [18]. Thus, we hypothesized that in otherwise healthy older adults, circulating P3NP concentrations would be inversely associated with lean mass and muscle strength.
To our knowledge, no prior studies have evaluated the association between lean body mass and P3NP in a cohort of older men and women. Therefore, we conducted a cross-sectional analysis to determine the association between plasma P3NP and lean mass (total and appendicular) in a convenience sample from the Framingham Offspring Study. Because sarcopenia is a product of muscle size and muscle function, we also examined the cross-sectional association between plasma P3NP and quadriceps strength in the same cohort.
Methods
Study Population
The Framingham Offspring Cohort began in 1971 to examine familial clustering of cardiovascular disease [19], and it includes 5,124 adult children of the Framingham Original Cohort and the spouses of these children. Participants were followed every four years with comprehensive physical examinations and risk factor assessments. Of the 3,532 Offspring who were alive and attended the examination cycle clinic visit between the years 1995–1998, a sample of 943 participants with echocardiography were selected to examine echocardiographic characteristics associated with P3NP (Figure 1) [20]. Participants were eligible provided they met one of the following four criterion by echocardiography: 1) end-diastolic left ventricular internal diameter (LVEDD) and wall thickness (LVWT) below their respective sex-specific medians (n=539); 2) LVEDD equal to or exceeding the sex-specific 90th percentiles (n=188); 3)LVWT equal to or exceeding the sex-specific 90th percentiles (n=195); or 4) both LVEDD and LVWT exceeding the sex-specific 90th percentiles (n=21). Participants with available plasma P3NP levels were younger (57.5 versus 59.3 years) and less likely to consume >3 alcoholic beverages/week (16.5 versus 23.9%) compared with participants without a measure of P3NP.
Figure 1.
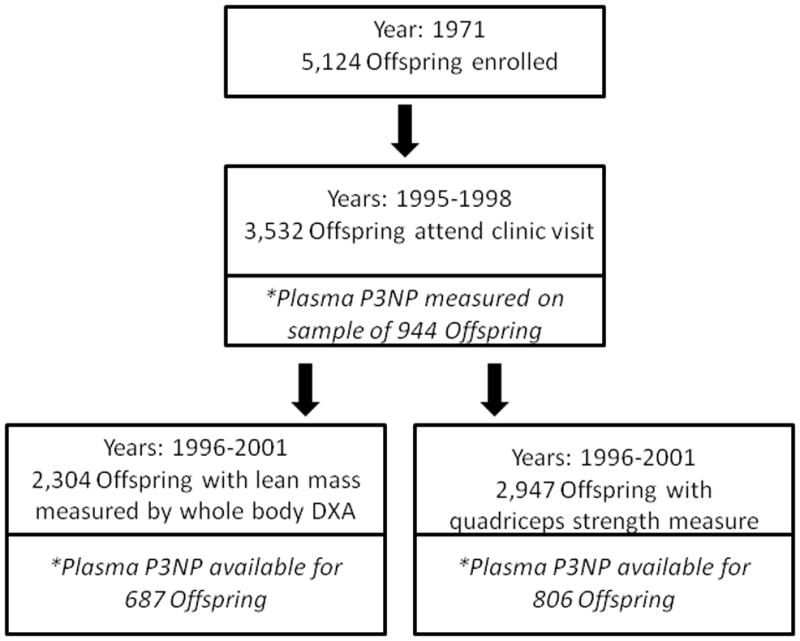
Participants of the Framingham Offspring study who were included in the analysis of P3NP and lean mass, and P3NP and strength
Of the 943 Offspring participants with measured plasma P3NP, 687 participants had lean mass measured and 806 participants had quadriceps strength measured during a Framingham Osteoporosis Study examination between 1996–2001. Participants with a measure of total lean mass or quadriceps strength were more likely to be women, have a lower BMI, and less likely to smoke, compared to participants without either measure.
Lean mass
Whole body dual x-ray absorptiometry (DXA) was performed using a Lunar DPX-L bone densitometer (LunarCorp; Madison, WI) as previously described [21]. Lean mass (kg) was calculated as the difference in soft tissue mass and fat tissue mass (in grams) divided by 1000. Total lean mass included all body regions whereas appendicular lean mass was defined as the sum of lean mass in the arms and legs.
Isometric quadriceps strength
For quadriceps strength, the right leg was tested unless participants complained of pain or had recently undergone surgery, in which case the left leg was tested. Participants were asked to sit in a chair with their back supported, and the tested leg was flexed at 60 degrees. A hand-held dynamometer (Lafayette Instrument) was placed 6 cm above the lateral malleolus. Subjects were instructed to exert their maximum force against the dynamometer for 2 seconds. The measurement was repeated, and the greater of the two readings was included in the analyses.
P3NP
Fasting blood samples were drawn from participants while in a supine position. Samples were centrifuged, and plasma was frozen at −70 degrees C until assay. Plasma P3NP was measured using a radioimmunoassay (Amersham Pharmacia Biotech). All specimens were processed in duplicate, and the mean intra-assay coefficient of variation was 6%.
Other covariates
During the 1995–1998 Framingham clinic examination, weight was measured to the nearest pound without shoes, and height was measured to the nearest quarter-inch. These were used to calculate BMI (kg/m2). Smoking status (current versus other), alcohol consumption (total drinks/week), and hormone use (oral or patch versus none) were obtained by self report.
Indicators of cardiac muscle mass (LVEDD and LVWT), which were used to determine P3NP eligibility, were assessed by transthoracic echocardiography (Sonos 1000 Hewlett-Packard). We calculated LVEDD as the sum of interventricular septum (IVS) and posterior wall (PW) measurements. LVWT was estimated using a formula previously described by Devereux [22].
Ethics
This study was approved by the Institutional Review Boards of Hebrew SeniorLife and Boston University Medical Center and all participants signed a consent form. The authors have no financial conflicts of interest.
Statistics
We first described characteristics of participants by sex-specific quartiles of P3NP. ANOVA was used to compare continuous characteristics across quartiles, and Chi-square tests to compare categorical characteristics. P3NP was not normally distributed (right skew), whereas the dependent variables, lean mass and quadriceps strength, were normally distributed. For this reason we considered P3NP as both a continuous and log transformed variable in subsequent analyses.
Using linear regression, we calculated the crude associations of P3NP (as the primary independent variables) with dependent variables of total and appendicular lean mass, and with quadriceps strength in men, premenopausal women, and postmenopausal women, separately. Resulting β coefficients reflect the unit (mg/L or log unit association of P3NP per kg of lean mass or quadriceps strength. We then estimated the proportion of variation in lean mass explained by P3NP (R2). In multivariable analyses, age and BMI were retained in all models regardless of significance. Other covariates (i.e., smoking status, alcohol consumption, categorization of LVEDD and LVWT by echocardiogram, and for post-menopausal women, hormone use) were sequentially removed from the model using a backwards stepwise process if the association with lean mass was not significant at a level of p ≤ 0.10. We used SAS version 9.2 for all analyses.
Results
The mean age of participants was 57.6 years (standard deviation: 9.6 years), and 40.2% were men (Table 1). Mean P3NP was similar in men (3.9mg/L) and in pre- and postmenopausal women (4.1 and 4.0 mg/L, respectively; however, there was a considerable range of values, particularly among postmenopausal women (0.02–53.3 mg/L).
Table 1.
Characteristics* of 806 Framingham Offspring participants in a study of plasma Procollagen Type III N-terminal peptide (P3NP) and muscle function, overall and by sex-specific plasma P3NP quartiles
| Mean plasma P3NP (mg/L), (range) | Age (yrs) | BMI (kg/m2) | Current smoker (%) | Alcohol (drinks/week) | Oral estrogen (%) | Total lean mass (kg)† | Appendicular lean mass (kg)† | Quadriceps strength (kg) | |
|---|---|---|---|---|---|---|---|---|---|
| Total sample (n=806) | |||||||||
| Total sample | 4.0 (0.02, 53.3) | 57.6± 9.6 | 27.0 ± 5.0 | 16.6 | 1.7 ± 2.4 | - | 42.9± 10.3 | 19.0 ± 5.1 | 19.9 ± 6.4 |
| Men (n=324) | |||||||||
| Total men | 3.9 (0.5–36.5) | 57.4±10.0 | 27.7 ± 4.0 | 11.1 | 2.5 ± 3.0 | - | 54.6 ± 6.5 | 24.2 ± 3.3 | 22.7 ± 6.7 |
| Men: Quartile 1 | 2.1 (0.5–2.6) | 52.8±8.8‡ | 26.7±3.1‡ | 18.5 | 3.1±3.0 | - | 55.6±6.2 | 24.0±3.0 | 22.9±7.0 |
| Men: Quartile 2 | 3.0 (2.6–3.4) | 56.5±9.0‡ | 27.0±4.0* | 8.6 | 2.5± 2.9 | - | 53.0±6.7 | 22.9±3.4 | 22.2±6.3 |
| Men: Quartile 3 | 3.8 (3.4–4.2) | 59.1±9.1‡ | 28.3±3.9‡ | 8.6 | 2.3± 3.2 | - | 55.4±6.7 | 23.8±3.3 | 22.9±6.5 |
| Men: Quartile 4 | 6.8 (4.2–36.5) | 61.1±10. 5‡ | 28.7±4.4‡ | 8.6 | 2.2± 2.9 | - | 54.6±6.4 | 23.4±3.1 | 22.7±7.1 |
| Pre-menopausal women (n=114) | |||||||||
| Total pre-menopausal women | 4.1 (0.6–19.9) | 47.2± 4.7 | 26.0± 5.7 | 15.8 | 1.1 ± 1.5 | - | 37.6 ± 4.6 | 16.4 ± 2.7 | 19.8 ± 5.4 |
| Pre-menopausal women: Quartile 1 | 1.7 (0.6–2.2) | 46.9±4.1 | 23.8± 3.1§ | 25.0 | 1.3 ± 1.4§ | - | 38.1±3.7 | 16.4±2.2 | 18.1±5.3 |
| Pre-menopausal women: Quartile 2 | 2.7 (2.3–3.1) | 47.0 ±5.7 | 25.0 ± 4.2§ | 17.2 | 1.7 ± 1.6§ | - | 37.6±4.6 | 16.0±2.3 | 21.4±5.2 |
| Pre-menopausal women: Quartile 3 | 3.6 (3.1–4.2) | 47.3 ± 4.4 | 27.6±7.6§ | 6.9 | 0.5 ± 0.9§ | - | 37.9±5.0 | 16.3±2.9 | 19.5±4.9 |
| Pre-menopausal women: Quartile 4 | 8.4 (4.3–19.9) | 47.5 ± 4.9 | 27.7±6.0 § | 14.3 | 1.0 ± 1.6§ | - | 36.9±5.0 | 15.9±2.9 | 20.2±6.0 |
| Post-menopausal women (n=368) | |||||||||
| Total post-menopausal women | 4.0 (0.02–53.3) | 61.0 ± 8.1 | 26.8 ±5.5 | 16.9 | 1.2 ± 1.9 | 36.1 | 35.8 ± 4.2 | 15.4 ± 2.4 | 17.6 ± 5.4 |
| Post-menopausal women: Quartile 1 | 1.9 (0.02–2.4) | 58.1 ± 7.1‡ | 25.9 ± 5.2‡ | 16.3 | 1.2 ± 1.7 | 46.7§ | 36.0±4.0 | 15.2±2.1 | 17.9±5.8 |
| Post-menopausal women: Quartile 2 | 2.7 (2.5–3.0) | 61.6 ± 7.5‡ | 25.9 ± 4.4‡ | 19.6 | 1.2 ± 2.0 | 39.1§ | 35.3±3.8 | 14.8±1.9 | 17.8±4.8 |
| Post-menopausal women: Quartile 3 | 3.4 (3.0–3.9) | 61.4 ± 8.2‡ | 27.0 ± 5.8‡ | 14.1 | 1.0 ± 1.6 | 29.4§ | 35.8±4.2 | 15.0±2.2 | 17.3±5.1 |
| Post-menopausal women: Quartile 4 | 7.8 (3.9–53.3) | 62.8 ± 8.9‡ | 28.3 ± 6.1‡ | 17.4 | 1.4 ± 2.2 | 29.4§ | 36.0±4.8 | 15.2±2.3 | 17.3±5.9 |
mean ± standard deviation unless otherwise specified
among 687 subjects with both a measure of P3NP and total body lean mass
P<0.01
P<0.05
In postmenopausal women and men, higher P3NP levels were associated with older age (Table 2), as was BMI for all participants. In postmenopausal women, the lowest quartile of P3NP had the greatest proportion of hormone replacement users. Total and appendicular lean mass was lower with higher P3NP in premenopausal women, although this was not statistically significant. There was no association between P3NP quartiles and quadriceps strength in men or women.
Table 2.
Unadjusted and adjusted* association between plasma Procollagen Type III N-Terminal Peptide (P3NP) and total lean mass, appendicular lean mass, and quadriceps strength, by sex
| Total lean mass | Appendicular lean mass | Quadriceps strength | ||||||||||
|---|---|---|---|---|---|---|---|---|---|---|---|---|
| N | Unadjusted β estimate† (SE) | Multivariable adjusted β estimate (SE) | Adjusted p-value | N | Unadjusted β estimate† (SE) | Multivariable adjusted β estimate (SE) | Adjusted p-value | N | Unadjusted β estimate† (SE) | Multivariable adjusted β estimate (SE) | Adjusted p-value | |
| Men | 251 | −0.05 (0.11) | −0.05 (0.07) | 0.45 | 251 | −0.01 (0.05) | −0.01 (0.03) | 0.82 | 324 | 0.12 (0.11) | 0.12 (0.11) | 0.27 |
| Pre-menopausal women | 106 | −0.14 (0.14) | −0.10 (0.12) | 0.41 | 106 | −0.06 (0.08) | −0.06 (0.06) | 0.37 | 114 | 0.10 (0.15) | 0.06 (0.15) | 0.69 |
| Post-menopausal women | 330 | −0.16 (0.05) | −0.13 (0.04) | 0.003 | 330 | −0.06 (0.03) | −0.05 (0.02) | 0.02 | 368 | −0.08 (0.06) | −0.05 (0.06) | 0.44 |
Covariates considered in the models included age, BMI, current smoking, current alcohol use, cardiac parameters (left ventricular end diastolic weight and diameter), and estrogen supplementation in post-menopausal women.
β-coefficients approximate association between plasma P3NP unit (mg/L) per kg of lean mass or strength
In the unadjusted analyses, there was no association between plasma P3NP and total or appendicular lean mass in men (Figure 2: R2=0.00; Table 3: β-coefficient=−0.01 unit P3NP/kg appendicular lean mass, p=0.90). Results were qualitatively similar after adjusting for age, BMI, smoking, alcohol use, and cardiac muscle mass (Table 2), and when we examined the association in older (≥ age 65 years) and younger men separately (not shown). Plasma P3NP was inversely associated with total and appendicular lean mass in both premenopausal and postmenopausal women, although this association was only statistically significant in postmenopausal women (Figure 2: R2 for appendicular lean mass in postmenopausal women=0.02, p=0.01). Results were similar in the adjusted analyses (β-coefficient=−0.05 unit P3NP/kg appendicular lean mass, p=0.02). Results were also similar after log-transformation of P3NP (Table 3), although the association between P3NP and appendicular lean mass was no longer statistically significant in postmenopausal women (β-coefficient=−0.25 log unit P3NP/kg appendicular lean mass, p=0.10).
Figure 2.
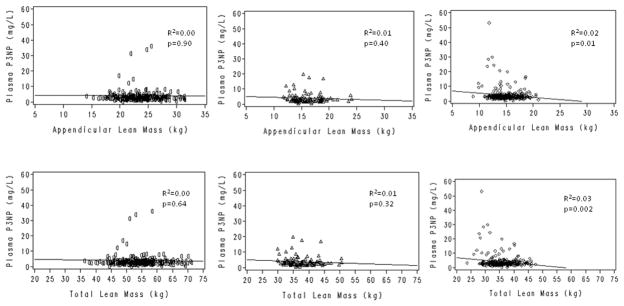
Cross-sectional association between plasma P3NP and total and appendicular lean mass in men (○), premenopausal women (△), and postmenopausal women (◇)
Table 3.
Unadjusted and adjusted* association between log transformed plasma Procollagen Type III N-Terminal Peptide (P3NP) and total lean mass, appendicular lean mass, and quadriceps strength, by sex
| Total lean mass | Appendicular lean mass | Quadriceps strength | ||||||||||
|---|---|---|---|---|---|---|---|---|---|---|---|---|
| N | Unadjusted β estimate† (SE) | Multivariable adjusted β estimate (SE) | Adjusted p-value | N | Unadjusted β estimate† (SE) | Multivariable adjusted β estimate (SE) | Adjusted p-value | N | Unadjusted β estimate† (SE) | Multivariable adjusted β estimate (SE) | Adjusted p-value | |
| Men | 251 | −0.39 (0.81) | 0.39 (0.75) | 0.60 | 251 | −0.16 (0.40) | 0.23 (0.36) | 0.53 | 324 | 0.77 (0.77) | 0.99 (0.81) | 0.22 |
| Pre-menopausal women | 106 | −0.81 (0.74) | −0.86 (0.66) | 0.20 | 106 | −0.38 (0.41) | −0.45 (0.36) | 0.21 | 114 | 0.70 (0.83) | 0.41 (0.85) | 0.63 |
| Post-menopausal women | 330 | −0.62 (0.37) | −0.72 (0.32) | 0.02 | 330 | −0.26 (0.19) | −0.25 (0.16) | 0.10 | 368 | −0.75 (0.46) | −0.41 (0.45) | 0.37 |
Covariates considered in the models included age, BMI, current smoking, current alcohol use, cardiac parameters (left ventricular end diastolic weight and diameter), and estrogen supplementation in post-menopausal women.
β-coefficients approximate association between plasma P3NP log unit (mg/L) per kg of lean mass or strength
There was no association between plasma P3NP and quadriceps strength in the crude or adjusted analyses in men or women (Table 2). In men, the multivariable adjusted β-coefficient for P3NP and quadriceps strength was 0.12 unit P3NP/kg strength (p=0.27), while in postmenopausal women there was an inverse relationship that did not reach statistical significance (β-coefficient =−0.05 unit P3NP/kg strength, p=0.44). Results were similar after log-transformation of P3NP (Table 3).
Discussion
To our knowledge, this is the first study to examine the cross-sectional association between plasma P3NP and lean mass in a study of both men and women. We found that higher levels of plasma P3NP were associated with a modest decrease in total and appendicular lean mass in postmenopausal women. P3NP was not associated with lean mass in men, nor was it associated with quadriceps strength in either sex.
In a clinical trial of 106 elderly community-dwelling men who received a GnRH agonist plus recombinant growth hormone or testosterone, Bhasin et al. found that early increases in P3NP were associated with greater gains in total and appendicular lean mass [23]. In fact, using stepwise models the authors concluded that change in P3NP was a stronger predictor of change in total and appendicular lean mass as compared with age, serum testosterone, or IGF-1.
In our cross-sectional study, we found an inverse association between plasma P3NP and total and appendicular lean mass in women. While our results may seem contradictory, there may be an explanation for our findings. In the study by Bhasin, subjects were given an anabolic agent stimulating the growth of lean mass. Because P3NP is released during periods of collagen synthesis, it is not surprising that greater increases in plasma P3NP were associated with greater gains in lean mass. Typically, however, aging adults do not receive anabolic agents nor do they experience rapid increases in muscle mass. In the absence of anabolic agents and during periods of muscle loss, P3NP may be elevated as a result of the abnormal inflammation and fibrosis of skeletal muscle. There is some support for this hypothesis in animal models, where denervation and immobilization of rat muscle uncouples the regulation of collagen biosynthesis resulting in excess collagen formation in the endomysium and perimysium [24], the compartments where Type III collagen is found in the highest concentrations. Prospective studies are needed to validate this hypothesis and our findings.
Our finding that plasma P3NP was inversely associated with lean mass in postmenopausal women, but not in men, is intriguing. One possible explanation is that the men tended to be younger than the postmenopausal women. If younger men were maintaining lean mass without producing more collagen, inclusion of these younger men may have attenuated the overall association between P3NP and lean mass in men. However, when we examined the subgroup of men with ages above the median, we did not detect an inverse association between P3NP and lean mass. Alternatively, there may be some difference in sex hormones that attenuates the association between P3NP and lean mass in men. Our results do not support this hypothesis as the association was similar in pre- and postmenopausal women, and additional adjustment for estrogen use among postmenopausal women did not affect our estimates. Nevertheless, we did not examine other sex hormone effects, such as testosterone. Further investigation on the sex-specific relationship between plasma P3NP and lean mass is warranted.
Higher levels of P3NP are not specific to collagen formation within skeletal muscle, and they may also be found in association with fibrosis of other connective tissues and organs containing type III collagen. Furthermore, P3NP is a general marker of collagen production, and our results suggest that it may not distinguish between healthy skeletal muscle growth and pathologic fibrosis of skeletal muscle. A few male and female participants had markedly elevated plasma P3NP levels (Figure 2), suggesting very high production of Type III collagen in those persons. We found no obvious differences between the characteristics of participants with extreme P3NP and those with lower plasma P3NP levels. It is possible that these persons experienced an acute muscle injury, recently initiated exercise therapy, or had abnormal fibrosis of other organs containing Type III collagen. We did not have detailed information on these factors to adjust in our models; however, regression estimates were similar when residual outliers were considered.
We found no cross-sectional association between P3NP and muscle strength. This again may relate to an inability of the assay to distinguish between healthy and diseased collagen formation within skeletal muscle. Future prospective longitudinal studies of older adults are needed to determine if P3NP predicts changes in lean mass and strength.
There are several limitations to our study. First our study utilized a single measure of P3NP as a predictor of lean mass. On average, plasma P3NP was measured 1.9 years before the measure of lean mass was ascertained (range 0 days to 5.4 years). P3NP levels are believed to stay relatively constant throughout healthy adulthood [11]. Even in the study by Bhasin et al, which utilized anabolic agents, a steady state of P3NP was observed within 8 weeks of drug administration [23]. Thus, multiple measures of P3NP or a simultaneous measure of P3NP with lean mass is unlikely to have changed our results. Second, participants were comprised of a convenience sample within the Framingham Offspring Study. Eligible participants were more likely to be younger women with healthy characteristics (lower BMI, less smokers, and less excess alcohol), and this may have limited our ability to find an association between lean mass and plasma P3NP, particularly in men. Third, our analysis is cross-sectional, and we are unable to determine if P3NP is associated with loss of muscle mass in men and women. Future studies should consider whether elevated serum P3NP predicts persons at risk for muscle loss, and thus, are good candidates for intervention. Finally, our study was performed in a cohort of Caucasian Americans, and these findings may not be generalizable to other groups.
Because sarcopenia is common and associated with poor outcomes in the elderly population, it is important that new biomarkers associated with muscle mass be discovered in an effort to improve diagnostic and treatment options.[25] Our study suggests that plasma P3NP could potentially be a useful biomarker of muscle mass in postmenopausal women if it is found to have adequate sensitivity and specificity for muscle turnover in larger, future studies. Prospective studies of plasma P3NP and changes in muscle mass are needed to confirm this association and to understand why circulating P3NP might be more strongly associated with lean mass in women than in men.
Acknowledgments
This work was funded by a grant from NIAMS/NIA R01 AR/AG 41398 and Framingham Heart Study, (NHLBI/NIH Contract #N01-HC-25195 and RO1 HL67288), a grant from the NIA K23 AG033204, and from the Men’s Associates from Hebrew SeniorLife.
Footnotes
These analyses were presented in part as a poster at the 2010 annual meeting for the American Society for Bone and Mineral Research in Toronto, Ontario on October 15, 2010.
References
- 1.Rosenberg IH. Sarcopenia: origins and clinical relevance. J Nutr. 1997;127:990S–991S. doi: 10.1093/jn/127.5.990S. [DOI] [PubMed] [Google Scholar]
- 2.Lang T, Streeper T, Cawthon P, et al. Sarcopenia: etiology, clinical consequences, intervention, and assessment. Osteoporos Int. 2010;21:543–559. doi: 10.1007/s00198-009-1059-y. [DOI] [PMC free article] [PubMed] [Google Scholar]
- 3.Janssen I, Heymsfield SB, Wang ZM, Ross R. Skeletal muscle mass and distribution in 468 men and women aged 18–88 yr. J Appl Physiol. 2000;89:81–88. doi: 10.1152/jappl.2000.89.1.81. [DOI] [PubMed] [Google Scholar]
- 4.Hairi NN, Cumming RG, Naganathan V, et al. Loss of muscle strength, mass (sarcopenia), and quality (specific force) and its relationship with functional limitation and physical disability: the Concord Health and Ageing in Men Project. J Am Geriatr Soc. 2010;58:2055–2062. doi: 10.1111/j.1532-5415.2010.03145.x. [DOI] [PubMed] [Google Scholar]
- 5.Janssen I, Baumgartner RN, Ross R, Rosenberg IH, Roubenoff R. Skeletal muscle cutpoints associated with elevated physical disability risk in older men and women. Am J Epidemiol. 2004;159:413–421. doi: 10.1093/aje/kwh058. [DOI] [PubMed] [Google Scholar]
- 6.Sternfeld B, Ngo L, Satariano WA, Tager IB. Associations of body composition with physical performance and self-reported functional limitation in elderly men and women. Am J Epidemiol. 2002;156:110–121. doi: 10.1093/aje/kwf023. [DOI] [PubMed] [Google Scholar]
- 7.Zamboni M, Turcato E, Santana H, et al. The relationship between body composition and physical performance in older women. J Am Geriatr Soc. 1999;47:1403–1408. doi: 10.1111/j.1532-5415.1999.tb01557.x. [DOI] [PubMed] [Google Scholar]
- 8.Frontera WR, Hughes VA, Fielding RA, et al. Aging of skeletal muscle: a 12-yr longitudinal study. J Appl Physiol. 2000;88:1321–1326. doi: 10.1152/jappl.2000.88.4.1321. [DOI] [PubMed] [Google Scholar]
- 9.Prockop DJ, Kivirikko KI, Tuderman L, Guzman NA. The biosynthesis of collagen and its disorders (first of two parts) N Engl J Med. 1979;301:13–23. doi: 10.1056/NEJM197907053010104. [DOI] [PubMed] [Google Scholar]
- 10.Crofton PM, Wade JC, Taylor MR, Holland CV. Serum concentrations of carboxyl-terminal propeptide of type I procollagen, amino-terminal propeptide of type III procollagen, cross-linked carboxyl-terminal telopeptide of type I collagen, and their interrelationships in schoolchildren. Clin Chem. 1997;43:1577–1581. [PubMed] [Google Scholar]
- 11.Wallace JD, Cuneo RC, Lundberg PA, et al. Responses of markers of bone and collagen turnover to exercise, growth hormone (GH) administration, and GH withdrawal in trained adult males. J Clin Endocrinol Metab. 2000;85:124–133. doi: 10.1210/jcem.85.1.6262. [DOI] [PubMed] [Google Scholar]
- 12.Klappacher G, Franzen P, Haab D, et al. Measuring extracellular matrix turnover in the serum of patients with idiopathic or ischemic dilated cardiomyopathy and impact on diagnosis and prognosis. Am J Cardiol. 1995;75:913–918. doi: 10.1016/s0002-9149(99)80686-9. [DOI] [PubMed] [Google Scholar]
- 13.Biolo A, Rohde LE, Goldraich LA, et al. Serum procollagen type III is associated with elevated right-sided filling pressures in stable outpatients with congestive heart failure. Biomarkers. 2009;14:438–442. doi: 10.1080/13547500903098293. [DOI] [PubMed] [Google Scholar]
- 14.Diez J, Laviades C, Mayor G, Gil MJ, Monreal I. Increased serum concentrations of procollagen peptides in essential hypertension. Relation to cardiac alterations. Circulation. 1995;91:1450–1456. doi: 10.1161/01.cir.91.5.1450. [DOI] [PubMed] [Google Scholar]
- 15.Jensen LT, Horslev-Petersen K, Toft P, et al. Serum aminoterminal type III procollagen peptide reflects repair after acute myocardial infarction. Circulation. 1990;81:52–57. doi: 10.1161/01.cir.81.1.52. [DOI] [PubMed] [Google Scholar]
- 16.Khan S, Subedi D, Chowdhury MM. Use of amino terminal type III procollagen peptide (P3NP) assay in methotrexate therapy for psoriasis. Postgrad Med J. 2006;82:353–354. doi: 10.1136/pgmj.2005.041533. [DOI] [PMC free article] [PubMed] [Google Scholar]
- 17.Sugimoto M, Masutani S, Seki M, et al. High serum levels of procollagen type III N-terminal amino peptide in patients with congenital heart disease. Heart. 2009;95:2023–2028. doi: 10.1136/hrt.2009.170241. [DOI] [PubMed] [Google Scholar]
- 18.Ryall JG, Schertzer JD, Lynch GS. Cellular and molecular mechanisms underlying age-related skeletal muscle wasting and weakness. Biogerontology. 2008;9:213–228. doi: 10.1007/s10522-008-9131-0. [DOI] [PubMed] [Google Scholar]
- 19.Kannel WB, Feinleib M, McNamara PM, Garrison RJ, Castelli WP. An investigation of coronary heart disease in families. The Framingham offspring study. Am J Epidemiol. 1979;110:281–290. doi: 10.1093/oxfordjournals.aje.a112813. [DOI] [PubMed] [Google Scholar]
- 20.Wang TJ, Larson MG, Benjamin EJ, et al. Clinical and echocardiographic correlates of plasma procollagen type III amino-terminal peptide levels in the community. Am Heart J. 2007;154:291–297. doi: 10.1016/j.ahj.2007.04.006. [DOI] [PMC free article] [PubMed] [Google Scholar]
- 21.Visser M, Kiel DP, Langlois J, et al. Muscle mass and fat mass in relation to bone mineral density in very old men and women: the Framingham Heart Study. Appl Radiat Isot. 1998;49:745–747. doi: 10.1016/s0969-8043(97)00101-2. [DOI] [PubMed] [Google Scholar]
- 22.Devereux RB, Alonso DR, Lutas EM, et al. Echocardiographic assessment of left ventricular hypertrophy: comparison to necropsy findings. Am J Cardiol. 1986;57:450–458. doi: 10.1016/0002-9149(86)90771-x. [DOI] [PubMed] [Google Scholar]
- 23.Bhasin S, He EJ, Kawakubo M, et al. N-terminal propeptide of type III procollagen as a biomarker of anabolic response to recombinant human GH and testosterone. J Clin Endocrinol Metab. 2009;94:4224–4233. doi: 10.1210/jc.2009-1434. [DOI] [PMC free article] [PubMed] [Google Scholar]
- 24.Savolainen J, Myllyla V, Myllyla R, et al. Effects of denervation and immobilization on collagen synthesis in rat skeletal muscle and tendon. Am J Physiol. 1988;254:R897–902. doi: 10.1152/ajpregu.1988.254.6.R897. [DOI] [PubMed] [Google Scholar]
- 25.Cesari M, Fielding RA, Pahor M, et al. Biomarkers of sarcopenia in clinical trials-recommendations from the International Working Group on Sarcopenia. J Frailty Aging. 2012;1:102–110. doi: 10.1007/s13539-012-0078-2. [DOI] [PMC free article] [PubMed] [Google Scholar]