Abstract
Background
Insulin signaling comprises 2 major cascades: the insulin receptor substrate/phosphatidylinositol 3′‐kinase/protein kinase B and Ras/Raf/mitogen‐activated protein kinase/kinase/ERK pathways. While many studies on the tissue‐specific effects of the insulin receptor substrate/phosphatidylinositol 3′ ‐kinase/protein kinase B pathway have been conducted, the role of the other cascade in tissue‐specific insulin resistance has not been investigated. High glucose/fatty acid toxicity, inflammation, and oxidative stress, all of which are associated with insulin resistance, can activate ERK. The liver plays a central role in metabolism, and hepatosteatosis is associated with vascular diseases. The aim of study was to elucidate the role of hepatic ERK2 in hepatosteatosis, metabolic remodeling, and endothelial dysfunction.
Methods and Results
We created liver‐specific ERK2 knockout mice and fed them with a high‐fat/high‐sucrose diet for 20 weeks. The high‐fat/high‐sucrose diet–fed liver‐specific ERK2 knockout mice exhibited a marked deterioration in hepatosteatosis and metabolic remodeling represented by impairment of glucose tolerance and decreased insulin sensitivity without changes in body weight, blood pressure, and serum cholesterol/triglyceride levels. In the mice, endoplasmic reticulum stress was induced together with decreased mRNA and protein expressions of hepatic sarco/endoplasmic reticulum Ca2+‐ATPase 2. In a hepatoma cell line, inhibition of ERK activation– induced endoplasmic reticulum stress only in the presence of palmitate. Vascular reactive oxygen species were elevated with upregulation of nicotinamide adenine dinucleotide phosphate oxidase1 (Nox1) and Nox4 and decreased phosphorylation of endothelial nitric oxide synthase, which resulted in the remarkable endothelial dysfunction in high‐fat/high‐sucrose diet–fed liver‐specific ERK2 knockout mice.
Conclusions
Hepatic ERK2 suppresses endoplasmic reticulum stress and hepatosteatosis in vivo, which results in protection from vascular oxidative stress and endothelial dysfunction. These findings demonstrate a novel role of hepatic ERK2 in obese‐induced insulin resistance in the protection from hepatovascular metabolic remodeling and vascular diseases.
Keywords: diabetes mellitus, insulin, liver, metabolism, nitric oxide
Introduction
Obesity‐related diseases (ORD), such as metabolic syndrome and type 2 diabetes mellitus, are characterized by insulin resistance, and recent research on insulin resistance has indicated that hepatosteatosis (HST) is closely associated with cardiovascular complications. Patients with nonalcoholic HST had impaired flow‐mediated vasodilatation1 and increased carotid artery intimal‐medial thickness.2–6 HST was associated with moderately increased cardiovascular events in individuals with type 2 diabetes mellitus, independently of classic risk factors.7 Thus, HST can be regarded as a risk factor for vascular diseases in ORD associated with insulin resistance.
The role of the hepatic insulin receptor substrate (IRS)/phosphatidylinositol 3′‐kinase (PI3K)/protein kinase B (Akt) pathway in insulin signaling has been extensively studied, mainly in in vitro. Akt regulates various phenotypes, including those of cell survival, hypertrophy, angiogenesis, and intracellular metabolism such as glucose/amino acid transport, glycogen synthesis, lipid synthesis, and protein synthesis.8 Using hepatocyte‐specific insulin receptor–deficient mice, Kahn et al9–10 observed impairment of gluconeogenesis and hyperlipidemia with susceptibility to atherosclerosis. Although the hepatic IRS/PI3K/Akt pathway downregulates gluconeogenesis via suppression of FoxO transcription factors, it upregulates SREBP1, which accounts for the acceleration of lipid synthesis by insulin. The development of HST with glucose intolerance may require an imbalance in glucose/lipid‐metabolic regulation by insulin in the liver.11
The other major cascade of insulin signaling is the Ras/Raf/mitogen‐activated protein kinase/kinase (MEK)/ERK pathway. However, the role of hepatic ERK in insulin resistance and metabolic changes in vivo has not been investigated. Insulin resistance is associated with inflammation, high glucose/fatty acid toxicity, and oxidative stress, and all of these conditions can activate ERK signaling in many cell types. We hypothesize that the activation of ERK plays a different metabolic role in HST. The aim of this study was to clarify the role of hepatic ERK2 in obese‐induced insulin resistance and metabolic remodeling. Focusing on the central role of the liver in metabolism, we tested the impact of deleting hepatic ERK2 on glucose/lipid metabolism and the development of HST. We also tested vascular oxidative stress and endothelial dysfunction, the most sensitive indicators for vascular diseases. Because recent research showed that endoplasmic reticulum (ER) stress in the liver played an important role in ORD and type 2 diabetes mellitus,12 the expression of sarco/endoplasmic reticulum Ca2+‐ATPase (SERCA) 2 and the ER stress markers was tested in the liver from mice and in cultured hepatoma cells treated with free fatty acid (FFA). The results demonstrated the impact of metabolic remodeling induced by HST and hepatic insulin resistance on endothelial dysfunction in ORD.
Methods
Animals, Genotyping, and Diets
To ablate ERK2 selectively in the liver, we used the Cre‐loxP strategy. A floxed allele in which exons 2 and 3 of ERK2 were flanked by loxP sites was constructed as reported previously.13 ERK2 floxed mice were backcrossed with C57BL/6J for >10 generations. An albumin promoter–driven Cre recombinase transgenic mouse line (Alb‐Cre), in which Cre activity is confined to the liver, was used to drive recombination. We crossed the ERK2 floxed mice with Alb‐Cre mice, which had been maintained on the same background (C57BL/6J). The resulting Alb‐Cre+/−;ERK2(lox/lox) mice (also referred to as LE2KO) were viable and fertile with a normal appearance. The littermate controls used in this study had the following genotypes: Alb‐Cre(−/−);ERK2(+/+) , Alb‐Cre(+/−);ERK2(+/+), or Alb‐Cre(−/−);ERK2(lox/lox) (also referred to as wild‐type, Alb‐Cre, and ERK2(lox/lox), respectively).
Animals were maintained in a temperature‐controlled facility on a 12‐hour light/dark cycle (lights on from 7:00 am to 7:00 pm) and fed a normal rodent diet (Clea Japan, Inc; Table 1) ad libitum. Eight‐week‐old male liver‐specific ERK2 knockout mice (LE2KO) and control littermates were fed either normal chow (NC) or high‐fat/high‐sucrose diet (HFHSD; F2HFHSD with 28.3% of calories from carbohydrates, 54.5% from fat, and 17.2% from protein [Oriental Yeast]; Table 1) for 20 weeks. Genotyping for the ERK2 floxed allele and the presence of Cre was performed by polymerase chain reaction (PCR) analysis using genomic DNA isolated from the tail tip.
Table 1.
Composition of Normal Chow Diet and High‐Fat/High‐Sucrose Diet
| CE‐7 | g/100 g | kcal, % |
|---|---|---|
| Normal Chow Diet | ||
| Total calories | 343 kcal | |
| Protein | 17.7 g | 20.6 |
| Fat | 3.8 g | 10.0 |
| Carbohydrate | 59.4 g | 69.4 |
| F2HFHSD | g/100g | kcal (%) |
|---|---|---|
| High‐Fat/High‐Sucrose Diet | ||
| Total calories | 481 kcal | |
| Protein | 20.7 g | 17.2 |
| Fat | 29.1 g | 54.5 |
| Carbohydrate | 34.0 g | 28.3 |
| Ingredient | |||
|---|---|---|---|
| Casein | 25.0% | Cellulose | 5.0% |
| a‐Corn starch | 14.869% | Vitamin mix (AIN‐93) | 1.0% |
| Sucrose | 20.0% | Mineral mix (AIN‐93G) | 3.5% |
| Beef tallow | 14.0% | Choline bitartrate | 0.25% |
| Lard | 14.0% | tert‐Butylhidroquinone | 0.006% |
| Soybean oil | 2.0% | l‐Cystine | 0.375% |
HFHSD indicates high‐fat/high‐sucrose diet.
All experiments were conducted according to the institutional ethical guidelines for animal experiments and the safety guidelines for gene manipulation experiments of the National Defense Medical College. The experiments were approved by the Committee for Animal Research of the National Defense Medical College.
Measurements of Systolic Blood Pressure and Heart Rate
Systolic blood pressure and heart rate were measured by the tail‐cuff method (MK‐2000; Muromachi Kikai) without anesthesia.
Biochemical Analysis of Tissues
Tissues were removed and homogenized with 10 or 15 volumes of homogenization buffer (Tris‐HCl 20 mmol/L, pH 7.4, NaCl 150 mmol/L, Na2EDTA 1 mmol/L, EGTA 1 mmol/L, 1% NP‐40, sodium pyrophosphate 2.5 mmol/L, monoglycerophosphate 1 mmol/L, Na2VO4 1 mmol/L) containing PMSF 1 mmol/L and protease inhibitor cocktail. The homogenates were centrifuged at 13 000 g for 20 minutes at 4°C. Protein concentrations were measured by using the Bradford assay with BSA as a standard.14 Protein lysates were resolved by SDS‐PAGE and transferred to PVDF membranes at a voltage of 30 V for 2 hours at 4°C and immunoblotted with primary antibodies to ERK1/2, phosphor‐ERK1/2 (Thr202/Tyr204), SERCA2, C/enhancer binding protein homologous protein (CHOP), phosphoeukaryotic initiation factor 2α (eIF2α) (Ser51), immunoglobulin heavy‐chain binding protein (BiP), PKR‐like ER kinase (PERK), phospho‐PERK (Thr980), c‐Jun N‐terminal kinase (JNK), phospho‐JNK (Thr183/Tyr 85) (Cell Signaling Technology), inositol‐requiring enzyme 1α (IRE1α), phospho‐IRE1α (Ser724) (Novus Biologicals), endothelial nitric oxide synthase (eNOS) (BD), and phospho‐eNOS (Ser1177) (Upstate Biotechnology).
Tissue Preparation and Histology
Mice were killed via pentobarbital injection and perfused with 0.9% saline followed by 4% paraformaldehyde. The liver, heart, aorta, and fat were fixed in 10% formalin for 24 hours, embedded in paraffin, and sectioned. All samples were routinely stained with hematoxylin and eosin. Liver samples were visualized with an anti‐ERK2 antibody (Abcam).
Measurement of Metabolites
Blood glucose levels were determined using a glucose‐detection kit (Wako Pure Chemical Industries). Serum insulin levels were measured using ELISA kits (Mercodia). Serum levels of total cholesterol (TC), triglycerides (TG), high‐density lipoprotein cholesterol (HDL‐C), and FFA were assessed by enzymatic assays (Wako Pure Chemical Industries). Glucose tolerance tests (GTTs) were performed on animals that had been fasted overnight for 14 hours, whereas insulin tolerance tests (ITTs) were performed in the random‐fed state. d‐Glucose 1.5 g/kg body weight was orally administered to animals, or they were injected with human regular insulin 0.75 U/kg body weight (Humulin R; Eli Lilly) into the peritoneal cavity. Vein blood was collected at 0, 15, 30, 60, and 120 minutes after oral administration of glucose or 0, 20, 40, 60, and 120 minutes after insulin injection, and blood glucose levels were measured. Areas under the glucose‐time curve were also calculated.
Hepatic TC and TG Measurements
Lipids were extracted as previously described.15 In brief, livers were perfused and homogenized in saline at a concentration of 3 mL/g liver tissue. The homogenates were diluted 5× with PBS and lipids were solubilized at 37°C for 5 minutes, in 1% deoxycholate for TG and 0.25% deoxycholate for cholesterol. Levels of hepatic TC and TG were measured with a kit (Wako Pure Chemicals).
Measurement of Reactive Oxygen Metabolites and Biological Antioxidant Potential Levels
Both blood reactive oxygen metabolites (ROM) and biological antioxidant potential (BAP) levels were measured with a Free Radical Elective Evaluator (FREE; Wismerll Co Ltd) as previously described.16 In brief, to measure ROM, a 20‐μL serum sample and 1 mL buffered solution (R2 kit reagent) were gently mixed in a cuvette, and then 20 μL chromogenic substrate (R1 kit reagent) was added to the cuvette. After mixing well, the cuvette was immediately incubated in the thermostatic block of the analyzer for 5 minutes at 37°C, and then absorbance at 505 nm was recorded. Measurements are expressed as Carratelli units (CARR U), with 1 CARR U corresponding to 0.8 mg/L H2O2. To measure BAP, a 10‐μL blood sample was mixed with the colored solution and incubated for 5 minutes at 37°C before photometric analysis, and then absorbance was recorded. ROM indicates plasma hydroperoxide products and BAP indicates antioxidant capacity in serum.
Gene Microarray Analysis
The “3D‐Gene” Mouse Oligo chip 24k (Toray Industries Inc), which contains 23 522 distinct genes, was used for the oligo‐DNA microarray analysis comparing livers from LE2KO and controls fed HFHSD. For efficient hybridization, this microarray is constructed in 3 dimensions, with a well as the space between the probes and cylinder stems, and 70‐mer oligonucleotide probes on the top. Total RNA was labeled with Cy3 or Cy5 using the Amino Allyl Message Amp II aRNA Amplification Kit (Applied Biosystems). The Cy3‐ or Cy5‐labeled aRNA samples were pooled in hybridization buffer and hybridized for 16 hours. The hybridization was performed using the supplied protocols (www.3d-gene.com). Hybridization signals were scanned using the ScanArray Express Scanner (PerkinElmer) and processed using GenePixPro version 5.0 software (Molecular Devices). The detected signals for each gene were normalized using a global normalization method (median Cy3/Cy5 ratio=1). Pathway analysis was performed according to the number of genes on each pathway, which were either upregulated or downregulated in livers from LE2KO fed HFHSD.
Quantitative Real‐Time PCR
Total RNA was isolated from the livers and aorta using TRI reagent (Sigma‐Aldrich). cDNA was synthesized using SuperScript III reverse transcriptase (Invitrogen) according to the manufacturer's protocol. Quantitative mRNA expression was assessed by real‐time PCR with Power SYBR Green PCR Master Mix (Applied Biosystems). Samples were run in duplicate on the ABI PRISM 7700 (Applied Biosystems). The following oligonucleotide primer pairs were used:SERCA2b (forward), 5′‐ATGAGCAAGATGTTTGTGAAGG‐3′; SERCA2b (reverse), 5′‐CAGTGGGTTGTCATGAGTGG‐3′; nicotinamide adenine dinucleotide phosphate oxidase 1 (Nox1) (forward), 5′‐CTACAGTAGAAGCCAACAGGCCAT‐3′; Nox1 (reverse), 5′‐ACTGTCACGTTTGGAGACTGGATG‐3′; Nox2 (forward), 5′‐CCCTTTGGTACAGCCAGTGAAGAT‐3′; Nox2 (reverse), 5′‐CAATCCCAGCTCCCACTAACATCA‐3′; Nox4 (forward), 5′‐GGATCACAGAAGGTCCCTAGCAG‐3′; Nox4 (reverse), 5′‐GCAGCTACATGCACACCTGAGAA‐3′; superoxide dismutase (SOD) 1 (forward), 5′‐ AACCAGTTGTGTTGTCAGGAC‐3′; SOD1 (reverse), 5′‐ CCACCATGTTTCTTAGAGTGAGG‐3′; SOD3 (forward), 5′‐ CCTTCTTGTTCTACGGCTTGC‐3′; SOD3 (reverse), 5′‐ TCGCCTATCTTCTCAACCAGG‐3′; 18S rRNA (forward), 5′‐TTCCGATAACGAACGAGACTCT‐3′; 18S rRNA (reverse), and 5′‐TGGCTGAACGCCACTTGTC‐3′.
Cell Culture and Fatty Acid Treatment
Experiments were performed on the human hepatoma cell line Huh‐7. Cells were cultured in Dulbecco's modified Eagle medium (DMEM, Invitrogen) containing l‐glutamine 4 mmol/L, sodium pyruvate 1 mmol/L, glucose 5.6 mmol/L, 10% FBS (Invitrogen), penicillin 100 U/mL (Invitrogen), streptomycin 100 μg/mL (Invitrogen), and amphotericine B 0.25 μg/mL (Invitrogen). The cells were cultured at 37°C in a humidified atmosphere containing 5% CO2 and subcultured at 80% confluence. Hepatocytes grown to 80% to 90% confluence were pretreated with the specific MEK1/2 inhibitor PD98059 (20 μmol/L; Calbiochem) or dimethylsulfoxide (DMSO) for 30 minutes in serum‐free DMEM, followed by the addition of palmitate 250 μmol/L (Sigma‐Aldrich) or BSA (Sigma‐Aldrich). After incubation for 24 hours, cells were harvested, washed with ice‐cold PBS, and lysed in buffer containing Tris‐HCl 20 mmol/L, pH 7.4, NaCl 150 mmol/L, Na2EDTA 1 mmol/L, EGTA 1 mmol/L, 1% NP‐40, sodium pyrophosphate 2.5 mmol/L, β‐glycerophosphate 1 mmol/L, Na2VO4 1 mmol/L, PMSF 1 mmol/L, and protease inhibitor cocktail. The protein lysates were used for Western blot analysis.
Measurement of Vascular Superoxide Production
The superoxide production of aortic rings was assessed with dihydroethidium (DHE) (Invitrogen Molecular Probes), as previously described.17 Frozen sections of the aortic rings were immediately cut into 10‐μm‐thick sections and placed on glass slides. Samples were then incubated at room temperature for 30 minutes with DHE (2×10⁻⁶ mol/L) and protected from light. Images were obtained with a microscopic system (BZ‐8000; Keyence) with an excitation wavelength of 540 nm and an emission wavelength of 605 nm. The fluorescence intensity of DHE staining was measured using NIH Image J 1.42 (National Institutes of Health, public domain software).
Measurement of H2O2 in Aorta
Mice were killed via pentobarbital injection. Aortas were excised, and adherent fat was removed. H2O2 was measured using a fluorometric horseradish peroxidase–linked assay (Amplex red assay; Molecular Probes).18 Briefly, aortic segments (5‐mm rings) were incubated with Amplex red (50 μmol/L) and horseradish peroxidase (0.1 U/mL) for 30 minutes at 37°C in Krebs‐Ringer phosphate buffer protected from light. Fluorescence was measured (excitation at 530 nm, fluorescence emission detection at 590 nm). H2O2 release was calculated using H2O2 standards and expressed as picomoles per milligram of dry tissue.
Preparation of Aortic Rings and Organ Chamber Experiments
Measurement of isometric tension was performed as described previously.19 Thoracic aortas from mice were cut into 3‐mm rings with special care to preserve the endothelium and mounted in organ baths filled with Krebs' Ringer bicarbonate solution (NaCl 118.3 mmol/L, KCl 4.7 mmol/L, CaCl2 2.5 mmol/L, MgSO4 1.2 mmol/L, KH2PO4 1.2 mmol/L, NaHCO3 25 mmol/L, d‐glucose 5.5 mmol/L) aerated with 95% O2 and 5% CO2 at 37°C. The preparations were attached to a force transducer, and isometric tension was recorded. Vessel rings were primed with KCl (30 mmol/L) and then precontracted with l‐phenylephrine (10−6.5 mol/L), producing a submaximal contraction. After the plateau was attained, the rings were exposed to increasing concentrations of acetylcholine (10−9 to 10−5 mol/L) or sodium nitroprusside (10−9 to 10−5 mol/L) to obtain cumulative concentration‐response curves.
Statistical Analysis
Results are presented as mean±SEM. The Kolmogorov‐Smirnov test was used to test normality. Data for body weights, GTTs, ITTs, and vascular relaxation were analyzed by 2‐way ANOVA with repeated measures followed by the post hoc test with Bonferroni correction for multiple comparison. The other data were analyzed by 1‐way ANOVA followed by the post hoc test with Bonferroni correction for multiple comparison or Kruskal‐Wallis test followed by Dunn's multiple comparison test. All statistical analyses were performed with GraphPad Prism Software version 5.02. A P value of <0.05 was considered to be statistically significant. In the graphed data, P values are denoted as *<0.05, **0.01, and ***0.001.
Results
Generation and Characteristics of LE2KO
Efficiency and specificity of the ERK2 deletion were assessed in various tissue lysates from 3 control mice and LE2KO. As shown in Figure 1A, ERK2 expression was unaffected in the liver from ERK2(lox/lox) and Alb‐Cre mice compared with wild‐type mice, indicating that ERK2 expression is affected by neither the loxP modification of the ERK2 locus nor the Alb‐Cre recombinase transgene alone. By contrast, LE2KO exhibited a reduction in ERK2 protein in the whole liver lysates, consistent with hepatocyte‐specific deletion. The level of ERK2 protein in aorta, heart, kidney, skeletal muscle, brain, and white adipose tissue was equal to that of controls (Figure 1A). Immunohistochemical findings of the liver from LE2KO also demonstrated a reduction in ERK2 expression in hepatocytes compared with controls (Figure 1B, lower right).
Figure 1.
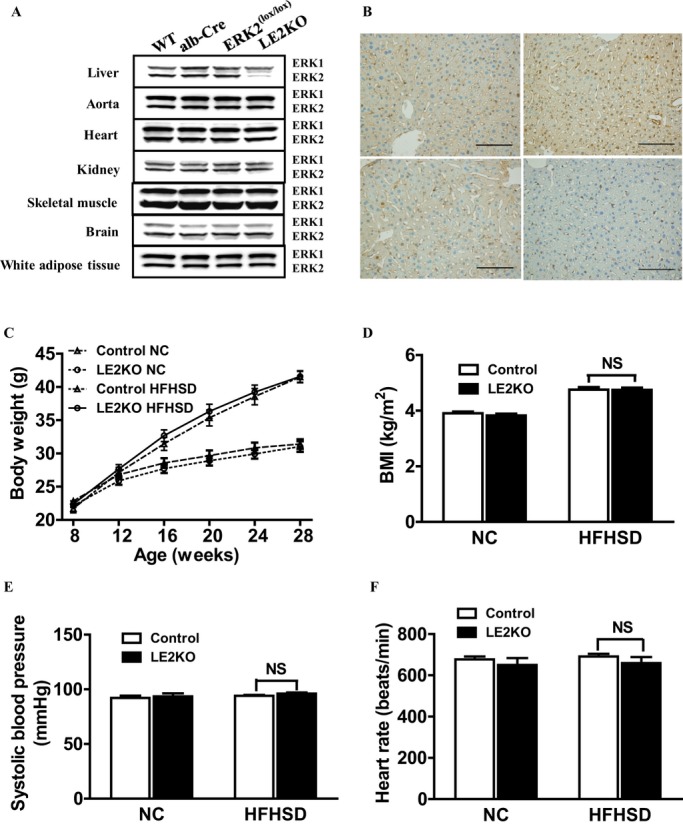
Efficiency of ERK2 deletion and characteristics of LE2KO. (A) ERK1/2 expression in the indicated tissues as detected by western blotting at 8 weeks of age. (B) Immunohistochemistry with anti‐ERK2 antibody in livers from the WT (upper left), Alb‐Cre (upper right), ERK2(lox/lox) (lower left), and LE2KO (lower right) at 8 weeks of age. Scale bars, 100 μm. (C) Weight curves for controls and LE2KO on NC or HFHSD, respectively (n=13 for each group). (D–F) BMI (D) (n=13 for each group), systolic blood pressure (E) (controls on NC; n=5, LE2KO on NC; n=5, controls on HFHSD; n=6, LE2KO on HFHSD; n=6), and heart rate (F) (controls on NC; n=5, LE2KO on NC; n=5, controls on HFHSD; n=6, LE2KO on HFHSD; n=6) in controls and LE2KO on NC or HFHSD, respectively. Error bars represent SEM. Alb‐Cre indicates An albumin promoter–driven Cre recombinase transgenic mouse; BMI, body mass index; ERK, extracellular signal‐regulated kinase; HFHSD, high‐fat/high‐sucrose diet; LE2KO, liver‐specific ERK2 knockout mice; NC, normal chow; WT, wild‐type.
LE2KO and controls [ERK2(lox/lox) used as control mice] were weaned onto either HFHSD or NC for 20 weeks. LE2KO had similar increases in body weight and body mass index to the control littermates, on HFHSD for 20 weeks (Figure 1C and 1D). Blood pressure and heart rate were not different between the controls and LE2KO when fed HFHSD (Figure 1E and 1F).
Deletion of Hepatic ERK2 Induces Deterioration of HST During Metabolic Overload
In the basal state at 8 weeks, no changes in the histological character of the liver were observed in LE2KO (data not shown). However, in the HFHSD‐fed LE2KO, there was a marked deterioration in HST (Figure 2A) compared with the controls, as indicated by higher serum alanine aminotransferase levels (controls fed NC: 6.9±0.5 IU/L [n=11], controls fed HFHSD: 20.3±2.8 IU/L [n=12], LE2KO fed NC: 6.6±0.4 IU/L [n=11], LE2KO fed HFHSD: 43.0±6.1 IU/L [n=12], P<0.001 versus controls fed HFHSD) (Figure 2B) and liver weight (controls fed NC: 1.05±0.01 g [n=12], controls fed HFHSD: 1.27±0.05 g [n=12], LE2KO fed NC: 1.04±0.01 g [n=12], LE2KO fed HFHSD: 1.69±0.11 g [n=12], P<0.001 versus controls fed HFHSD) (Figure 2C). Evaluation of liver lipid contents revealed a significant increase in TG content (controls fed NC: 51.9±5.1 mg/g liver [n=8], controls fed HFHSD: 94.3±2.8 mg/g liver [n=8], LE2KO fed NC: 63.1±3.9 mg/g liver [n=8], LE2KO fed HFHSD: 129.8±3.1 mg/g liver [n=8], P<0.001 versus controls fed HFHSD) in LE2KO fed HFHSD compared with controls fed HFHSD (Figure 2D). The TC content in the liver was not different between LE2KO and controls whether fed NC or HFHSD (Figure 2E).
Figure 2.
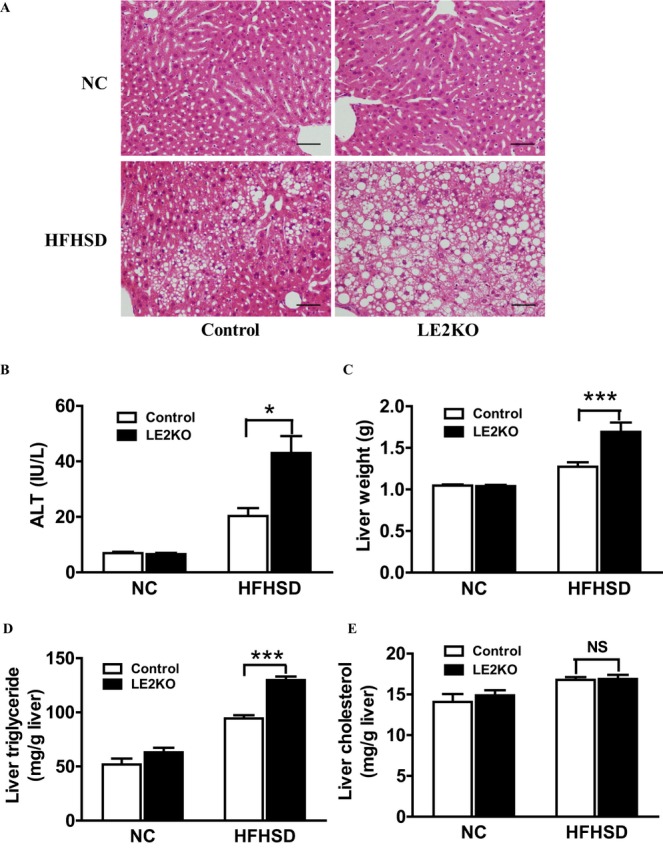
Deletion of hepatic ERK2 aggravates HST during metabolic overload. (A) Hematoxylin and eosin staining of liver sections for controls and LE2KO fed NC or HFHSD. Scale bars, 100 μm. (B) Serum ALT levels of controls and LE2KO fed NC or HFHSD for 20 weeks (controls on NC; n=11, LE2KO on NC; n=11, controls on HFHSD; n=12, LE2KO on HFHSD; n=12). (C) Liver weights of controls and LE2KO fed NC or HFHSD for 20 weeks (n=12 for each group). (D, E) Liver triglyceride (D) and total cholesterol content (E) measurements for controls and LE2KO fed NC or HFHSD (n=8 for each group). Error bars represent SEM. *P<0.05, ***P<0.001 vs. controls fed HFHSD. ALT indicates alanine aminotransferase; ERK, extracellular signal‐regulated kinase; HFHSD, high‐fat/high‐sucrose diet; HST; hepatosteatosis; LE2KO, liver‐specific ERK2 knockout mice; NC, normal chow.
HFHSD‐Fed LE2KO Have Increased Serum FFA Levels Without Changes in TG
To evaluate the serum lipid profile, we measured the levels of serum TC, TG, HDL‐C, and FFA. There was no significant difference in serum TC (Figure 3A), TG (Figure 3B), and HDL‐C (Figure 3C) between the LE2KO and controls fed either diet. The serum level of FFA was modestly increased in LE2KO on HFHSD (Figure 3D).
Figure 3.
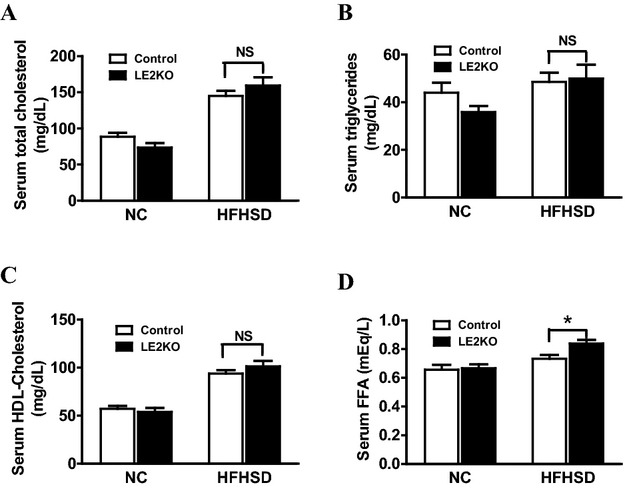
Measurement of serum lipid parameters. (A–D) Serum levels of TC (A), TG (B), HDL‐C (C), and FFA (D) in controls and LE2KO fed NC or HFHSD, respectively (controls on NC; n=11, LE2KO on NC; n=11, controls on HFHSD; n=12, LE2KO on HFHSD; n=12). Error bars represent SEM. *P<0.05 vs. controls fed HFHSD. ERK indicates extracellular signal‐regulated kinase; FFA, free fatty acid; HDL‐C, high‐density lipoprotein cholesterol; HFHSD, high‐fat/high‐sucrose diet; LE2KO, liver‐specific ERK2 knockout mice; NC, normal chow; TC, total cholesterol; TG, triglyceride.
HFHSD‐Fed LE2KO Exhibit Decreases SERCA2 Expression and Induction of ER Stress
To investigate the mechanism by which HST was aggravated in HFHSD‐fed LE2KO, we used oligo‐DNA microarray analysis. Among 23 522 distinct genes, the representative ones showing 2‐fold upregulation or 2‐fold downregulation in the livers of LE2KO compared with the control when fed HFHSD are listed in Table 2. Detoxify genes (Gsta, Aldh1, and Cyp2a) and those for FFA synthesis (Acsm3 and AacS) and glucokinase were upregulated. Genes related to carbohydrate and FFA catabolism (Hk2, Pkm2, Pkfm, Pdk4, Fabp, Lpl, and Cpt1b) and mitochondrial enzymes (Cox6a/7a, Ucp3, and Aco2) were downregulated. Among several upregulated pathways revealed by pathway analysis that was also conducted (Table 3), those for fatty acid/statin and prostaglandin synthesis were upregulated in LE2KO on HFHSD, suggesting changes in lipid metabolism. Carbohydrate metabolic pathways were markedly downregulated (glycolysis/gluconeogenesis/glycogen/fructose/mannose metabolism/tricarboxylic acid cycle), as well as insulin signaling, suggesting insulin resistance in the liver. Inflammatory responses and matrix metalloproteinases were also downregulated. Interestingly, genes related to muscle relaxation/constriction (including intracellular Ca2+ regulation) were markedly downregulated in LE2KO, including P‐type Ca2+ transporters such as Na+,K+‐ATPase (ATP1a2) and SERCA2 (ATP2a1‐2).
Table 2.
Representative Genes Detected by DNA Gene‐Chip Analysis of the Liver, Comparing Controls and LE2KO Fed With HFHSD
| Symbol | Description | Cy5 Controls | Cy3 LE2KO | Ratio (Cy3/Cy5) |
|---|---|---|---|---|
| Upregulated genes | ||||
| Gsta2 | Glutathione S‐transferase, α2 (Yc2) | 130 | 269 | 2.06 |
| Gstal | Glutathione S‐transferase, α1 (Ya) | 43 | 177 | 4.11 |
| Aldhla7 | Aldehyde dehydrogenase family 1, subfamily A7 | 1358 | 3121 | 2.30 |
| Aldhlbl | Aldehyde dehydrogenase 1 family, member Bl | 90 | 224 | 2.47 |
| Cyp2a4 | Cytochrome P450, family 2, subfamily a, polypeptide 4 | 1084 | 3353 | 3.09 |
| Cyp2al2 | Cytochrome P450, family 2, subfamily a, polypeptide 12 | 2266 | 5805 | 2.56 |
| Acsm3 | Acyl‐CoA synthetase medium‐chain family member 3 | 615 | 1317 | 2.14 |
| Aacs | Acetoacetyl‐CoA synthetase | 48 | 102 | 2.12 |
| Bhmt | Betaine‐homocysteine methyltransferase | 5249 | 14894 | 2.84 |
| Gck | Glucokinase | 103 | 213 | 2.08 |
| Downregulated genes | ||||
| Akrlb3 | Aldo‐keto reductase family 1, member B3 (aldose reductase) | 448 | 35 | 0.08 |
| Atp2al | ATPase, Ca2+ transporting, cardiac muscle, fast twitch 1 | 5267 | 17 | 0.00 |
| Atp2a2 | ATPase, Ca2+ transporting, cardiac muscle, slow twitch 2 | 962 | 415 | 0.43 |
| Atpla2 | ATPase, Na+,K+ transporting, α2 polypeptide | 406 | 11 | 0.03 |
| Fabp4 | Fatty acid binding protein 4, adipocyte | 6386 | 233 | 0.04 |
| Fabp3 | Fatty acid binding protein 3, muscle and heart | 8376 | 62 | 0.01 |
| Lpl | Lipoprotein lipase | 1571 | 80 | 0.05 |
| Cptlb | Carnitine palmitoyltransferase lb, muscle | 312 | 29 | 0.09 |
| Hk2 | Hexokinase 2 | 499 | 11 | 0.02 |
| Pkm2 | Pyruvate kinase, muscle | 941 | 26 | 0.03 |
| Pflcm | Phosphofructokinase, muscle | 3257 | 92 | 0.03 |
| Fbp2 | Fructose bisphosphatase 2 | 214 | 5 | 0.02 |
| Pdk4 | Pyruvate dehydrogenase kinase, isoenzyme 4 | 1831 | 87 | 0.05 |
| Cox7al | Cytochrome c oxidase, subunit Vila 1 | 1780 | 53 | 0.03 |
| Cox6a2 | Cytochrome c oxidase, subunit VI a, polypeptide 2 | 1455 | 11 | 0.01 |
| Ucp3 | Uncoupling protein 3 (mitochondrial, proton carrier) | 172 | 7 | 0.04 |
| Aco2 | Acoritase 2, mitochondrial | 2094 | 937 | 0.45 |
HFHSD indicates high‐fat/high‐sucrose diet; LE2KO, liver‐specific ERK2 knockout mice.
Table 3.
Pathway Analysis in DNA Gene‐Chip Analysis of the Liver, Comparing Controls and LE2KO Fed With HFHSD
| MAPP Name* | LE2KO vs Control with HFHSD <0.5 | |||
|---|---|---|---|---|
| No. of Genes | Z Score | PermuteP | ||
| 1 | Striated_Muscle_Contraction_WP216_33380 | 23 | 13.73 | 0 |
| 2 | Glycolysis_Gluconeogenesis | 10 | 4.64 | 0 |
| 3 | Glycogen_Metabolism_WP317_35726 | 8 | 4.35 | 0 |
| 4 | Myometrial_Relaxation_and_Contraction_Pathways_WP385_35258 | 20 | 3.52 | 0 |
| 5 | TCA_Cycle_WP434_32430 | 6 | 3.19 | 0.01 |
| 6 | Glycolysis_and_Gluconeogenesis_WP 157_34413 | 7 | 3.14 | 0.01 |
| 7 | Mm_Fructose_and_mannose_metabolism | 6 | 2.99 | 0.01 |
| 8 | Matrix_Metaloproteinases_WP441_35331 | 5 | 2.52 | 0.03 |
| 9 | Insulin_Signaling_WP65_33395 | 17 | 2.5 | 0.02 |
| 10 | Inflammatory_Response_Pathway_WP458_32109 | 5 | 2.43 | 0.03 |
| 11 | Diurnally_regulated_genes_with_circadian_orthologs_WP1268_32865 | 6 | 2.1 | 0.05 |
| MAPP Name* | LE2KO vs Control with HFHSD >2.0 | |||
|---|---|---|---|---|
| No. of genes | Z Score | PermuteP | ||
| 1 | Gamma_Hexachlorocyclohexane_degradation | 12 | 11.01 | 0 |
| 2 | Fatty acid metabolism | 12 | 9.29 | 0 |
| 3 | Tryptophan metabolism | 12 | 8.35 | 0 |
| 4 | Statin pathway(PharmGKB) WP1 35542 | 4 | 4.85 | 0 |
| 5 | Phase_I,_non_P450_WP1255_33045 | 2 | 3.82 | 0.02 |
| 6 | Ptfl a_related_regulatory_pathway_WP201_35872 | 2 | 3.55 | 0.03 |
| 7 | Prostaglandin_Synthesis_and_Regulation_WP374_33046 | 4 | 3.44 | 0 |
HFHSD indicates high‐fat/high‐sucrose diet; LE2KO, liver‐specific ERK2 knockout mice.
Significantly enhanced pathways with numbers of related genes that were downregulated >2‐fold.
Significantly enhanced pathways with numbers of related genes that were upregulated >2‐fold.
Because downregulation of SERCA could induce ER stress, resulting in metabolic remodeling, we evaluated the protein and mRNA expressions of SERCA2, a key molecule in ER stress. Western blot analysis and real‐time PCR revealed that SERCA2 expression levels were comparable between LE2KO and controls fed NC, whereas in the case of mice fed HFHSD, they were decreased in LE2KO compared with the controls (Figure 4A and 4B).
Figure 4.
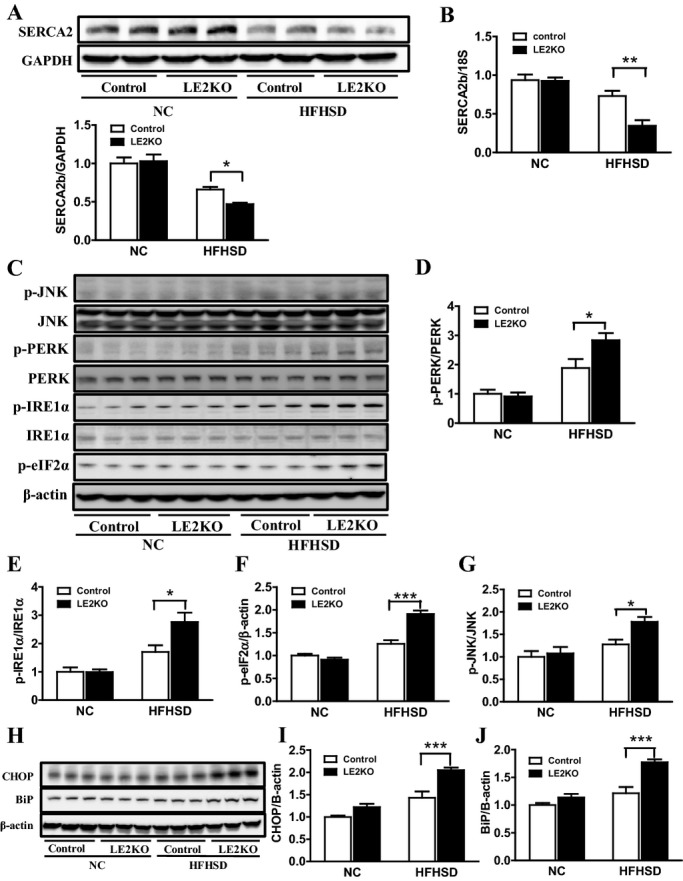
HFHSD‐fed LE2KO have decreased SERCA2b expression and increased ER stress. (A, B) SERCA2 protein (A) (n=10 for each group) and mRNA levels (B) (n=6 for each group) in the livers of controls and LE2KO on NC or HFHSD, respectively. (C) Phosphorylation of PERK (Thr980), IRE1α (Ser724), eIF2α (Ser51), and JNK (Thr183/Tyr185) in the livers of controls and LE2KO on NC or HFHSD, respectively (n=6 for each group). (D–G) Quantification of phospho‐PERK/PERK (D), phospho‐IRE1α/IRE1α (E), phospho‐eIF2α/β‐actin (F), and phospho‐JNK/JNK ratio (G) (n=6 for each group). (H) CHOP and BiP protein expression levels in the livers of controls and LE2KO on NC or HFHSD, respectively (n=6 for each group). (I, J) Quantification of CHOP/β‐actin (I) and BiP/β‐actin ratio (J). Error bars represent SEM. *P<0.05, **P<0.01, ***P<0.001 vs controls fed HFHSD. BiP indicates immunoglobulin heavy‐chain binding protein; CHOP, C/EBP homologous protein; eIF2α, eukaryotic initiation factor 2α; ER, endoplasmic reticulum; ERK, extracellular signal‐regulated kinase; HFHSD, high‐fat/high‐sucrose diet; IRE1α, inositol‐requiring enzyme 1α; JNK, c‐Jun N‐terminal kinase; LE2KO, liver‐specific ERK2 knockout mice; NC, normal chow; PERK, PER‐like ER kinase.
Next, to determine if hepatic ER stress was induced in HFHSD‐fed LE2KO, the phosphorylation of ER membrane proteins phospho‐PERK (Thr 980) and phospho‐IRE1α (Ser724), and its downstream protein phospho‐eIF2α (Ser51), was analyzed by Western blotting (Figure 4C). The phosphorylation of PERK, IRE1α, and eIF2α was increased in HFHSD‐fed LE2KO compared with HFHSD‐fed controls (Figure 4D through 4F). The protein expressions of BiP, an ER molecular chaperone, and CHOP, a stress‐induced transcription factor, were markedly induced in the mice (Figure 4H through 4J). The phosphorylation of JNK was also elevated in livers from HFHSD‐fed LE2KO compared with those from HFHSD‐fed controls (Figure 4G). These results clearly showed that ER stress was induced in HFHSD‐fed LE2KO.
A MEK Inhibitor, PD98059, Decreases SERCA2 Expression and Induces ER Stress in Huh‐7 Cells Only in the Presence of Palmitate
To test the effects of ERK inhibition in hepatocytes with high fat loading, we used the Huh‐7 hepatoma cell line, in the presence or absence of palmitate. As palmitate was absorbed with BSA into the cultured cells, FFA‐free BSA was applied to control cells. Preincubation with PD98059 mostly suppressed phosphorylation of ERK1/2 in cells with BSA or BSA and palmitate (250 μmol/L) (Figure 5A and 5B). However, PD98059 decreased protein expression of SERCA2 only in the presence of palmitate (Figure 5C). PD98059 phosphorylated IRE1α (Figure 5D), upregulated BiP (Figure 5E), and tended to upregulate CHOP (Figure 5F) only in the presence of palmitate. Consistent with LE2KO on HFHSD, ERK inhibition decreased SERCA2 expression and ER stress in Huh‐7 cells with fatty acid loading.
Figure 5.
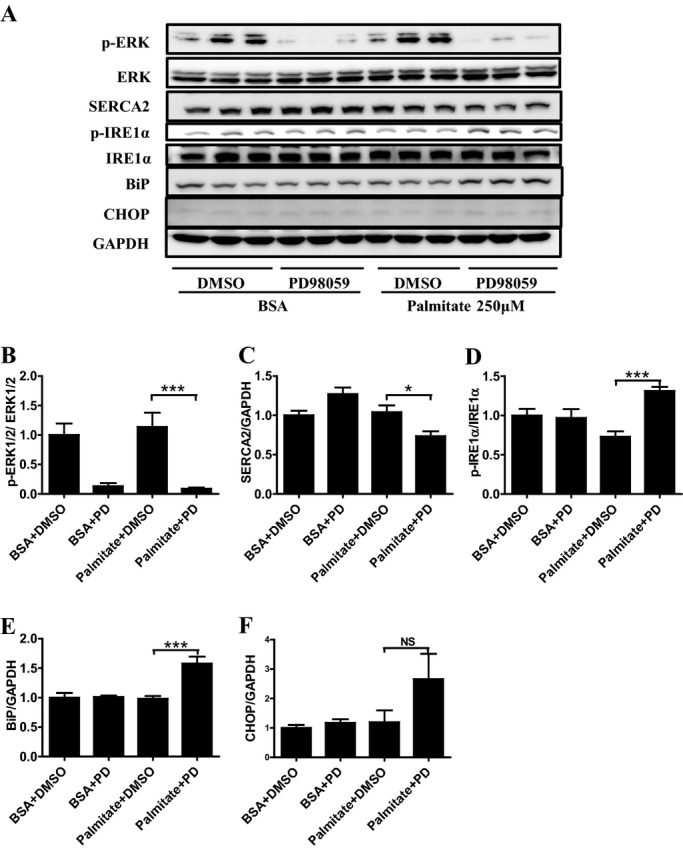
Specific MEK1/2 inhibitor decreases SERCA2 expression and increases ER stress in Huh‐7 cells in presence of palmitate. (A) A representative Western blot of phosphor‐ERK1/2, SERCA2, phosphor‐IRE1α, BiP, and CHOP in the Huh‐7 cells. (B–F) Quantification of phospho‐ERK1/2/ERK1/2 (B), SERCA2/GAPDH (C), phospho‐IRE1α/IRE1α (D), BiP/GAPDH (E), and CHOP/GAPDH ratio (F) (n=6). Error bars represent SEM. *P<0.05, ***P<0.001 vs. palmitate+DMSO. BiP indicates immunoglobulin heavy‐chain binding protein; BSA, bovine serum albumin; CHOP, C/EBP homologous protein; DMSO, dimethylsulfoxide; ER, endoplasmic reticulum; ERK, extracellular signal‐regulated kinase; GAPDH, glyceraldehyde‐3‐phosphate dehydrogenase; IRE1α, inositol‐requiring enzyme 1α; PD, PD98059; SERCA, sarco/endoplasmic reticulum Ca2+‐ATPase.
Serum Fasting Glucose, Insulin, and Oxidative Stress Markers Increased in HFHSD‐Fed LE2KO
To evaluate glucose metabolism and systemic oxidative stress, we measured the levels of blood glucose, ROM, a systemic oxidative stress marker, and BAP, representing systemic antioxidant ability. There was no significant difference regarding fasting blood glucose between LE2KO and controls when fed NC, which were significantly elevated in LE2KO compared with controls when fed HFHSD (Figure 6A). We also measured serum insulin concentrations, which was increased 2‐fold in LE2KO compared with controls, for HFHSD (Figure 6B). In these mice, ROM was elevated (Figure 6C), while BAP was decreased (Figure 6D), indicating the induction of systemic oxidative stress.
Figure 6.
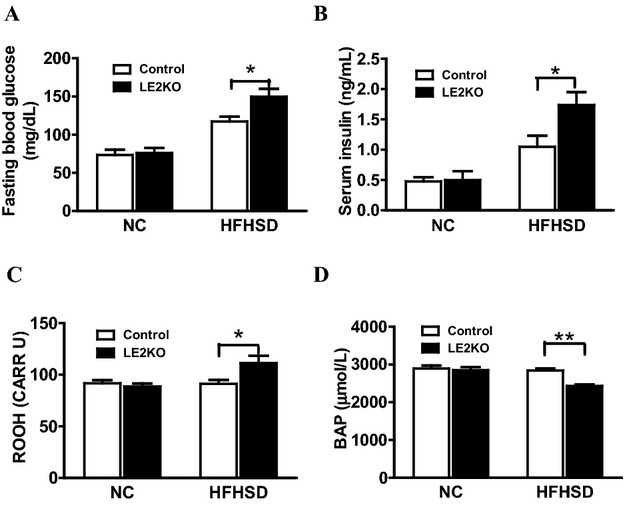
Increased blood glucose with elevated serum insulin and systemic oxidative stress in HFHSD‐fed LE2KO (A, B) Fasting blood glucose (A) (controls on NC; n=9, LE2KO on NC; n=9, controls on HFHSD; n=10, LE2KO on HFHSD; n=10) and serum insulin levels (B) (controls on NC; n=9, LE2KO on NC; n=9, controls on HFHSD; n=12, LE2KO on HFHSD; n=12) in controls and LE2KO fed NC or HFHSD, respectively. (C, D) Measurements of ROM (C), a systemic oxidative stress marker (n=10 for each group), and BAP (D), an indicator of antioxidant capability (controls on NC; n=10, LE2KO on NC; n=10, controls on HFHSD; n=8, LE2KO on HFHSD; n=8). Error bars represent SEM. *P<0.05, **P<0.01 vs. controls fed HFHSD. BAP indicates biological antioxidant potential; ERK, extracellular signal‐regulated kinase; HFHSD, high‐fat/high‐sucrose diet; LE2KO, liver/specific ERK2 knockout mice; NC, normal chow; ROM, reactive oxygen metabolites.
Glucose Tolerance and Insulin Sensitivity Impaired in HFHSD‐Fed LE2KO
Because HST is associated with hepatic insulin resistance, and insulin signaling and carbohydrate metabolism were markedly downregulated in pathway analysis using Gene‐Chip, we assessed the metabolic characteristics of the HFHSD‐fed LE2KO. To evaluate glucose metabolism and insulin sensitivity, we performed the GTT and ITT. In the GTT, blood glucose levels were not different between LE2KO and controls fed NC, whereas for HFHSD‐fed LE2KO, compared with the HFHSD controls, there was a significant increase in blood glucose levels at 15, 30, and 60 minutes after oral glucose intake (Figure 7A). There was also a blunted response to insulin at 40, 60, and 120 minutes in these mice in the ITT (Figure 7B). Thus, hepatic ERK2 deficiency dysregulated carbohydrate metabolism and markedly increased insulin resistance in mice that were under obesity‐induced metabolic stress.
Figure 7.
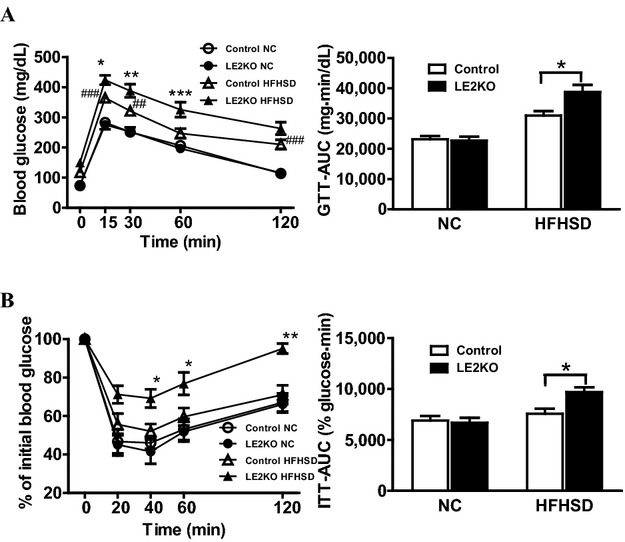
HFHSD‐fed LE2KO display impaired glucose tolerance and insulin sensitivity. (A, B) GTTs and area under glucose–time curve (AUC) for glucose levels (A) (controls on NC; n=9, LE2KO on NC; n=9, controls on HFHSD; n=10, LE2KO on HFHSD; n=10), and ITTs and AUC for glucose levels (B) (controls on NC; n=9, LE2KO on NC; n=9, controls on HFHSD; n=9, LE2KO on HFHSD; n=9), for controls and LE2KO on NC or HFHSD for 18 to 20 weeks, respectively. GTT and ITT results are expressed as mean blood glucose concentration±SEM and mean percent of basal blood glucose concentration±SEM, respectively. Error bars represent SEM. *P<0.05, **P<0.01, ***P<0.001 vs. controls fed HFHSD; ##P<0.01, ###P<0.001 vs. controls fed NC. AUC indicates glucose‐time curve; ERK, extracellular signal‐regulated kinase; GTTs, Glucose tolerance tests; HFHSD, high‐fat/high‐sucrose diet; ITTs, insulin tolerance tests; LE2KO, liver‐specific ERK2 knockout mice; NC, normal chow.
Vascular ROS Production Markedly Increases With Upregulation of Nox1 and Nox4 in HFHSD‐Fed LE2KO
Although no remarkable histological changes in cardiovascular morphology were observed in the HFHSD‐fed LE2KO (Figure 8A through 8C), metabolic risk factors for vascular diseases—such as aggravated HST, insulin resistance, impaired glucose tolerance, and elevated serum FFA—were present, and induction of systemic oxidative stress was observed. As these metabolic changes can induce vascular oxidative stress, we assessed vascular ROS production using DHE staining and the Amplex red assay. Aortic superoxide production was elevated by 1.8‐fold in LE2KO on HFHSD (controls fed NC: 2.1±0.1 a.u. [n=5], controls fed HFHSD: 2.2±0.2 a.u. [n=6], LE2KO fed NC: 2.1±0.1 a.u. [n=5], LE2KO fed HFHSD: 4.0±0.3 a.u. [n=6], P<0.01 versus controls fed HFHSD) (Figure 9A and 9B). H2O2 production assessed by the Amplex red assay was also elevated in aortas from LE2KO on HFHSD (Figure 9C).
Figure 8.
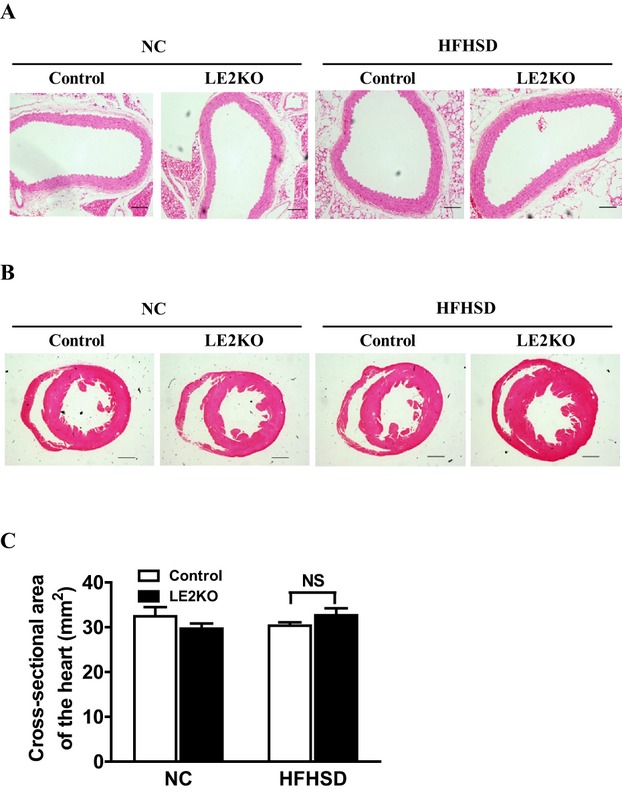
Histological findings for aorta and heart. (A) Hematoxylin and eosin staining of aorta sections from controls and LE2KO fed NC or HFHSD, respectively. Scale bars, 100 μm. (B) Morphology and fibrosis of hearts from controls and LE2KO fed NC or HFHSD, respectively (upper: lower‐power views of hearts; scale bar, 1.0 mm, middle: higher‐power views of hearts; scale bar, 100 μm, lower: Masson's trichrome staining; scale bar, 100 μm). (C) Cross‐sectional area of hearts from controls and LE2KO fed NC or HFHSD, respectively (controls on NC; n=6, LE2KO on NC; n=7, controls on HFHSD; n=6, LE2KO with HFHSD; n=7). Error bars represent SEM. ERK indicates extracellular signal‐regulated kinase; HFHSD, high‐fat/high‐sucrose diet; LE2KO, liver‐specific ERK2 knockout mice; NC, normal chow.
Figure 9.
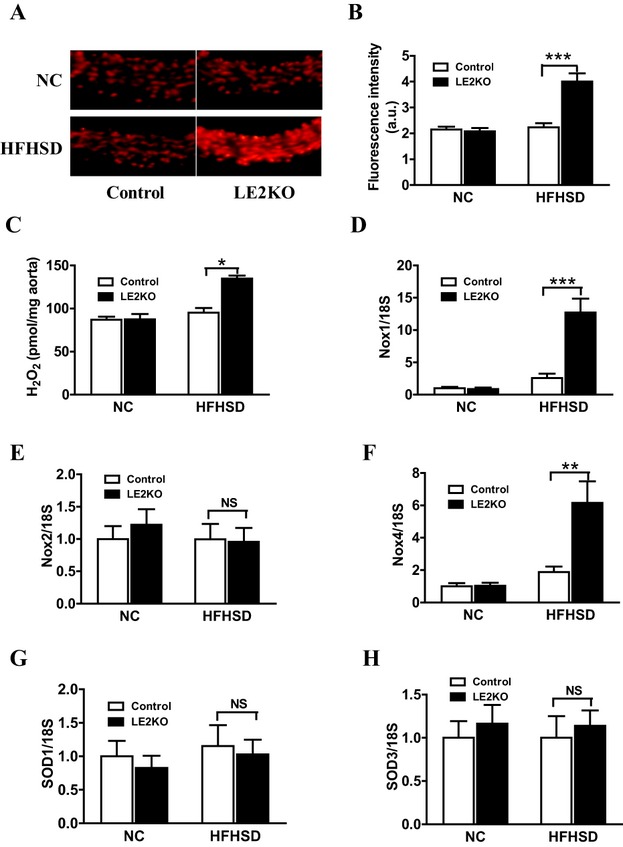
HFHSD‐fed LE2KO demonstrate increased aortic superoxide production and aortic H2O2 release accompanied by elevated Nox1 and Nox4 gene expressions. (A, B) DHE staining of liver sections (A) and quantification of DHE fluorescence intensity (B) in controls and LE2KO on NC or HFHSD, respectively (controls on NC; n=5, LE2KO on NC; n=5, controls on HFHSD; n=6, LE2KO on HFHSD; n=6). (C) Measurements of aortic H2O2 release in controls and LE2KO on NC or HFHSD, respectively (n=8 for each group). (D‐H) mRNA expressions of Nox1, Nox2, Nox4, SOD1 and SOD3 aortas from controls and LE2KO on NC or HFHSD, respectively (n=5 for each group). Error bars represent SEM. *P<0.05, **P<0.01, ***P<0.001 vs. controls fed HFHSD. DHE indicates dihydroethidium; ERK, extracellular signal‐regulated kinase; HFHSD, high‐fat/high‐sucrose diet; LE2KO, liver‐specific ERK2 knockout mice; NC, normal chow; Nox, nicotinamide adenine dinucleotide phosphate oxidase.
We also assessed mRNA expression levels of Nox and SOD isoforms in aortas by real‐time PCR. The expressions of Nox1 (Figure 9D) and Nox4 (Figure 9F) were markedly increased in aortas from LE2KO fed HFHSD, without changing Nox2 (Figure 9E), SOD1 (Figure 9G), and SOD3 expressions (Figure 9H).
Markedly Decreased Endothelium‐Dependent Relaxation With Reduced eNOS Phosphorylation in HFHSD‐Fed LE2KO
As vascular oxidative stress has been seen to aggravate endothelial dysfunction in various disease models, we next assessed endothelium‐dependent, acetylcholine‐induced relaxation with isometric tension measurement in aortic rings. Endothelium‐dependent, acetylcholine‐induced relaxation was not different between LE2KO and the controls on NC, whereas endothelium‐dependent, acetylcholine‐induced relaxation was markedly decreased in aortic rings from HFHSD‐fed LE2KO (controls fed NC: 67.5±5.2% [n=10], controls fed HFHSD: 59.3±5.2% [n=10], LE2KO fed NC: 68.7±4.4% [n=9], LE2KO fed HFHSD: 33.2±8.4% [n=9] with acetylcholine 10−6 mol/L, P<0.01 versus controls fed HFHSD) (Figure 10A), although there was no significant difference in sodium nitroprusside–induced relaxation (Figure 10B).
Figure 10.
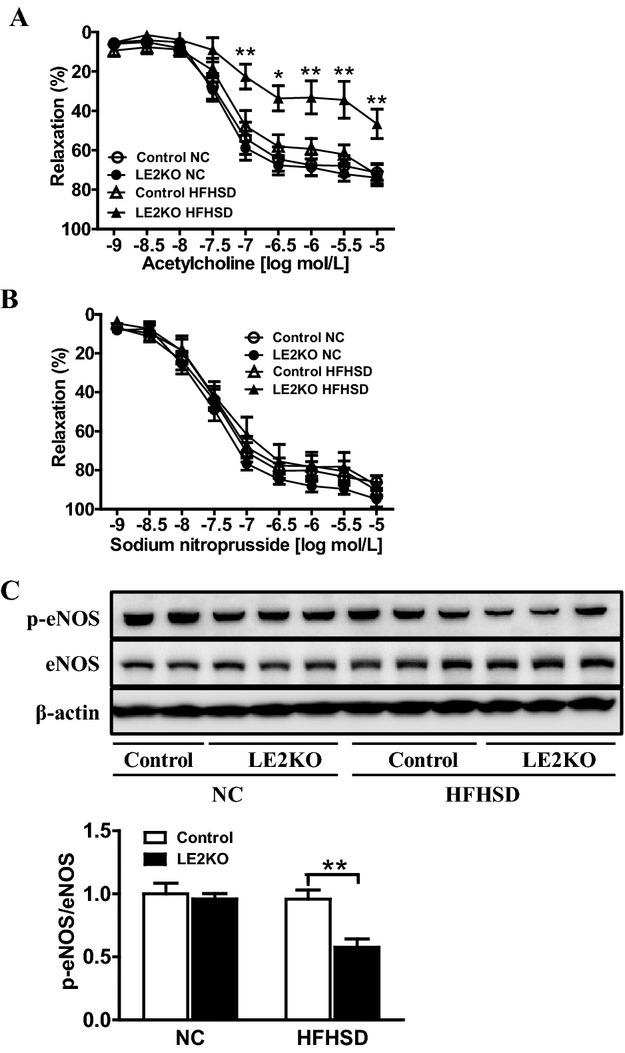
Endothelium‐dependent relaxation is markedly decreased in LE2KO fed HFHSD. (A, B) Vascular relaxation of aortic rings with ACh (C) (controls on NC; n=10, LE2KO on NC; n=10, controls on HFHSD; n=9, LE2KO on HFHSD; n=9) and SNP (D) (controls on NC; n=8, LE2KO on NC; n=8, controls on HFHSD; n=10, LE2KO on HFHSD; n=10) on NC or HFHSD for 20 weeks, respectively. Results of relaxation are expressed as percentage changes in steady‐state level of contraction with 10−6.5 mol/L phenylephrine. (C) A representative western blot and quantification of phospho‐eNOS (Ser 1177)/ eNOS (n=6 for each group). Error bars represent SEM. *P<0.05, **P<0.01 vs. controls fed HFHSD. ACh indicates acetylcholine; ERK, extracellular signal‐regulated kinase; HFHSD, high‐fat/high‐sucrose diet; LE2KO, liver‐specific ERK2 knockout mice; NC, normal chow; SNP, sodium nitroprusside.
Next, we assessed the phosphorylation of eNOS, which modulates NO release. The phosphorylation of eNOS at Ser1177 is important for the catalytic activity of the enzyme. Phosphorylation at Ser1177 was markedly decreased in HFHSD‐fed LE2KO (Figure 10C), which indicated that impairment of endothelium‐dependent, acetylcholine‐induced relaxation in the aorta was associated with reduced eNOS function and elevated ROS production.
Discussion
This study is the first to demonstrate the role of hepatic ERK2 in HST and metabolic remodeling in a mouse model of ORD. Hepatic ERK2 deficiency brought about impaired glucose tolerance with marked insulin resistance and increased serum FFA and oxidative metabolite levels. In seeking a molecular mechanism for the aggravation of hepatic metabolism, reduced expression of SERCA2, a key molecule in ER stress, was observed in oligo‐DNA Gene‐Chip analysis. In the case of HFHSD, the mRNA and protein levels of hepatic SERCA2 in LE2KO were significantly lower than those in the controls. Also, hepatic BiP and CHOP expression levels were increased in LE2KO on HFHSD, suggesting further induction of ER stress in the liver. Using the cultured cell system, MEK inhibition blunted ERK activation, induced ER stress, and reduced SERCA2 expression only in the presence of high fatty acid.
Our results showed that there was metabolic remodeling of carbohydrate, fatty acid, and peroxides in LE2KO on HFHSD, which was associated with the marked endothelial dysfunction. To investigate the influence on vascular function of HST in HFHSD‐fed LE2KO, we focused on the NO/ROS balance. Vascular ROS production assessed by DHE staining and the Amplex red assay was markedly increased in HFHSD‐fed LE2KO compared with HFHSD‐fed controls, which was accompanied by upregulation of Nox1 and Nox4. The phosphorylation of eNOS at Ser1177 was blunted in aortas from LE2KO on HFHSD. Further, for mice fed HFHSD, endothelium‐dependent relaxation was maintained in aortas from controls but was markedly decreased in those from LE2KO. These results indicated that hepatic ERK2 played an important role in preventing the development of HST via aggravation of ER stress and metabolic remodeling in HFHSD mice and protected them from endothelial dysfunction induced by an NO/ROS imbalance (Figure 11).
Figure 11.
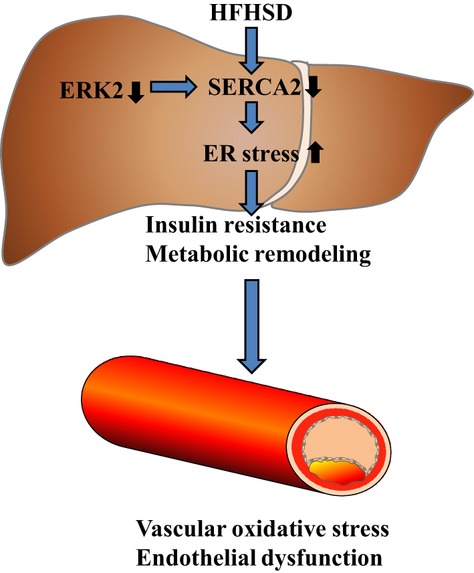
Mechanism of aggravation of insulin resistance, ER stress, metabolic remodeling, oxidative stress, and endothelial dysfunction in LE2KO fed HFHSD. ER indicates endoplasmic reticulum; ERK, extracellular signal‐regulated kinase; HFHSD, high‐fat/high‐sucrose diet; LE2KO, liver‐specific ERK2 knockout mice.
Insulin resistance is widely regarded as an important factor in impairment of endothelial function, though mechanisms have not been completely elucidated. The effects of insulin are organ‐specific, and the portion of insulin signaling pathways that is impaired varies. In vascular tissue from the Zucker obese rat, a typical animal model of insulin resistance, the activation of the IRS/PI3K/Akt pathway due to insulin was impaired despite the preservation of ERK1/2 phosphorylation due to insulin.20 In cultured endothelial cells, the activation of ERK1/2 due to oxidative stress phosphorylated Ser616 of IRS1 and impaired Akt phosphorylation.21 In skeletal muscle from type 2 diabetic patients, the phosphorylation of Akt due to insulin was reduced, although the phosphorylation of ERK was preserved. These findings suggest that the preservation of ERK activation due to insulin may further impair the PI3K/Akt pathway in vascular tissue, aortic endothelial cells, and skeletal muscle in insulin resistance.22 In this regard, Jager et al23 reported that the systemic deletion of ERK1 decreased adipose tissue inflammation and improved glucose uptake of skeletal muscle. However, the role of tissue‐specific ERK cascade in insulin signaling in ORD, especially in the liver, has not been examined yet.
In hepatocyte‐specific insulin receptor–deficient mice, Kahn et al noted impairment of gluconeogenesis, and hyperlipidemia with susceptibility to atherosclerosis,9–10 although the marked HST seen in our model was absent. Hepatocytes express both IRS1 and IRS2, and the metabolic effects of insulin in the liver are decreased gluconeogenesis and increased FFA synthesis,11 both of which can be induced by the IRS/PI3K/Akt pathway. So, the impairment of this pathway could be protective against FFA accumulation in liver, though it could promote gluconeogenesis with FoxO activation. Thus, systemic deletion of ERK1 may improve insulin resistance with upregulation of IRS/PI3K/Akt in endothelium, skeletal muscle, and adipocytes, and the ERK cascades in the liver may play different roles.
Considering the specific metabolic effects of insulin in the liver, we investigated the role of hepatic ERK2 in insulin resistance using LE2KO mice. Interestingly, there was marked aggravation of HST in these mice with HFHSD. Serum insulin levels were markedly increased in HFHSD‐fed LE2O, with glucose levels in the GTT and ITT clearly indicating marked insulin resistance. Although we did not clarify the different effects of ERK1 and ERK2 in the liver, these results show that hepatic ERK2 played a protective role against HST associated with insulin resistance in in vivo.
To elucidate the mechanism for aggravation of HST in LE2KO on HFHSD, we used pathway analysis in the Gene‐Chip experiments. Several lipid‐metabolism pathways, such as those for fatty acids, statins, and prostaglandin synthesis, were upregulated, which was compatible with the lipid accumulation in the liver. Carbohydrate catabolism pathways and mitochondrial proteins (Cox6a/7a, Ucp3, and Aco2) were markedly downregulated, suggesting insulin resistance with mitochondrial dysfunction. We found that SERCA2 (ATP2a1 and ATP2a2) was downregulated in in the gene chips for LE2KO on HFHSD and confirmed that protein and mRNA expressions of SERCA2 were decreased.
Generally, ER stress is induced by depletion of the Ca2+ store in the ER with reduced SERCA2 function.24–27 In the liver, ER stress activates JNK, which can cause insulin resistance and HST.28–29 Based on these previous observations, we assessed ER stress pathways in livers from LE2KO on HFHSD and found that multiple signaling cascades of ER stress, such as PERK, IRE1α, and eIF2α, were activated and that unfolded protein responses (CHOP and BiP) were induced. In the experiments using Huh‐7 cells and palmitate, ERK inhibition with PD98059 decreased SERCA2 expression and induced an ER stress response, similar to that in livers from LE2KO on HFHSD, but this was only in the presence of palmitate. These results indicated that hepatic ERK2 protects against deterioration of hepatic insulin resistance via preservation of SERCA2 expression and suppression of ER stress. They also suggested that the roles of ERK in insulin signaling were tissue specific and hepatic ERK2, which could suppress ER stress, was protective against metabolic remodeling induced by HST in ORD.
The present findings clearly showed that ER stress was induced in HFHSD‐fed LE2KO. The ER is not only the organelle for Ca2+ homeostasis and protein folding; it also regulates lipid biosynthesis and carbohydrate metabolism. SERCA2 maintains ER Ca2+ concentrations, and the translational and posttranslational disruption of SERCA2 activity leads to ER stress and subsequent initiation of the unfolded protein response.25–26,30 Liang et al31 recently showed that impaired MEK/ERK signaling leads to decreased SERCA expression and promotes ER stress in insulin‐resistant macrophages, which is compatible with our observations in in vivo. Park et al32 have shown that SERCA2 levels were markedly reduced in the livers of ob/ob mice with HST and increased ER stress and that overexpression of SERCA2 reduced ER stress and steatohepatitis. Ozcan et al12 have shown that obesity induces ER stress, which plays a central role in the development of insulin resistance and diabetes. Further, IRE1, a major signaling arm of the unfolded protein response, can activate JNK.28 Consistent with the findings of this research, in our HFHSD‐fed LE2KO, phosphorylation of IRE1 and JNK was augmented. The decreased expression of SERCA2 in these mice, which activated the IRE1/JNK pathway, could be a trigger for hepatic ER stress and insulin resistance in vivo.
HFHSD‐fed LE2KO may be an ideal model for investigating communication between the liver and cardiovascular system. The body weight, blood pressure, heart rate, and serum LDL‐C, HDL‐C, and TG levels were not changed compared with the control. Elevation of serum glucose, insulin, and FFA levels can induce systemic oxidative stress, and as a secondary effect, such metabolic changes can cause impairment of endothelial function. In the HFHSD‐fed LE2KO, the serum homocysteine and asymmetrical dimethylarginine levels were modestly elevated (data not shown), which may also contribute to endothelial dysfunction.33–35 We consider that the release of other metabolic mediators from the liver may also play a part. Furthermore, HST with ER stress may alter the release of inflammatory and adipo‐cytokines from the liver. The liver is a source of circulating microparticles in the obese,36 and circulating micro‐RNA in lipid particles from the liver may be another mediator of vascular dysfunction.37–41 We therefore believe that further research on HFHSD‐fed LE2KO may reveal novel mediators of hepatovascular communication related to ORD.
As mentioned, the HFHSD‐fed LE2KO had multiple risk factors for vascular complications. Regarding the increase in vascular ROS production and endothelial dysfunction that we observed, oxidative stress has been seen to disturb NO bioavailability in the vessel wall through multiple mechanisms,42 and inactivation of NO by superoxide and ROS is induced in many vascular diseases.43–44 Moreover, Nox1 and Nox4 were upregulated with no change in Nox2 expression in aortas from LE2KO on HFHSD. Nox1 can be upregulated by many hormones and cytokines, and Nox4 can be upregulated by metabolic stress and insulin. Nox4 can impair SERCA2 through oxidation in metabolic stress.45 Although we did not examine mitochondrial function and ROS, the elevations of intracellular glucose and FFA levels are major factors in the production of superoxide in the mitochondrial electric transport chain, and Gene‐Chip analysis has suggested mitochondrial dysfunction with downregulation of enzymes.46–47 Brownlee et al48 found that mitochondrial superoxide together with metabolic stress elevated flux in several metabolic pathways, whose effects included O‐linked N‐acetylglucosamine modification, which is induced at Ser1177 in eNOS. eNOS uncoupling can be induced by tetrahydrobiopterine oxidation or eNOS monomerization in metabolic diseases.49 Our results are compatible with these previous findings relating to eNOS dysfunction represented by reduced phosphorylation at Ser1177. ROS from multiple sources can cause imbalance in NO/ROS, a key factor in endothelial dysfunction due to metabolic stress in HST.
In this study, we investigated the protective role of hepatic ERK2 in an LE2KO model of ORD, which has many similarities with such diseases in humans. In previous clinical studies, HST in ORD was found to be associated with carotid atherosclerosis in patients and was a strong predictive factor for cardiovascular events in patients with diabetes.2–7 Patients with metabolic syndrome have a cluster of metabolic abnormalities that include visceral obesity, high blood pressure, hyperglycemia, and dyslipidemia, based on insulin resistance and accumulation of visceral fat, followed by the development of vascular dysfunction and atherosclerosis, resulting in cardiovascular events or death. The HFHSD‐fed LE2KO showed time‐course characteristics similar to those of metabolic syndrome, progressing from insulin resistance with hyperinsulinemia and HST with diabetes to endothelial dysfunction. The ER stress associated with reduced SERCA2 expression in the LE2KO will aid our understanding of the pathological implications of HST for vascular complications. We previously showed that oxidative inactivation of SERCA2 in vascular smooth muscle impaired NO bioactivity, which could cause vascular complications in atherosclerosis or diabetes. The downregulation of SERCA2 is a key event in heart failure, thrombosis, the promotion of vascular remodeling, and the impairment of angiogenesis.50–53 Thus, the preservation of SERCA2 expression and function could be an excellent strategy for treating cardiovascular complications in metabolic disorders.
This study was the first to use an LE2KO model of HST, and the development of endothelial dysfunction in the mice fed HFHSD is highly significant. The findings suggest mechanisms of hepatocardiovascular communications. However, there are several limitations, which should be addressed in future studies.
First, we used hepatic ERK2‐deficient mice, although the role of hepatic ERK1 in HST has not yet been elucidated. Systemic ERK1 deficiency was reported to protect against insulin resistance so the roles of ERK1 and ERK2 may be different in each organ. In cultured hepatocytes, the inhibition of both ERK1 and ERK2 with PD98059 aggravated ER stress (Figure 5A), suggesting that the overall activity of hepatic ERK protects against HST. Thus, hepatocyte‐specific ERK1 deletion or ERK1/2 deletion may further clarify the role of hepatic ERK in ORD. Furthermore, the roles of ERK in insulin resistance in other organs have still to be clarified. Second, we observed hepatic ER stress with decreased SERCA2 expression in the LE2KO, but mechanisms whereby ERK regulates SERCA2 expression in the presence of FFA have still to be completely elucidated. While the findings of previous studies suggested that inactivation of SERCA is enough to induce ER stress, we only assessed SERCA2 expression, not its activity, because hepatic SERCA activity was lower than that in the heart or smooth muscle. Further studies using SERCA‐deletion mice or gene transfer of SERCA may clarify the central role of hepatic SERCA in HST and metabolic remodeling. Third, we observed the elevation of serum glucose, FFA, and insulin levels in LE2KO on HFHSD. Other factors, such as (adipo) cytokines and micro‐RNA may be involved in endothelial dysfunction in HST, but residual factors for its induction remain unclear. Furthermore, the mechanisms for the upregulation of Nox1 and Nox4 and the impairment of eNOS function have not been completely clarified. Fourth, the final end point in this study was endothelial dysfunction, and the impact of HST in HFHSD‐fed LE2KO on atherosclerosis or vascular injury was not explored. Finally, previous clinical studies have shown that HST was associated with carotid atherosclerosis and cardiovascular events in patients with diabetes. However, mechanisms for the impairment of ERK function, decreased SERCA2 expression, and induction of ER stress in patients with HST were not investigated in the present study.
Conclusions
Hepatic ERK2 affected glucose and lipid metabolisms, suppressed oxidative stress and insulin resistance, and protected against endothelial dysfunction in a mouse model of ORD, possibly via a decrease in hepatic ER stress. The present study indicates that hepatic ERK2 can maintain endothelial function in HFHSD‐fed mice and the preservation of hepatic ERK signaling, and SERCA expression could be a therapeutic target for cardiovascular diseases in patients with ORD.
Sources of Funding
This work was supported in part by a grant from the Ministry of Defense and the Research Fund of the Mitsukoshi Health and Welfare Foundation.
Disclosures
None.
Acknowledgments
We would like to thank the members of our animal institute for their assistance with animal care and those of Central Research Laboratory of National Defense Medical College for pathological assistance. We also thank Azusa Onodera (Department of Internal Medicine, National Defense Medical College) for technical support.
References
- 1.Villanova N, Moscatiello S, Ramilli S, Bugianesi E, Magalotti D, Vanni E, Zoli M, Marchesini G. Endothelial dysfunction and cardiovascular risk profile in nonalcoholic fatty liver disease. Hepatology. 2005; 42:473-480 [DOI] [PubMed] [Google Scholar]
- 2.Targher G, Bertolini L, Padovani R, Zenari L, Zoppini G, Falezza G. Relation of nonalcoholic hepatic steatosis to early carotid atherosclerosis in healthy men: role of visceral fat accumulation. Diabetes Care. 2004; 27:2498-2500 [DOI] [PubMed] [Google Scholar]
- 3.Brea A, Mosquera D, Martin E, Arizti A, Cordero JL, Ros E. Nonalcoholic fatty liver disease is associated with carotid atherosclerosis: a case‐control study. Arterioscler Thromb Vasc Biol. 2005; 25:1045-1050 [DOI] [PubMed] [Google Scholar]
- 4.Kim HC, Kim DJ, Huh KB. Association between nonalcoholic fatty liver disease and carotid intima‐media thickness according to the presence of metabolic syndrome. Atherosclerosis. 2009; 204:521-525 [DOI] [PubMed] [Google Scholar]
- 5.Targher G, Bertolini L, Padovani R, Rodella S, Zoppini G, Zenari L, Cigolini M, Falezza G, Arcaro G. Relations between carotid artery wall thickness and liver histology in subjects with nonalcoholic fatty liver disease. Diabetes Care. 2006; 29:1325-1330 [DOI] [PubMed] [Google Scholar]
- 6.Fracanzani AL, Burdick L, Raselli S, Pedotti P, Grigore L, Santorelli G, Valenti L, Maraschi A, Catapano A, Fargion S. Carotid artery intima‐media thickness in nonalcoholic fatty liver disease. Am J Med. 2008; 121:72-78 [DOI] [PubMed] [Google Scholar]
- 7.Targher G, Bertolini L, Poli F, Rodella S, Scala L, Tessari R, Zenari L, Falezza G. Nonalcoholic fatty liver disease and risk of future cardiovascular events among type 2 diabetic patients. Diabetes. 2005; 54:3541-3546 [DOI] [PubMed] [Google Scholar]
- 8.Rask‐Madsen C, Kahn CR. Tissue‐specific insulin signaling, metabolic syndrome, and cardiovascular disease. Arterioscler Thromb Vasc Biol. 2012; 32:2052-2059 [DOI] [PMC free article] [PubMed] [Google Scholar]
- 9.Michael MD, Kulkarni RN, Postic C, Previs SF, Shulman GI, Magnuson MA, Kahn CR. Loss of insulin signaling in hepatocytes leads to severe insulin resistance and progressive hepatic dysfunction. Mol Cell. 2000; 6:87-97 [PubMed] [Google Scholar]
- 10.Biddinger SB, Hernandez‐Ono A, Rask‐Madsen C, Haas JT, Aleman JO, Suzuki R, Scapa EF, Agarwal C, Carey MC, Stephanopoulos G, Cohen DE, King GL, Ginsberg HN, Kahn CR. Hepatic insulin resistance is sufficient to produce dyslipidemia and susceptibility to atherosclerosis. Cell Metab. 2008; 7:125-134 [DOI] [PMC free article] [PubMed] [Google Scholar]
- 11.Brown MS, Goldstein JL. Selective versus total insulin resistance: a pathogenic paradox. Cell Metab. 2008; 7:95-96 [DOI] [PubMed] [Google Scholar]
- 12.Ozcan U, Cao Q, Yilmaz E, Lee AH, Iwakoshi NN, Ozdelen E, Tuncman G, Gorgun C, Glimcher LH, Hotamisligil GS. Endoplasmic reticulum stress links obesity, insulin action, and type 2 diabetes. Science. 2004; 306:457-461 [DOI] [PubMed] [Google Scholar]
- 13.Satoh Y, Endo S, Nakata T, Kobayashi Y, Yamada K, Ikeda T, Takeuchi A, Hiramoto T, Watanabe Y, Kazama T. ERK2 contributes to the control of social behaviors in mice. J Neurosci. 2011; 31:11953-11967 [DOI] [PMC free article] [PubMed] [Google Scholar]
- 14.Bradford MM. A rapid and sensitive method for the quantitation of microgram quantities of protein utilizing the principle of protein‐dye binding. Anal Biochem. 1976; 72:248-254 [DOI] [PubMed] [Google Scholar]
- 15.Yasuda T, Grillot D, Billheimer JT, Briand F, Delerive P, Huet S, Rader DJ. Tissue‐specific liver X receptor activation promotes macrophage reverse cholesterol transport in vivo. Arterioscler Thromb Vasc Biol. 2010; 30:781-786 [DOI] [PMC free article] [PubMed] [Google Scholar]
- 16.Yahata T, Suzuki C, Hamaoka A, Fujii M, Hamaoka K. Dynamics of reactive oxygen metabolites and biological antioxidant potential in the acute stage of Kawasaki disease. Circ J. 2011; 75:2453-2459 [DOI] [PubMed] [Google Scholar]
- 17.Miller FJ, Jr, Gutterman DD, Rios CD, Heistad DD, Davidson BL. Superoxide production in vascular smooth muscle contributes to oxidative stress and impaired relaxation in atherosclerosis. Circ Res. 1998; 82:1298-1305 [DOI] [PubMed] [Google Scholar]
- 18.Weber DS, Rocic P, Mellis AM, Laude K, Lyle AN, Harrison DG, Griendling KK. Angiotensin II‐induced hypertrophy is potentiated in mice overexpressing p22phox in vascular smooth muscle. Am J Physiol Heart Circ Physiol. 2005; 288:H37-H42 [DOI] [PubMed] [Google Scholar]
- 19.Dong YF, Liu L, Kataoka K, Nakamura T, Fukuda M, Tokutomi Y, Nako H, Ogawa H, Kim‐Mitsuyama S. Aliskiren prevents cardiovascular complications and pancreatic injury in a mouse model of obesity and type 2 diabetes. Diabetologia. 2010; 53:180-191 [DOI] [PubMed] [Google Scholar]
- 20.Jiang ZY, Lin YW, Clemont A, Feener EP, Hein KD, Igarashi M, Yamauchi T, White MF, King GL. Characterization of selective resistance to insulin signaling in the vasculature of obese Zucker (fa/fa) rats. J Clin Invest. 1999; 104:447-457 [DOI] [PMC free article] [PubMed] [Google Scholar]
- 21.Clavreul N, Bachschmid MM, Hou X, Shi C, Idrizovic A, Ido Y, Pimentel D, Cohen RA. S‐glutathiolation of p21ras by peroxynitrite mediates endothelial insulin resistance caused by oxidized low‐density lipoprotein. Arterioscler Thromb Vasc Biol. 2006; 26:2454-2461 [DOI] [PubMed] [Google Scholar]
- 22.Cusi K, Maezono K, Osman A, Pendergrass M, Patti ME, Pratipanawatr T, DeFronzo RA, Kahn CR, Mandarino LJ. Insulin resistance differentially affects the PI 3‐kinase‐ and MAP kinase‐mediated signaling in human muscle. J Clin Invest. 2000; 105:311-320 [DOI] [PMC free article] [PubMed] [Google Scholar]
- 23.Jager J, Corcelle V, Gremeaux T, Laurent K, Waget A, Pages G, Binetruy B, Le Marchand‐Brustel Y, Burcelin R, Bost F, Tanti JF. Deficiency in the extracellular signal‐regulated kinase 1 (ERK1) protects leptin‐deficient mice from insulin resistance without affecting obesity. Diabetologia. 2011; 54:180-189 [DOI] [PubMed] [Google Scholar]
- 24.Lytton J, Westlin M, Hanley MR. Thapsigargin inhibits the sarcoplasmic or endoplasmic reticulum Ca‐ATPase family of calcium pumps. J Biol Chem. 1991; 266:17067-17071 [PubMed] [Google Scholar]
- 25.Ron D, Walter P. Signal integration in the endoplasmic reticulum unfolded protein response. Nat Rev Mol Cell Biol. 2007; 8:519-529 [DOI] [PubMed] [Google Scholar]
- 26.Schroder M, Kaufman RJ. The mammalian unfolded protein response. Annu Rev Biochem. 2005; 74:739-789 [DOI] [PubMed] [Google Scholar]
- 27.Vangheluwe P, Raeymaekers L, Dode L, Wuytack F. Modulating sarco(endo)plasmic reticulum Ca2+ ATPase 2 (SERCA2) activity: cell biological implications. Cell Calcium. 2005; 38:291-302 [DOI] [PubMed] [Google Scholar]
- 28.Hirosumi J, Tuncman G, Chang L, Gorgun CZ, Uysal KT, Maeda K, Karin M, Hotamisligil GS. A central role for JNK in obesity and insulin resistance. Nature. 2002; 420:333-336 [DOI] [PubMed] [Google Scholar]
- 29.Czaja MJ. JNK regulation of hepatic manifestations of the metabolic syndrome. Trends Endocrinol Metab. 2010; 21:707-713 [DOI] [PMC free article] [PubMed] [Google Scholar]
- 30.Lin JH, Walter P, Yen TS. Endoplasmic reticulum stress in disease pathogenesis. Annu Rev Pathol. 2008; 3:399-425 [DOI] [PMC free article] [PubMed] [Google Scholar]
- 31.Liang CP, Han S, Li G, Tabas I, Tall AR. Impaired MEK signaling and SERCA expression promote ER stress and apoptosis in insulin‐resistant macrophages and are reversed by exenatide treatment. Diabetes. 2012; 61:2609-2620 [DOI] [PMC free article] [PubMed] [Google Scholar]
- 32.Park SW, Zhou Y, Lee J, Ozcan U. Sarco(endo)plasmic reticulum Ca2+‐ATPase 2b is a major regulator of endoplasmic reticulum stress and glucose homeostasis in obesity. Proc Natl Acad Sci U S A. 2010; 107:19320-19325 [DOI] [PMC free article] [PubMed] [Google Scholar]
- 33.Eberhardt RT, Forgione MA, Cap A, Leopold JA, Rudd MA, Trolliet M, Heydrick S, Stark R, Klings ES, Moldovan NI, Yaghoubi M, Goldschmidt‐Clermont PJ, Farber HW, Cohen R, Loscalzo J. Endothelial dysfunction in a murine model of mild hyperhomocyst(e)inemia. J Clin Invest. 2000; 106:483-491 [DOI] [PMC free article] [PubMed] [Google Scholar]
- 34.Sibal L, Agarwal SC, Home PD, Boger RH. The role of asymmetric dimethylarginine (ADMA) in endothelial dysfunction and cardiovascular disease. Curr Cardiol Rev. 2010; 6:82-90 [DOI] [PMC free article] [PubMed] [Google Scholar]
- 35.Yamagishi S, Ueda S, Nakamura K, Matsui T, Okuda S. Role of asymmetric dimethylarginine (ADMA) in diabetic vascular complications. Curr Pharm Des. 2008; 14:2613-2618 [DOI] [PubMed] [Google Scholar]
- 36.Agouni A, Lagrue‐Lak‐Hal AH, Ducluzeau PH, Mostefai HA, Draunet‐Busson C, Leftheriotis G, Heymes C, Martinez MC, Andriantsitohaina R. Endothelial dysfunction caused by circulating microparticles from patients with metabolic syndrome. Am J Pathol. 2008; 173:1210-1219 [DOI] [PMC free article] [PubMed] [Google Scholar]
- 37.Norata GD, Pinna C, Zappella F, Elia L, Sala A, Condorelli G, Catapano AL. MicroRNA 143‐145 deficiency impairs vascular function. Int J Immunopathol Pharmacol. 2012; 25:467-474 [DOI] [PubMed] [Google Scholar]
- 38.Lorenzen J, Kumarswamy R, Dangwal S, Thum T. MicroRNAs in diabetes and diabetes‐associated complications. RNA Biol. 2012; 9:820-827 [DOI] [PubMed] [Google Scholar]
- 39.Chen K, Fan W, Wang X, Ke X, Wu G, Hu C. MicroRNA‐101 mediates the suppressive effect of laminar shear stress on mTOR expression in vascular endothelial cells. Biochem Biophys Res Commun. 2012; 427:138-142 [DOI] [PubMed] [Google Scholar]
- 40.Qin B, Xiao B, Liang D, Li Y, Jiang T, Yang H. MicroRNA let‐7c inhibits Bcl‐xl expression and regulates ox‐LDL‐induced endothelial apoptosis. BMB Rep. 2012; 45:464-469 [DOI] [PubMed] [Google Scholar]
- 41.Iaconetti C, Polimeni A, Sorrentino S, Sabatino J, Pironti G, Esposito G, Curcio A, Indolfi C. Inhibition of miR‐92a increases endothelial proliferation and migration in vitro as well as reduces neointimal proliferation in vivo after vascular injury. Basic Res Cardiol. 2012; 107:296. [DOI] [PubMed] [Google Scholar]
- 42.Cai H, Harrison DG. Endothelial dysfunction in cardiovascular diseases: the role of oxidant stress. Circ Res. 2000; 87:840-844 [DOI] [PubMed] [Google Scholar]
- 43.Stocker R, Keaney JF., Jr Role of oxidative modifications in atherosclerosis. Physiol Rev. 2004; 84:1381-1478 [DOI] [PubMed] [Google Scholar]
- 44.Sugamura K, Keaney JF., Jr Reactive oxygen species in cardiovascular disease. Free Radic Biol Med. 2011; 51:978-992 [DOI] [PMC free article] [PubMed] [Google Scholar]
- 45.Tong X, Hou X, Jourd'heuil D, Weisbrod RM, Cohen RA. Upregulation of Nox4 by TGF‐β1 oxidizes SERCA and inhibits NO in arterial smooth muscle of the prediabetic Zucker rat. Circ Res. 2010; 107:975-983 [DOI] [PMC free article] [PubMed] [Google Scholar]
- 46.Brownlee M. Biochemistry and molecular cell biology of diabetic complications. Nature. 2001; 414:813-820 [DOI] [PubMed] [Google Scholar]
- 47.Giacco F, Brownlee M. Oxidative stress and diabetic complications. Circ Res. 2010; 107:1058-1070 [DOI] [PMC free article] [PubMed] [Google Scholar]
- 48.Du XL, Edelstein D, Dimmeler S, Ju Q, Sui C, Brownlee M. Hyperglycemia inhibits endothelial nitric oxide synthase activity by posttranslational modification at the Akt site. J Clin Invest. 2001; 108:1341-1348 [DOI] [PMC free article] [PubMed] [Google Scholar]
- 49.Hink U, Li H, Mollnau H, Oelze M, Matheis E, Hartmann M, Skatchkov M, Thaiss F, Stahl RA, Warnholtz A, Meinertz T, Griendling K, Harrison DG, Forstermann U, Munzel T. Mechanisms underlying endothelial dysfunction in diabetes mellitus. Circ Res. 2001; 88:E14-22 [DOI] [PubMed] [Google Scholar]
- 50.Adachi T, Weisbrod RM, Pimentel DR, Ying J, Sharov VS, Schoneich C, Cohen RA. S‐Glutathiolation by peroxynitrite activates SERCA during arterial relaxation by nitric oxide. Nat Med. 2004; 10:1200-1207 [DOI] [PubMed] [Google Scholar]
- 51.Adachi T. Modulation of vascular sarco/endoplasmic reticulum calcium ATPase in cardiovascular pathophysiology. Adv Pharmacol. 2010; 59:165-195 [DOI] [PubMed] [Google Scholar]
- 52.Lancel S, Qin F, Lennon SL, Zhang J, Tong X, Mazzini MJ, Kang YJ, Siwik DA, Cohen RA, Colucci WS. Oxidative posttranslational modifications mediate decreased SERCA activity and myocyte dysfunction in Galphaq‐overexpressing mice. Circ Res. 2010; 107:228-232 [DOI] [PMC free article] [PubMed] [Google Scholar]
- 53.Randriamboavonjy V, Pistrosch F, Bolck B, Schwinger RH, Dixit M, Badenhoop K, Cohen RA, Busse R, Fleming I. Platelet sarcoplasmic endoplasmic reticulum Ca2+‐ATPase and mu‐calpain activity are altered in type 2 diabetes mellitus and restored by rosiglitazone. Circulation. 2008; 117:52-60 [DOI] [PubMed] [Google Scholar]


