

Abstract
Background
HIV infection leads to activation of coagulation, which may increase the risk for atherosclerosis and venous thromboembolic disease. We hypothesized that HIV replication increases coagulation potentially through alterations in extrinsic pathway factors.
Methods and Results
Extrinsic pathway factors were measured among a subset of HIV participants from the Strategies for Management of Anti‐Retroviral Therapy (SMART) trial. Thrombin generation was estimated using validated computational modeling based on factor composition. We characterized the effect of antiretroviral therapy (ART) treatment versus the untreated state (HIV replication) via 3 separate analyses: (1) a cross‐sectional comparison of those on and off ART (n=717); (2) a randomized comparison of deferring versus starting ART (n=217); and (3) a randomized comparison of stopping versus continuing ART (n=500). Compared with viral suppression, HIV replication consistently showed short‐term increases in some procoagulants (eg, 15% to 23% higher FVIII; P<0.001) and decreases in key anticoagulants (eg, 5% to 9% lower antithrombin [AT] and 6% to 10% lower protein C; P<0.01). The net effect of HIV replication was to increase coagulation potential (eg, 24% to 48% greater thrombin generation from computational models; P<0.01 for all). The pattern of changes from HIV replication was reversed with ART treatment and consistent across all 3 independent comparisons.
Conclusions
HIV replication leads to complex changes in extrinsic pathway factors, with the net effect of increasing coagulation potential to a degree that may be clinically relevant. The key influence of changes in FVIII and AT suggests that HIV‐related coagulation abnormalities may involve changes in hepatocyte function in the context of systemic inflammation.
Clinical Trial Registration
URL: ClinicalTrials.gov. Unique identifier: NCT00027352.
Keywords: antiretroviral therapy, coagulation, HIV infection, HIV replication, inflammation, thrombin generation
Introduction
Morbidity and mortality among contemporary patients with HIV infection now more commonly involve non‐AIDS‐related causes of end‐organ disease such as atherosclerotic cardiovascular disease (CVD), rather than traditional AIDS‐defining events that are predominantly infectious.1 Inflammation, platelet activation, and alterations in coagulation biology may all contribute to excess CVD risk in this context.2–7 D‐dimer, a marker of ongoing coagulation, is elevated among individuals with HIV infection and has demonstrated robust associations with clinical risk for atherothrombotic cardiovascular events, venous thromboembolism, and all‐cause mortality in epidemiologic studies.4–6,8 The Strategies for Management of Anti‐Retroviral Therapy (SMART) study compared continuous use of antiretroviral therapy (ART) with intermittent use of ART (guided by CD4+ T‐cell count), and provides randomized trial data that untreated (versus ART‐treated) HIV infection increased risk for cardiovascular events and all‐cause mortality.9 These data demonstrate that HIV infection leads to persistently elevated systemic inflammation and an activated coagulation system, despite effective treatment with viral suppression, which has clinical consequences.5–6,10 However, mechanisms underlying the influence of HIV replication on coagulation biology remain poorly understood, with conflicting results reported in nonrandomized studies.11–12
Thrombin is a key enzyme in blood coagulation recognized for its multiple functions including fibrin generation, platelet aggregation, tissue repair, and other aspects of disease pathogenesis.13 The subprocesses leading to thrombin generation can be operationally described as the initiation, propagation, and termination phases.14 Exposure/expression of tissue factor (eg, on damaged vascular endothelium or monocytes) combines with factor (F) VIIa to initiate a cascade of procoagulant activation (eg, FX, FIX, and FV) generating thrombin, which facilitates cleavage of fibrinogen. Vigorous thrombin generation is then attenuated and terminated by stoichiometric and enzymatic inhibitors (antithrombin [AT], tissue factor pathway inhibitor [TFPI], and the protein C pathway). Recently, computational models that kinetically describe the tissue factor (extrinsic pathway)–initiated coagulation process have been used to define an individual's thrombin phenotype based on the composition of individual factors (FII, FV, FVII, FVIII, FIX, FX, AT, TFPI, protein C).15 The central idea is that an individual's procoagulant and anticoagulant factor levels act together in a unique coagulation phenotype, represented by their thrombin generation profile and potentially reflective of their disease risk. These methods are robust and have been used to describe altered thrombin generation in patients with acute and chronic coronary syndromes, cerebrovascular events, deep vein thrombosis, hemophilia, rheumatoid arthritis, and chronic obstructive pulmonary disease, as well as in healthy people.16–23
In this investigation we characterize the influence of HIV replication and ART treatment on coagulation factor composition and the potential implications for thrombin generation. Factor levels from the extrinsic pathway along with additional coagulation biomarkers were measured from plasma in a subset of SMART participants with untreated and ART‐treated HIV infection, both at baseline and following randomization to examine the effect of HIV replication (ie, starting and stopping ART). Computational modeling validated in studies of uninfected persons was applied to estimate the effect of HIV replication on thrombin generation kinetics.
Methods
Study Design
The methods and results of the SMART trial and the sample selection defined in these analyses have been reported.9–10,24 Briefly, patients either on or off ART with a CD4+ T‐cell count >350 cells/mm3 were randomized to 1 of 2 ART strategies: (1) the viral suppression (VS) strategy, aimed to suppress viral replication by continuous use of ART; or (2) the drug conservation (DC) strategy, consisting of intermittent use of ART, whereby participants would stop/defer ART until the CD4+ count declined to <250 cells/mm3 or symptoms developed. Any licensed ART could be used. Information was not available on participant blood type, frequency of FV Leiden polymorphism, or deficiencies in protein C, protein S, or AT levels. The SMART study, including plans to analyze stored specimens, was approved by the institutional review board or ethics committee at the University of Minnesota (for the Statistical and Data Management Center) and at each clinical site.
We defined 2 nonoverlapping subgroups of SMART participants based on ART use at study entry for which randomized comparisons of 13 biomarkers were made (Figure1B and 1C). In addition, we used baseline measurements for these 2 subgroups to carry out cross‐sectional comparisons for the 13 coagulation biomarkers (Figure 1A). The off‐ART subgroup (left side of Figure 1) included participants who either had never taken ART or had not used ART for ≥6 months prior to study entry. For these participants the randomized intervention in SMART was a comparison of immediate (VS group) versus deferred (until CD4 counts declined to 250 cells/mm3; DC group) initiation of ART (comparison B in Figure 1).24 Only a subset of these (n=217) had plasma specimens stored at 6 months—a point chosen to detect ART‐related biomarker changes and to minimize dilution from treatment cross‐over because of DC group participants starting ART.10 The subgroup on ART (right sight of Figure 1) included a random sample of 500 participants receiving ART with HIV viral load <400 copies/mL at study entry who had plasma specimens available at baseline and 2 months—when biomarker changes after stopping therapy are readily apparent.6 For this group on ART, the experimental intervention in SMART resulted in a randomized comparison of continuing (VS group) versus stopping (DC group) ART (comparison Cin Figure 1). In summary, with these subgroups we studied the effect of HIV replication on coagulation biomarkers with 3 separate comparisons.
Figure 1.

Study design and sample flow diagram. ART indicates antiretroviral therapy; VS, viral suppression; DC, drug conservation.
Plasma Coagulation Biomarkers
Plasma specimens were collected using EDTA (ethylenediaminetetraacetic acid) tubes and were shipped frozen to a central repository. Biomarker levels were measured at the Laboratory for Clinical Biochemistry Research at the University of Vermont. We have previously shown that there is a correlation with assays when performed in EDTA compared with citrated plasma (0.80 to 0.99).25–26 Factor (F) levels measured using ELISA (Enzyme Research Lab, South Bend, IN) included FII (prothrombin), FV, FVII/FVIIa, FVIII, FIX, FX, and tissue factor pathway inhibitor (TFPI; R&D Systems, Minneapolis, MN); analytical interassay coefficients of variation (CV) range for these measures were 6.4% to 11.1%, 9.6% to 10.8%, 6.7% to 12.2%, 3.8% to 5.2%, 7.4% to 7.8%, 5.8% to 8.0%, and 8.8% to 11.3%, respectively. Protein C and protein S levels (free and total) were measured using ELISA (Stago Diagnostics, Parsippany, NJ); corresponding CV ranges were 5.5% to 6.2%, 8.4% to 9.8%, and 6.4% and 7.9%, respectively). AT, von Willebrand factor (vWF), and fibrinogen levels were measured on a Stago STA‐R analyzer (Stago Diagnostics, Parsippany NJ); corresponding CV ranges were 2.6% to 10.2%, 3.9% to 6.8%, and 2.6% to 7.6%, respectively. Factors expressed as percentages represent the relative activity compared with standard laboratory controls. Samples were not required to be fasting specimens. All samples were analyzed blinded to use of ART at baseline and randomized treatment group.
Computational Modeling of Thrombin Kinetics
This model of the extrinsic coagulation system27 provides a method for investigating thrombin generation profiles and also includes thrombomodulin binding to thrombin and meizothrombin and activation of protein C (APC) by these complexes,28–29 AT inhibition of thrombin‐soluble thrombomodulin complexes; APC cleavage of FVa,30 and assembly and function of partially proteolyzed FVa species in prothrombinase.31–33 An overview of the coagulation factors and pathways reflected in the mathematical model is presented in Figure 2. Nine reactants are included: procoagulants FII, FV, FVII/FVIIa, FVIII, FIX, and FX and anticoagulants AT, TFPI, and protein C. Thrombomodulin was set at 1 nmol/L. Plasma composition on each was translated into molar (M) concentrations using literature values for the mean plasma concentrations.34 Simulations were initiated with a 5 pmol/L tissue factor stimulus and solved for active thrombin species present at 1‐second intervals over 20 minutes. Independent simulations were run on each individual >1300 times. Participants missing data for >2 of the plasma factor levels (n=45) were omitted from modeling analyses.
Figure 2.

Schematic of the extrinsic pathway of coagulation represented in a mathematical model. The 2 pathways to initiate coagulation are shown: the primary extrinsic pathway (on the right), and the contact, intrinsic pathway (on the left). These multicomponent processes are illustrated as enzymes (open circles), inhibitors (hatched circles), zymogens (open boxes), or complexes (open ovals). The contact pathway has no known bleeding etiology associated with it and thus is considered accessory to hemostasis. The shaded area represents what kinetic reactions are included in our mathematical model. On injury to the vessel wall, tissue factor, the cofactor for the extrinsic tenase complex, is exposed to circulating factor VIIa and forms the extrinsic tenase complex. Factor IX and factor X are converted to their serine proteases, factor IXa (FIXa) and factor Xa (FXa), which then form the intrinsic tenase and the prothrombinase complexes, respectively—the combined actions of which lead to an explosive burst of the enzyme thrombin (IIa). In addition to its multiple procoagulant roles, thrombin also acts in an anticoagulant capacity when combined with the cofactor thrombomodulin in the protein Case complex. The protein Case reaction generates activated protein C (APC), which inactivates the cofactors factors Va and VIIIa, which then no longer support the respective procoagulant activities of the prothrombinase and intrinsic tenase complexes. The procoagulant response is also downregulated by the stoichiometric inhibitors tissue factor pathway inhibitor (TFPI) and antithrombin (AT). AT directly inhibits thrombin, FIXa, and factor Xa. FPA indicates fibrinopeptide A; FPB, fibrinopeptide B; mz‐IIa, meizothrombin.
Active thrombin levels over time, or thrombin kinetics, were then analyzed, and the following parameters are estimated for each participant21–22: time to 2 nmol/L thrombin (equivalent to clotting time), maximum rate of thrombin generation (max rate), time to max rate, maximum level of thrombin generation (max level), time to max level, and total thrombin estimated via the area under the thrombin curve (AUC). The compositional influence from each coagulation factor on the mathematical model of thrombin generation was then determined by systematically running independent simulations for each participant, where ≥1 of the factor levels was set to values for the comparator group, whereas the other factor levels were the actual values for that individual. This approach was used to determine the minimum set of measured factor levels needed to approximate the thrombin generation curves for those on and off ART. We have previously reported the influence on the outputs from mathematical models due to any 1 protein among healthy individuals is <9%.21
Statistical Methods
Three separate comparisons were made (Figure 1): (A) a cross‐sectional comparison of baseline biomarker levels for those off ART compared with those on ART at entry, (B) biomarker changes after 6 months for those randomized to defer ART (DC group) versus to start ART (VS group), and (C) biomarker changes after 2 months for those randomized to stop ART (DC group) versus to continue ART (VS group). The latter 2 randomized comparisons were carried out using both an intention‐to‐treat analysis and an on‐treatment analysis excluding the few DC participants who did not remain off ART and VS participants who discontinued or did not initiate ART. Biomarker levels below assay detection limits were set to the lower level of detection. For the analytic comparisons, biomarkers were loge‐transformed.
For the baseline cross‐sectional comparison, differences between participants on and off ART were compared using multiple linear regression analysis. The cross‐sectional analyses included the following covariates in regression models: age, sex, race, hepatitis coinfection, diabetes, smoking, total/HDL cholesterol, blood‐pressure‐lowering medication, lipid‐lowering medication, body mass index, CD4+ T‐cell count, and prior CVD. Adjusted differences in loge‐transformed biomarker levels at entry between the groups taking ART and not taking ART are summarized as percentage differences (eg, 100×[exp{difference}−1]) with 95% confidence intervals (CIs). A positive percentage corresponds to higher levels off ART compared with on ART. Differences in other baseline covariates between groups were summarized using Student t test and chi‐square statistics. The randomized comparisons were carried out using analysis of covariance with baseline biomarker level as a covariate. Treatment differences between groups in biomarker levels at 2 and 6 months were estimated and then expressed as a percentage, with a positive percentage corresponding to higher follow‐up levels in the presence of viral replication (off ART compared with on ART group). Differences in thrombin generation parameters from computational models were compared using similar methods. Using the AUC for total thrombin generation from computational models as an outcome, we carried out step‐wise multiple linear regression analyses to identify which of the 9 factor levels considered were the strongest predictors of AUC.
Statistical analyses were performed using SAS (Version 9.2). To minimize the risk of identifying false‐positive associations, we focused on the randomized comparisons B and C (Figure 1) and emphasized randomized differences that were significant (2‐sided P<0.05) in both subgroups or which were significant in 1 subgroup (2‐sided P<0.0013) but not the other. The latter significance level corresponds to a Bonferroni‐adjusted P value (0.05/13).
Results
Study Sample Characteristics
Baseline characteristics are presented in Table 1. Those on ART who were older, had higher current CD4 counts and lower nadir CD4 counts, and were more likely to have had an AIDS‐defining event showed significant differences with participants on ART baseline. Participants on ART were also more likely to have diabetes and a history of CVD and to be taking blood pressure or lipid‐lowering medication. IL‐6 and D‐dimer levels were lower for those on versus off ART. Baseline characteristics were comparable for the randomized treatment groups (DC or VS; see Table SA available online).
Table 1.
Baseline Demographic and Clinical Characteristics
| Off ART at Baseline (n=217) | On ART at Baseline (n=500) | P Value for Difference* | |
|---|---|---|---|
| Demographics | |||
| Age, median (IQR) | 41 (36, 47) | 45 (39, 51) | <0.001 |
| Sex, % female | 25.3 | 24.4 | 0.79 |
| Race, % black | 42.9 | 40.4 | 0.54 |
| Clinical characteristics | |||
| Nadir CD4 count (cells/mm3), median (IQR) | 361 (300, 420) | 211 (100, 331) | <0.001 |
| CD4 count (cells/mm3), median (IQR) | 432 (391, 538) | 642 (487, 830) | <0.001 |
| HIV RNA (log10 copies/mL), median (IQR) | 4.6 (4.1, 4.9) | — | — |
| HIV RNA <10 000 copies/mL, (%) | 21.7 | — | — |
| HIV RNA 10 000 to <100 000 copies/mL, (%) | 59.4 | — | |
| HIV RNA ≥100 000 copies/mL, (%) | 18.9 | — | |
| Prior AIDS, % | 10.6 | 32.4 | <0.001 |
| ART naive, % | 53.9 | — | — |
| Coinfection with hepatitis B/C, % | 16.6 | 19.4 | 0.37 |
| Current smoker, % | 48.4 | 40.2 | 0.04 |
| Diabetes, % | 6.0 | 10.6 | 0.05 |
| Blood‐pressure‐lowering drugs, % | 17.1 | 26.2 | 0.008 |
| Lipid‐lowering drugs, % | 6.5 | 27.0 | <0.001 |
| Prior CVD, % | 4.1 | 7.4 | 0.10 |
| Body mass index (kg/m2), median (IQR) | 25.7 (23.1, 29.4) | 25.8 (23.1, 28.6) | 0.99 |
| Lipids, median (IQR) | |||
| Total cholesterol, mg/dL | 161 (141, 190) | 199 (169, 229) | <0.001 |
| Triglycerides, mg/dL | 137 (91, 201) | 190 (123, 310) | <0.001 |
| HDL cholesterol, mg/dL | 36 (30, 44) | 42 (35, 53) | <0.001 |
| LDL cholesterol, mg/dL | 97 (78, 118) | 112 (91, 139) | <0.001 |
| Total/HDL cholesterol | 4.5 (3.6, 5.7) | 4.6 (3.6, 5.9) | 0.67 |
| Plasma biomarkers, median (IQR) | |||
| IL‐6, pg/mL | 2.28 (1.48, 3.57) | 1.93 (1.19, 3.14) | 0.004 |
| D‐dimer, μg/mL | 0.38 (0.20, 0.69) | 0.20 (0.13, 0.36) | <0.001 |
ART indicates antiretroviral therapy; IQR, interquartile range; CD4 count, CD4+T‐cells; CVD, cardiovascular disease; HDL, high‐density lipoprotein; LDL, low‐density lipoprotein; IL‐6, interleukin‐6.
The 2 groups reported (off and on ART) correspond to comparison A in Figure 1.
Comparison of Coagulation Factor Levels Between Untreated and ART‐Treated HIV Infection
Among participants off ART at baseline, follow‐up median HIV viral load and CD4+ counts at 6 months were 43 800 copies/mL and 408 cells/mm3, respectively, after deferring ART (DC group) and 309 copies/mL and 563 cells/mm3, respectively, after starting ART (VS group); 62% of these VS participants had an HIV viral load <400 copies/mL at 6 months, and 7% of these DC participants started ART before month 6. Among the group on ART at baseline, follow‐up median HIV viral load and CD4+ counts at 2 months were 27 194 copies/mL and 451 cells/mm3, respectively, among those stopping ART (DC group) and 69 copies/mL and 640 cells/mm3, respectively, for those continuing ART (VS group); 90% of these VS participants had an HIV viral load <400 copies/mL at 2 months, and 14% of these DC participant started ART before month 2. Median biomarker levels for participants at baseline and follow‐up are presented in Table 2.
Table 2.
Median Coagulation Biomarker Levels Among Participants Off and On Antiretroviral Therapy
| Measure | Off ART at Study Entry (Comparison B) | On ART at Study Entry (Comparison C) | ||||
|---|---|---|---|---|---|---|
| Median (IQR) at Baseline | Median (IQR) Levels at Month 6 | Median (IQR) at Baseline | Median (IQR) Levels at Month 2 | |||
| Deferred ART (DC) | Started ART (VS) | Stopped ART (DC) | Continued ART (VS) | |||
| Sample size | n=217 | n=102 | n=115 | n=500 | n=250 | n=250 |
| Fibrinogen, mg/mL | 281 (253, 328) | 289 (257, 326) | 279 (250, 322) | 289 (252, 333) | 294 (260, 331) | 278 (243, 324) |
| vWF, % | 184 (145, 246) | 183 (145, 257) | 161 (121, 211) | 153 (114, 212) | 202 (151, 273) | 155 (109, 218) |
| Protein S, total (%) | 103 (87, 119) | 102 (89, 114) | 109 (93, 128) | 122 (103, 140) | 109 (90, 123) | 122 (104, 138) |
| Protein S, free (%) | 90 (75, 111) | 89 (72, 110) | 104 (80, 121) | 107 (89, 129) | 92 (76, 112) | 107 (91, 128) |
| Factors Used for Modeling Thrombin Kinetics | ||||||
| Sample size | n=217 | n=102 | n=115 | n=500 | n=250 | n=250 |
| Factor II, % | 99 (89, 109) | 99 (86, 110) | 105 (92, 117) | 111 (98, 127) | 96 (84, 112) | 110 (96, 124) |
| Factor V, % | 72 (61, 84) | 69 (62, 87) | 71 (59, 88) | 71 (58, 85) | 75 (62, 89) | 71 (60, 85) |
| Factor VII, % | 105 (83, 125) | 105 (91, 126) | 117 (96, 140) | 126 (104, 151) | 110 (92, 127) | 121 (102, 146) |
| Factor VIII, % | 111 (91, 131) | 114 (97, 138) | 94 (75, 115) | 101 (78, 131) | 123 (98, 155) | 100 (78, 124) |
| Factor IX, % | 97 (82, 111) | 99 (87, 111) | 94 (86, 109) | 98 (83, 114) | 93 (80, 109) | 94 (80, 113) |
| Factor X, % | 102 (90, 117) | 103 (92, 116) | 108 (94, 121) | 114 (100, 129) | 101 (87, 114) | 111 (98, 126) |
| TFPI, ng/mL | 29 (24, 35) | 30 (24, 39) | 29 (25, 36) | 28 (23, 35) | 29 (24, 34) | 28 (22, 34) |
| Antithrombin, % | 121 (107, 128) | 121 (110, 130) | 127 (120, 135) | 127 (115, 138) | 115 (101, 125) | 124 (114, 135) |
| Protein C, % | 100 (85, 113) | 95 (84, 110) | 107 (93, 120) | 108 (95, 123) | 98 (86, 112) | 111 (95, 126) |
| Thrombin Parameters From Computational Modeling | ||||||
| Sample size | n=197 | n=95 | n=102 | n=475 | n=232 | n=243 |
| Total thrombin, AUC (nmol/L×s) | 16 503 (10 207, 25 848) | 15 776 (11 057, 23 142) | 12 445 (6302, 19 384) | 13 141 (7657, 21 208) | 21 249 (13 119, 32 729) | 12 469 (7488, 20 882) |
| Max level, nmol/L | 53.9 (32.2, 82.2) | 50.4 (33.2, 74.2) | 40.4 (18.9, 61.9) | 42.7 (23.0, 67.6) | 67.5 (42.0, 99.3) | 40.1 (22.1, 67.2) |
| Max rate, nmol/L/s | 0.29 (0.15, 0.45) | 0.27 (0.15, 0.41) | 0.20 (0.08, 0.33) | 0.22 (0.09, 0.36) | 0.36 (0.20, 0.57) | 0.20 (0.09, 0.38) |
| Time to max level, s | 549 (515, 597) | 564 (524, 630) | 562 (517, 599) | 544 (509, 587) | 536 (510, 579) | 536 (503, 579) |
| Time to max rate, s | 452 (404, 499) | 467 (428, 534) | 455 (404, 493) | 441 (400, 488) | 436 (407, 477) | 434 (394, 472) |
| Time to 2 nmol/L, s | 130 (117, 145) | 138 (119, 160) | 130 (111, 149) | 119 (107, 138) | 125 (111, 141) | 119 (108, 138) |
ART indicates antiretroviral therapy; IQR, interquartile range; DC, drug conservation; VS, viral suppression; vWF, von Willebrand factor; TFPI, tissue factor pathway inhibitor; AUC, area under the curve.
The relative differences of each coagulation biomarker between untreated and ART‐treated participants are presented in Figure 3. Results are presented for all 3 comparisons of untreated versus ART‐treated HIV infection (that is comparisons A, B, and C, outlined in Figure 1). When compared with ART‐treated participants, those with untreated HIV infection had higher levels of factors reflecting inflammation (eg, FVIII and vWF), whereas factors predominantly synthesized in hepatocytes (eg, FII, FVII, FIX, FX, AT, protein C, and protein S) tended to be lower. This pattern was consistent in all 3 comparisons (Figure 3a through 3c). Notably, HIV replication did not result in significant differences in fibrinogen, an inflammatory marker synthesized in the liver, despite elevations in systemic inflammation as estimated by interleukin‐6 and CRP levels in previously published data from SMART.6 Sensitivity analyses excluding participants coinfected with hepatitis B or hepatitis C (HCV) and “on‐treatment” comparisons excluding those who crossed over the randomized treatment allocation demonstrated similar results for differences between groups defined by ART use (data not shown).
Figure 3.
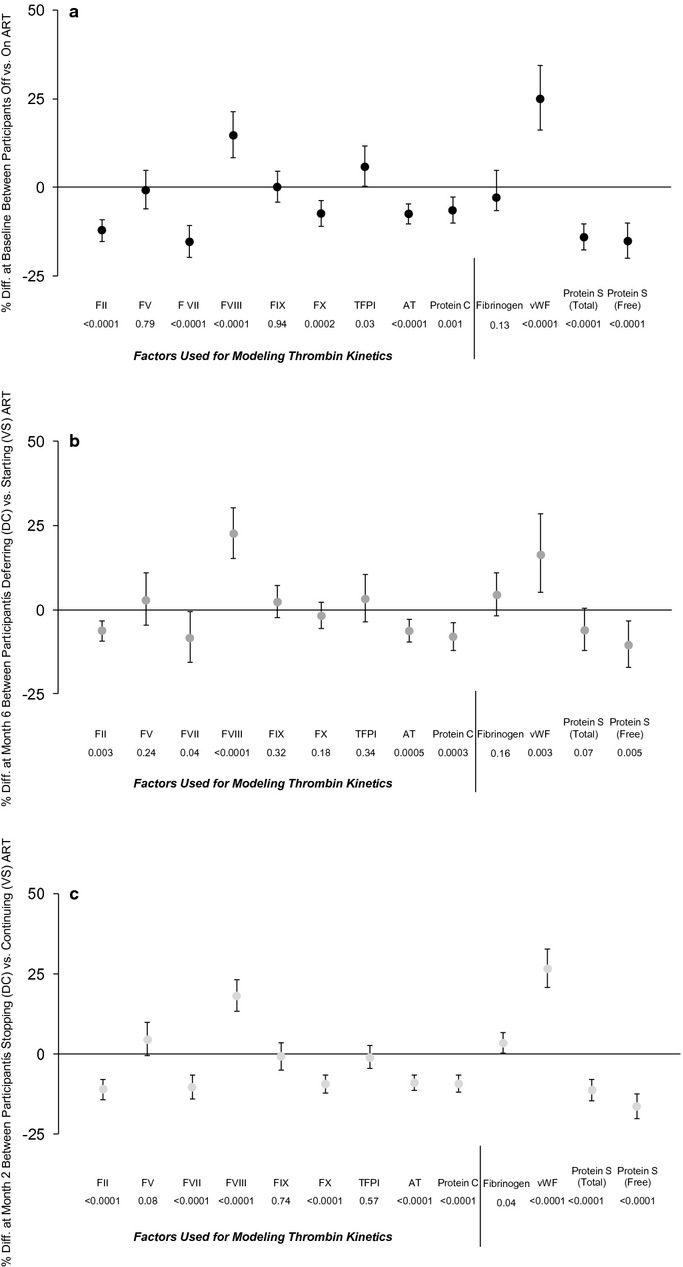
Comparisons of coagulation biomarkers between untreated and ART‐treated HIV infection in the SMART study. a, Baseline comparison (A) between participants off ART and on ART with suppressed HIV viral load. b, Randomized comparison (B) of deferring (DC group) versus starting (VS group) ART at 6 months among participants off ART at baseline. c, Randomized comparison (C) of stopping (DC group) versus continuing (VS group) ART at 2 months among participants on ART at baseline with suppressed HIV viral load. Plots include the relative differences in coagulation factor levels for the untreated versus ART‐treated states for the following comparisons: (A) at baseline between participants off vs on ART; (B) at 6 months for those off ART at baseline who were then randomized to deferred ART (untreated) vs start ART (ART treated); (C) at 2 months for those on ART at baseline who were then randomized to stop ART (untreated) vs continue ART (ART treated). Differences at baseline are presented from fully adjusted models, whereas differences from randomized comparisons are adjusted only for baseline level. Treatment differences are expressed as a percentage, error bars represent the 95% CI, and a positive percentage corresponds to a higher level in the untreated state. Factors used for modeling thrombin kinetics are delineated. Results consistently showed that HIV replication leads to increases in coagulation factors associated with inflammation (eg, FVIII, vWF), and decreases in coagulation factors predominantly synthesized in the liver (eg, FII, FVII, AT, protein C, and protein S), with no consistent effect on fibrinogen (which reflects inflammation but is synthesized by hepatocytes). To minimize the risk of false‐positive associations, we focused on the randomized comparisons B and C and emphasized differences that are significant in both. If a significance level corresponding to a Bonferroni adjusted Pvalue was used (0.05/13=0.0013), the following comparisons did not meet this threshold: TFPI in 3a, FVII in 3b, and fibrinogen in 3c. ART indicates antiretroviral therapy; SMART, Strategies for Management of Anti‐Retroviral Therapy; DC, drug conservation; VS, viral suppression; CI, confidence interval; vWF, von Willebrand factor; AT, antithrombin; TFPI, tissue factor pathway inhibitor.
The finding that untreated HIV viral replication is associated with elevations in factors reflecting inflammation and declines in factors synthesized by hepatocytes was also supported when correlating changes in coagulation factors with changes in HIV viral load or IL‐6 over follow‐up (see Table SB for correlations with HIV RNA and Table SC for correlations with IL‐6). This pattern, taken with our prior work describing D‐dimer associations with HIV viral load,6,10 suggests that HIV replication may be procoagulant via mechanisms involving the effects of inflammation as well as paradoxical declines in anticoagulant factors. This led us to investigate the effects of HIV replication on thrombin generation using novel computational modeling that incorporates the net contribution of extrinsic (tissue factor) pathway coagulation factors.
Estimates of Thrombin Generation Kinetics From Computational Modeling
Using the plasma coagulation factor composition for each participant both at baseline and follow‐up times (Figure 1), simulated thrombin generation profiles were modeled from an initial 5 pmol/L tissue factor stimulus. From this modeling, thrombin generation kinetics were estimated (see Methods and Results and bottom panel of Table 2). Plots of the mean (SEM) thrombin generation curves for the 3 comparison groups of untreated versus ART‐treated HIV infection are shown in Figure 4A through 4C).
Figure 4.

Computational modeling of thrombin kinetics among participants with untreated and ART‐treated HIV infection. Plots for computational modeling output of thrombin generation kinetics over time after a 5 pmol/L tissue factor stimulus are presented for: A, the baseline comparison between participants untreated (n=197) vs ART treated (n=475); B, the comparison at 6 months for those off ART at baseline who were then randomized to deferred ART (untreated; n=95) vs start ART (ART treated; n=102); C, the comparison at 2 months for those on ART at baseline who were then randomized to stop (untreated; n=232) vs continue (ART treated; n=243). The curves consistently demonstrate greater thrombin generation for untreated compared with ART‐treated participants. D, Levels for FVIII and AT from ART‐treated participants were substituted into the model in which remaining factors were from untreated participants at baseline. This demonstrates that differences in FVIII and AT account for a large degree of the differences in thrombin generation based on ART use. ART indicates antiretroviral therapy; AT, antithrombin; DC, drug conservation; VS, viral suppression.
The effect of untreated HIV viral replication, compared with the ART‐treated state, on differences in estimated thrombin generation was consistent across all 3 comparisons and was characterized by greater total thrombin generation (AUC), max level of thrombin, and max rate of thrombin generation (see Table 2 for parameter values and Figure 4 for plots). Specifically, at baseline, participants with untreated infection had 30% (95% CI, 15% to 45%) higher total thrombin (AUC), a 30% (95% CI, 15% to 44%) higher max level, and a 36% (95% CI, 19% to 53%) higher max rate compared with ART‐treated participants (P<0.001 for all; Figure 4A). When thrombin generation was evaluated 6 months after deferring versus starting ART, the corresponding differences for those off versus on ART were 24% (−1% to 48%), 25% (0% to 50%), and 29% (−2% to 60%), respectively (P<0.01 for all; Figure 4B). Finally, corresponding differences 2 months after stopping versus continuing ART were somewhat larger: 48% (29% to 67%), 48% (30% to 65%), and 54% (33% to 75%), respectively (P<0.001 for all; Figure 4C).
Individual Factors Accounting for Differences in Thrombin Generation
We next studied which individual coagulation factor levels accounted for the treatment‐related differences in total thrombin generation (AUC from Figure 4). In univariate models, as well as multivariate models with all 9‐factor levels, each individual factor level was significantly associated with total thrombin generation (AUC; see Table SD for correlations). We then applied step‐wise multiple linear regression analyses to identify which of the 9 factor levels considered contributed the most to estimates of thrombin generation (AUC). After starting ART (comparison B), the strongest predictors were FVIII and AT, which together explained 33% of the variance in the 6‐month change in total thrombin generation. Similarly, after stopping ART (comparison C), changes in FVIII and AT were also the strongest predictors, explaining 39% of the variance in the 2‐month change in total thrombin generation.
These results from step‐wise multiple linear regression suggest the procoagulant FVIII and the anticoagulant factor AT disproportionally accounted for the effect of HIV replication on thrombin generation. We then tested this by determining whether the compositional contribution of FVIII and AT concentrations dictated the effect of HIV viral replication on thrombin generation kinetics as determined by computational modeling (Figure 4D). Here, we resimulated the baseline comparison shown in Figure 4A, but for the untreated group we now substituted the levels of these factors from the ART‐treated group in the baseline model (see Table 2 for median values). By changing only the concentrations of FVIII and AT for the untreated participants (and using values from the ART‐treated participants) but keeping the other factors as their actual individual values, the resulting thrombin profile for the untreated individuals closely approximates the curve for ART‐treated individuals (Figure 4D). This verifies that FVIII and AT largely accounted for the influence of HIV replication on thrombin generation.
Discussion
In the most comprehensive HIV study of coagulation factors to date, we have characterized the influence of HIV replication on pro‐ and anticoagulation factors within the extrinsic (tissue factor) pathway. Using 3 separate and complementary analyses (including a cross‐sectional comparison and 2 randomized comparisons), we showed consistently that untreated HIV replication led to short‐term increases in some procoagulants (eg, FVIII) as well as decreases in key anticoagulants (eg, lower AT and protein C). Our hypothesis a priori was that HIV replication increased coagulation activity, in part, via upregulation of procoagulants as a consequence of systemic inflammation. Our findings were partially consistent with this hypothesis, but the declines in all the major anticoagulation factors and many other procoagulants were unexpected. We then applied mathematical modeling to estimate thrombin generation based on the composition of extrinsic pathway factors and demonstrated the net effect of HIV replication was increased coagulation potential. Notably, the magnitude of these changes were similar to those seen in the context of acute coronary syndrome,16 and they were consistent and reproducible across the 3 independent comparisons. The key influence of changes in FVIII and AT on estimates of thrombin generation and the consistent pattern of these changes suggest that HIV‐related coagulation abnormalities may be associated with changes in hepatocyte function in the context of systemic inflammation.
Blood thrombosis is primarily initiated and perpetuated by local activation of tissue factor (eg, the extrinsic pathway). There is growing evidence that HIV replication may upregulate the tissue factor pathway via innate immune activation. Funderberg et al12 found that monocyte expression of tissue factor was increased with HIV infection and correlated directly with HIV viral load. In that study, monocyte tissue factor expression also correlated with D‐dimer levels and with soluble CD14 (sCD14), an inflammatory marker that reflects monocyte activation.12 HIV pathogenesis studies postulate that increased translocation of microbial products across intestinal surfaces, a consequence of permanent damage to the mucosal lymphatic tissue, may contribute to monocyte activation, tissue factor expression, and pathogenic hypercoagulation.35–37 Increased platelet activation may also be an important contributor to hypercoagulation among HIV‐positive patients, although the pathogenesis of HIV‐related alterations in platelet function remains largely unknown.14,38 Our findings supporting an entirely different process: that HIV replication has a net procoagulant effect, in part, via its effects on hepatocyte function. Therefore, HIV infection may result in both (1) upregulation of tissue factor activity through innate immune activation and (2) prothrombotic alterations in the circulating plasma factor levels that regulate the response to tissue factor activity.
We determined that untreated HIV replication led to declines (or lack of increases) in coagulation factors dependent on hepatocyte function (that is, fibrinogen, FII, FVII, FIX, FX, AT, and protein C and S). This novel observation provides a biologic explanation for several previous unexplained findings. First, although both CRP and fibrinogen, inflammatory biomarkers synthesized by hepatocytes, predict mortality risk among HIV‐positive patients,39 we have described that mortality risk prediction is considerably stronger with a nonhepatocyte inflammatory biomarker such as IL‐6.6 Second, among participants with HIV/HCV coinfection, CRP levels were modestly higher among HIV mono‐infected individuals and actually lower among those with HIV/HCV coinfection, when compared with uninfected controls.40 Third, although IL‐6 and D‐dimer levels decline with initiation of ART, CRP levels failed to improve or actually increase in some studies.41–42 We now propose that the effects of HIV replication on liver protein production, with a compensatory return to health with ART treatment, may help to explain these observations.
Our results are consistent with an emerging hypothesis, championed by Tripodi and Mannucci, that declining liver function results in a procoagulant state until end‐stage disease, with the almost complete lack of coagulation factors resulting in hemorrhage.43 Although previous studies have reported protein C and S deficiencies with HIV infection,44–46 we believe our data are the first to extend the hypothesis of a hepatocyte‐related procoagulat state to HIV disease pathogenesis. Declines in coagulation factors can also be seen with increased consumption in states of substantially elevated coagulation and fibrinolysis, although the relatively modest changes we describe with HIV replication, all within the normal physiologic range, are not consistent with this explanation.5,47
There also exists biologic plausibility for HIV replication to influence hepatic synthetic function, whether a direct effect or simply a consequence of systemic cytokine production. HIV‐1 may have the capacity to replicate in hepatocytes,48–50 and the FIB‐4 index, a noninvasive estimate of hepatic fibrosis, correlated with the degree of HIV replication.51–52 It is also well established that fibrosis lymphatic tissue is a distinct feature of HIV pathogenesis,53 and liver fibrosis is known to occur in the context of other chronic viral infections (eg, hepatitis B or C). The clinical consequences of occult liver dysfunction and the interaction between HIV and alcohol use or coinfection with other hepatitis viruses,require careful consideration in future studies.
A broader and important unanswered question is whether HIV‐related alterations in coagulation biology have direct implications for disease pathogenesis and triggering clinical events. The magnitude of increased thrombin generation we describe with HIV replication is of a degree similar to that seen with acute coronary syndrome, when compared with patients with stable CAD.16 However, D‐dimer levels among individuals with HIV infection may also reflect the convergence of multiple pathways and overall disease burden. For example, the profile of HIV‐related changes to inflammatory and coagulation factors are similar to changes seen with aging and frailty in the general population (eg, IL‐6, D‐dimer, vWF, FVIII, and FVII).5–6,54 The concept of HIV infection as a state phenotypically similar to premature aging is also supported by descriptions of persistent immunologic abnormalities (consistent with “immunosenescence”).55 Ultimately, the parallels between HIV infection and normal aging with respect to abnormalities in inflammation and coagulation biology highlight the potential for non‐AIDS‐defining clinical event risk to increase substantially as individuals with HIV infection live to older ages.
Our study has several limitations. Importantly, in SMART stored plasma was collected as EDTA specimens, which precluded reliable measurement of thrombin activation or other coagulation parameters (eg, endogenous thrombin potential) or cellular immunophenotypes. We did not account for gene mutations related to coagulation (eg, factor V Leiden), although we do not believe that this likely influenced our findings, as these mutations are rare and would be equally distributed between treatment groups in our randomized comparisons. The lack of an HIV‐negative control population also precludes further description of residual abnormalities in coagulation biology after HIV replication is suppressed with ART, although prior studies would suggest differences persist.5 We are also unable to prove that the effects we describe with HIV viral replication would not also be present with other viral infections. Finally, as the focus of this study was to evaluate the effect of HIV replication (eg, untreated versus ART‐treated HIV infection), the clinical consequences of these changes will require follow‐up studies.
In summary, HIV replication is associated with alterations in the composition of extrinsic pathway coagulation factors. Although most changes among individual factors remain in the normal physiologic range, the net effect of these changes is a hypercoagulable state that may be clinically relevant based on comparable comparisons in uninfected populations.16 HIV treatment with ART improves coagulation homeostasis not only by reducing inflammation (and factors such as FVIII), but also via improved hepatocyte production of anticoagulants (ATIII in particular). Future research should focus on understanding the pathogenesis of HIV‐related hepatic dysfunction and whether adjunct treatments given in addition to ART have clinical benefits through reducing coagulation activation.
Sources of Funding
Funding provided by NIH grants 5K12 RR023247, NIH HL46703 (Project 5), 5UO1AIO68641, U01‐A1046362, and U01‐A1042170. The study was funded in part by the National Institute of Allergy and Infectious Disease (NIAID) and the National Heart, Lung, and Blood Institute (NHLBI). The funding sources had no role in data collection, data analysis, or decisions to publish the results.
Disclosures
Dr Baker reports research support from the US National Institutes of Health, the US Center for Disease Control and Prevention, the American Heart Association, Gilead Sciences, Tibotec, and GSK/ViiV Healthcare. Dr Duprez reports research support from the US National Institutes of Health, Roche, and Novartis. Dr Dalmau reports honoraria or grant support from BMS, Abbott, Merck, GlaxoSmithKline, Boehringer, and Gilead Sciences. Dr DeHovitz reports research support and grants from the US National Institutes of Health, the Substance Abuse and Mental Health Services Administration, and the US Public Health Service. Dr Sullivan reports research support and grants from the UK Department of Health, Gilead Sciences, and Chiron. Dr Woolley reports research support from Gilead Sciences and MSD, consulting fees from BMS and Gilead Sciences, and payments for lectures from Abbott. Dr Tracy reports receiving honoraria or grant support from Aviir, Abbott, Merck, GlaxoSmithKline/diaDexus, and Celera Diagnostics; being on the external advisory board for the Wake Forest University Pepper Center on Aging, the Johns Hopkins University Pepper Center on Aging, and the University of Florida Pepper Center on Aging; being an owner of Haematologic Technologies; having contract research in the area of thrombosis and fibrinolysis biochemical reagents and blood collection tubes; and consulting on mechanisms in inflammation, atherosclerosis and thrombosis for Ashcraft & Gerel Attorneys at Law. Dr Lehman receives support from the German Federal Ministry of Research and Education. The remaining authors list no disclosures.
Acknowledgments
We sincerely thank the participants who participated in SMART, the SMART study team (see N Engl J Med 2006:355:2294–2295 for list of investigators), and the INSIGHT Executive Committee.
References
- 1.Mocroft A, Reiss P, Gasiorowski J, Ledergerber B, Kowalska J, Chiesi A, Gatell J, Rakhmanova A, Johnson M, Kirk O, Lundgren J. Serious fatal and nonfatal non‐AIDS‐defining illnesses in Europe. J Acquir Immune Defic Syndr. 2010; 55:262-270 [DOI] [PubMed] [Google Scholar]
- 2.Ruggeri ZM. Platelets in atherothrombosis. Nat Med. 2002; 8:1227-1234 [DOI] [PubMed] [Google Scholar]
- 3.Taubes G. Does inflammation cut to the heart of the matter. Science. 2002; 296:242-245 [DOI] [PubMed] [Google Scholar]
- 4.Duprez DA, Neuhaus J, Kuller LH, Tracy R, Belloso W, De Wit S, Drummond F, Lane HC, Ledergerber B, Lundgren J, Nixon D, Paton NI, Prineas RJ. Inflammation, coagulation and cardiovascular disease in HIV‐infected individuals. PLoS One. 2012; 7:e44454. [DOI] [PMC free article] [PubMed] [Google Scholar]
- 5.Neuhaus J, Jacobs DR, Jr, Baker JV, Calmy A, Duprez D, La Rosa A, Kuller LH, Pett SL, Ristola M, Ross MJ, Shlipak MG, Tracy R, Neaton JD. Markers of inflammation, coagulation, and renal function are elevated in adults with HIV infection. J Infect Dis. 2010; 201:1788-1795 [DOI] [PMC free article] [PubMed] [Google Scholar]
- 6.Kuller LH, Tracy R, Belloso W, De Wit S, Drummond F, Lane HC, Ledergerber B, Lundgren J, Neuhaus J, Nixon D, Paton NI, Neaton JD. Inflammatory and coagulation biomarkers and mortality in patients with HIV infection. PLoS Med. 2008; 5:e203. [DOI] [PMC free article] [PubMed] [Google Scholar]
- 7.Triant VA, Meigs JB, Grinspoon SK. Association of C‐reactive protein and HIV infection with acute myocardial infarction. J Acquir Immune Defic Syndr. 2009; 51:268-273 [DOI] [PMC free article] [PubMed] [Google Scholar]
- 8.Musselwhite LW, Sheikh V, Norton TD, Rupert A, Porter BO, Penzak SR, Skinner J, Mican JM, Hadigan C, Sereti I. Markers of endothelial dysfunction, coagulation and tissue fibrosis independently predict venous thromboembolism in HIV. AIDS. 2011; 25:787-795 [DOI] [PMC free article] [PubMed] [Google Scholar]
- 9.El‐Sadr WM, Lundgren JD, Neaton JD, Gordin F, Abrams D, Arduino RC, Babiker A, Burman W, Clumeck N, Cohen CJ, Cohn D, Cooper D, Darbyshire J, Emery S, Fatkenheuer G, Gazzard B, Grund B, Hoy J, Klingman K, Losso M, Markowitz N, Neuhaus J, Phillips A, Rappoport C. CD4+ count‐guided interruption of antiretroviral treatment. N Engl J Med. 2006; 355:2283-2296 [DOI] [PubMed] [Google Scholar]
- 10.Baker JV, Neuhaus J, Duprez D, Kuller LH, Tracy R, Belloso W, De Wit S, Drummond F, Lane HC, Ledergerber B, Lundgren J, Nixon D, Paton NI, Neaton JD. Changes in inflammatory and coagulation biomarkers: a randomized comparison of immediate versus deferred antiretroviral therapy in patients with HIV infection. J Acquir Immune Defic Syndr. 2011; 56:36-43 [DOI] [PMC free article] [PubMed] [Google Scholar]
- 11.Hsue PY, Scherzer R, Grunfeld C, Nordstrom SM, Schnell A, Kohl LP, Nitta E, Martin JN, Deeks SG, Weiss EJ. HIV infection is associated with decreased thrombin generation. Clin Infect Dis. 2012; 54:1196-1203 [DOI] [PMC free article] [PubMed] [Google Scholar]
- 12.Funderburg NT, Mayne E, Sieg SF, Asaad R, Jiang W, Kalinowska M, Luciano AA, Stevens W, Rodriguez B, Brenchley JM, Douek DC, Lederman MM. Increased tissue factor expression on circulating monocytes in chronic HIV infection: relationship to in vivo coagulation and immune activation. Blood. 2010; 115:161-167 [DOI] [PMC free article] [PubMed] [Google Scholar]
- 13.Cunha‐Bang C, Kirkby N, Sonderholm M, Sorensen SS, Sengelov H, Iversen M, Rasmussen A, Gustafsson F, Frederiksen CM, Kjaer J, Lepri AC, Lundgren JD. The time course of development and impact from viral resistance against ganciclovir in cytomegalovirus infection. Am J Transplant. 2013; 13:458-466 [DOI] [PubMed] [Google Scholar]
- 14.Zetterberg E, Neuhaus J, Baker JV, Somboonwit C, Llibre JM, Palfreeman A, Chini M, Lundgren JD. Platelet count kinetics following interruption of antiretroviral treatment. AIDS. 2013; 27:59-68 [DOI] [PMC free article] [PubMed] [Google Scholar]
- 15.Lange CG, Lederman MM, Medvik K, Asaad R, Wild M, Kalayjian R, Valdez H. Nadir CD4+ T‐cell count and numbers of CD28+ CD4+ T‐cells predict functional responses to immunizations in chronic HIV‐1 infection. AIDS. 2003; 17:2015-2023 [DOI] [PubMed] [Google Scholar]
- 16.Brummel‐Ziedins K, Undas A, Orfeo T, Gissel M, Butenas S, Zmudka K, Mann KG. Thrombin generation in acute coronary syndrome and stable coronary artery disease: dependence on plasma factor composition. J Thromb Haemost. 2008; 6:104-110 [DOI] [PubMed] [Google Scholar]
- 17.Maingat FG, Polyak MJ, Paul AM, Vivithanaporn P, Noorbakhsh F, Ahboucha S, Baker GB, Pearson K, Power C. Neurosteroid‐mediated regulation of brain innate immunity in HIV/AIDS: DHEA‐S suppresses neurovirulence. FASEB J. 2013; 27:725-737 [DOI] [PubMed] [Google Scholar]
- 18.Undas A, Jankowski M, Kaczmarek P, Sladek K, Brummel‐Ziedins K. Thrombin generation in chronic obstructive pulmonary disease: dependence on plasma factor composition. Thromb Res. 2011; 128:e24-e28 [DOI] [PMC free article] [PubMed] [Google Scholar]
- 19.Lange CG, Valdez H, Medvik K, Asaad R, Lederman MM. CD4+ T‐lymphocyte nadir and the effect of highly active antiretroviral therapy on phenotypic and functional immune restoration in HIV‐1 infection. Clin Immunol. 2002; 102:154-161 [DOI] [PubMed] [Google Scholar]
- 20.Brummel‐Ziedins KE, Whelihan MF, Gissel M, Mann KG, Rivard GE. Thrombin generation and bleeding in haemophilia A. Haemophilia. 2009; 15:1118-1125 [DOI] [PMC free article] [PubMed] [Google Scholar]
- 21.Brummel‐Ziedins K, Vossen CY, Rosendaal FR, Umezaki K, Mann KG. The plasma hemostatic proteome: thrombin generation in healthy individuals. J Thromb Haemost. 2005; 3:1472-1481 [DOI] [PMC free article] [PubMed] [Google Scholar]
- 22.Brummel‐Ziedins KE, Vossen CY, Butenas S, Mann KG, Rosendaal FR. Thrombin generation profiles in deep venous thrombosis. J Thromb Haemost. 2005; 3:2497-2505 [DOI] [PMC free article] [PubMed] [Google Scholar]
- 23.Brummel‐Ziedins K, Orfeo T, Callas PW, Gissel M, Mann KG, Bovill EG. The prothrombotic phenotypes in familial protein C deficiency are differentiated by computational modeling of thrombin generation. PLoS One. 2012; 79:e44378. [DOI] [PMC free article] [PubMed] [Google Scholar]
- 24.Emery S, Neuhaus J, Phillips A, Babiker A, Cohen CJ, Gatell JM, Pierre‐Marie G, Grund B, Law M, Losso MH, Palfreeman A, Wood R. Major clinical outcomes in antiretroviral therapy (ART)‐naive participants and in those not receiving ART at baseline in the SMART study. J Infect Dis. 2008; 197:1133-1144 [DOI] [PubMed] [Google Scholar]
- 25.Tsai AW, Cushman M, Rosamond WD, Heckbert SR, Tracy RP, Aleksic N, Folsom AR. Coagulation factors, inflammation markers, and venous thromboembolism: the longitudinal investigation of thromboembolism etiology (LITE). Am J Med. 2002; 113:636-642 [DOI] [PubMed] [Google Scholar]
- 26.Lutsey PL, Folsom AR, Heckbert SR, Cushman M. Peak thrombin generation and subsequent venous thromboembolism: the longitudinal investigation of thromboembolism etiology (LITE) study. J Thromb Haemost. 2009; 7:1639-1648 [DOI] [PMC free article] [PubMed] [Google Scholar]
- 27.Hockin MF, Jones KC, Everse SJ, Mann KG. A model for the stoichiometric regulation of blood coagulation. J Biol Chem. 2002; 277:18322-18333 [DOI] [PubMed] [Google Scholar]
- 28.Doyle MF, Mann KG. Multiple active forms of thrombin. IV. Relative activities of meizothrombins. J Biol Chem. 1990; 265:10693-10701 [PubMed] [Google Scholar]
- 29.Cote HC, Bajzar L, Stevens WK, Samis JA, Morser J, MacGillivray RT, Nesheim ME. Functional characterization of recombinant human meizothrombin and meizothrombin(desF1). Thrombomodulin‐dependent activation of protein C and thrombin‐activatable fibrinolysis inhibitor (TAFI), platelet aggregation, antithrombin‐III inhibition. J Biol Chem. 1997; 272:6194-6200 [DOI] [PubMed] [Google Scholar]
- 30.Hockin MF, Cawthern KM, Kalafatis M, Mann KG. A model describing the inactivation of factor Va by APC: bond cleavage, fragment dissociation, and product inhibition. Biochemistry. 1999; 38:6918-6934 [DOI] [PubMed] [Google Scholar]
- 31.Egan JO, Kalafatis M, Mann KG. The effect of Arg306–>Ala and Arg506–>Gln substitutions in the inactivation of recombinant human factor Va by activated protein C and protein S. Protein Sci. 1997; 6:2016-2027 [DOI] [PMC free article] [PubMed] [Google Scholar]
- 32.Kalafatis M, Mann KG. Role of the membrane in the inactivation of factor Va by activated protein C. J Biol Chem. 1993; 268:27246-27257 [PubMed] [Google Scholar]
- 33.Nicolaes GA, Tans G, Thomassen MC, Hemker HC, Pabinger I, Varadi K, Schwarz HP, Rosing J. Peptide bond cleavages and loss of functional activity during inactivation of factor Va and factor VaR506Q by activated protein C. J Biol Chem. 1995; 270:21158-21166 [DOI] [PubMed] [Google Scholar]
- 34.Brummel‐Ziedins K, Orfeo T, Swords NJ, Everse SJ, Mann KG. In: Greer JP, Foerster J, Rodgers GM. (eds.). Blood coagulation and fibrinolysis. Wintrobe's Clinical Hematology. 2009Philadelphia, PA: Lippincott Williams & Wilkins; 528-619 [Google Scholar]
- 35.Brenchley JM, Price DA, Schacker TW, Asher TE, Silvestri G, Rao S, Kazzaz Z, Bornstein E, Lambotte O, Altmann D, Blazar BR, Rodriguez B, Teixeira‐Johnson L, Landay A, Martin JN, Hecht FM, Picker LJ, Lederman MM, Deeks SG, Douek DC. Microbial translocation is a cause of systemic immune activation in chronic HIV infection. Nat Med. 2006; 12:1365-1371 [DOI] [PubMed] [Google Scholar]
- 36.Brenchley JM, Schacker TW, Ruff LE, Price DA, Taylor JH, Beilman GJ, Nguyen PL, Khoruts A, Larson M, Haase AT, Douek DC. CD4+ T cell depletion during all stages of HIV disease occurs predominantly in the gastrointestinal tract. J Exp Med. 2004; 200:749-759 [DOI] [PMC free article] [PubMed] [Google Scholar]
- 37.Pandrea I, Parrish NF, Raehtz K, Gaufin T, Barbian HJ, Ma D, Kristoff J, Gautam R, Zhong F, Haret‐Richter GS, Trichel A, Shaw GM, Hahn BH, Apetrei C. Mucosal simian immunodeficiency virus transmission in African green monkeys: susceptibility to infection is proportional to target cell availability at mucosal sites. J Virol. 2012; 86:4158-4168 [DOI] [PMC free article] [PubMed] [Google Scholar]
- 38.Corrales‐Medina VF, Simkins J, Chirinos JA, Serpa JA, Horstman LL, Jy W, Ahn YS. Increased levels of platelet microparticles in HIV‐infected patients with good response to highly active antiretroviral therapy. J Acquir Immune Defic Syndr. 2010; 54:217-218 [DOI] [PubMed] [Google Scholar]
- 39.Tien PC, Choi AI, Zolopa AR, Benson C, Tracy R, Scherzer R, Bacchetti P, Shlipak M, Grunfeld C. Inflammation and mortality in HIV‐infected adults: analysis of the FRAM study cohort. J Acquir Immune Defic Syndr. 2010; 55:316-322 [DOI] [PMC free article] [PubMed] [Google Scholar]
- 40.Reingold J, Wanke C, Kotler D, Lewis C, Tracy R, Heymsfield S, Tien P, Bacchetti P, Scherzer R, Grunfeld C, Shlipak M. Association of HIV infection and HIV/HCV coinfection with C‐reactive protein levels: the fat redistribution and metabolic change in HIV infection (FRAM) study. J Acquir Immune Defic Syndr. 2008; 48:142-148 [DOI] [PMC free article] [PubMed] [Google Scholar]
- 41.Palella FJ, Jr, Gange SJ, Benning L, Jacobson L, Kaplan RC, Landay AL, Tracy RP, Elion R. Inflammatory biomarkers and abacavir use in the women's interagency HIV study and the multicenter AIDS cohort study. AIDS. 2010; 24:1657-1665 [DOI] [PMC free article] [PubMed] [Google Scholar]
- 42.McComsey GA, Kitch D, Daar ES, Tierney C, Jahed NC, Melbourne K, Ha B, Brown TT, Bloom A, Fedarko N, Sax PE. Inflammation markers after randomization to abacavir/lamivudine or tenofovir/emtricitabine with efavirenz or atazanavir/ritonavir. AIDS. 2012; 26:1371-1385 [DOI] [PMC free article] [PubMed] [Google Scholar]
- 43.Tripodi A, Mannucci PM. The coagulopathy of chronic liver disease. N Engl J Med. 2011; 365:147-156 [DOI] [PubMed] [Google Scholar]
- 44.Bissuel F, Berruyer M, Causse X, Dechavanne M, Trepo C. Acquired protein S deficiency: correlation with advanced disease in HIV‐1‐infected patients. J Acquir Immune Defic Syndr. 1992; 5:484-489 [PubMed] [Google Scholar]
- 45.Stahl CP, Wideman CS, Spira TJ, Haff EC, Hixon GJ, Evatt BL. Protein S deficiency in men with long‐term human immunodeficiency virus infection. Blood. 1993; 81:1801-1807 [PubMed] [Google Scholar]
- 46.Erbe M, Rickerts V, Bauersachs RM, Lindhoff‐Last E. Acquired protein C and protein S deficiency in HIV‐infected patients. Clin Appl Thromb Hemost. 2003; 9:325-331 [DOI] [PubMed] [Google Scholar]
- 47.Lutsey PL, Cushman M, Steffen LM, Green D, Barr RG, Herrington D, Ouyand P, Folsom AR. Plasma hemostatic factors and endothelial markers in four racial/ethnic groups: the MESA study. J Thromb Haemost. 2006; 4:2629-2635 [DOI] [PubMed] [Google Scholar]
- 48.Cao YZ, Dieterich D, Thomas PA, Huang YX, Mirabile M, Ho DD. Identification and quantitation of HIV‐1 in the liver of patients with AIDS. AIDS. 1992; 6:65-70 [DOI] [PubMed] [Google Scholar]
- 49.Vlahakis SR, Villasis‐Keever A, Gomez TS, Bren GD, Paya CV. Human immunodeficiency virus‐induced apoptosis of human hepatocytes via CXCR4. J Infect Dis. 2003; 188:1455-1460 [DOI] [PubMed] [Google Scholar]
- 50.Xiao P, Usami O, Suzuki Y, Ling H, Shimizu N, Hoshino H, Zhuang M, Ashino Y, Gu H, Hattori T. Characterization of a CD4‐independent clinical HIV‐1 that can efficiently infect human hepatocytes through chemokine (C‐X‐C motif) receptor 4. AIDS. 2008; 22:1749-1757 [DOI] [PubMed] [Google Scholar]
- 51.Blackard JT, Welge JA, Taylor LE, Mayer KH, Klein RS, Celentano DD, Jamieson DJ, Gardner L, Sherman KE. HIV mono‐infection is associated with FIB‐4 — a noninvasive index of liver fibrosis — in women. Clin Infect Dis. 2011; 52:674-680 [DOI] [PMC free article] [PubMed] [Google Scholar]
- 52.Mendeni M, Foca E, Gotti D, Ladisa N, Angarano G, Albini L, Castelnuovo F, Carosi G, Quiros‐Roldan E, Torti C. Evaluation of liver fibrosis: concordance analysis between noninvasive scores (APRI and FIB‐4) evolution and predictors in a cohort of HIV‐infected patients without hepatitis C and B infection. Clin Infect Dis. 2011; 52:1164-1173 [DOI] [PubMed] [Google Scholar]
- 53.Schacker T. The role of secondary lymphatic tissue in immune deficiency of HIV infection. AIDS. 2008; 22suppl 3:S13-S18 [DOI] [PubMed] [Google Scholar]
- 54.Walston J, McBurnie MA, Newman A, Tracy RP, Kop WJ, Hirsch CH, Gottdiener J, Fried LP. Frailty and activation of the inflammation and coagulation systems with and without clinical comorbidities: results from the Cardiovascular Health Study. Arch Intern Med. 2002; 162:2333-2341 [DOI] [PubMed] [Google Scholar]
- 55.Deeks SG. HIV infection, inflammation, immunosenescence, and aging. Annu Rev Med. 2011; 62:141-155 [DOI] [PMC free article] [PubMed] [Google Scholar]