Abstract
Background
Endothelial cell responses during inflammation are heterogeneous and key for selectivity in how leukocytes hone in on specific sites and why vascular diseases are highly bed specific. However, mechanisms for this specificity remain unclear.
Methods and Results
Here, we exposed human endothelial cells isolated from 5 systemic arterial beds from 1 donor (to overcome donor‐to‐donor genetic/epigenetic differences), the umbilical vein, and pulmonary microvasculature to TNF‐α, LPS, and IL‐1β and assessed acute (ERK1/2 and p65) and chronic (ICAM‐1, VCAM‐1 total and surface expression) signaling responses and assessed changes in surface N‐glycans and monocyte adhesion. Significant diversity in responses was evident by disparate changes in ERK1/2 and p65 NF‐κB phosphorylation, which varied up to 5‐fold between different cells and in temporal and magnitude differences in ICAM‐1 and VCAM‐1 expression (maximal VCAM‐1 induction typically being observed by 4 hours, whereas ICAM‐1 expression was increased further at 24 hours relative to 4 hours). N‐glycan profiles both basally and with stimulation were also bed specific, with hypoglycosylated N‐glycans correlating with increased THP‐1 monocyte adhesion. Differences in surface N‐glycan expression tracked with dynamic up‐ or downregulation of α‐mannosidase activity during inflammation.
Conclusions
These results demonstrate a critical role for the vascular bed of origin in controlling endothelial responses and function to inflammatory stimuli and suggest that bed‐specific expression of N‐linked sugars may provide a signature for select leukocyte recruitment.
Keywords: heterogeneity, mannose, N‐glycans
Introduction
An effective inflammatory response requires timely and coordinated delivery of leukocytes to diseased tissue. To reach these sites, leukocytes must transmigrate across the vascular endothelium in a well‐characterized process of marginating, tethering, rolling, slow rolling, adhesion, and spreading and diapedesis.1–2 Although this process is conserved in all vascular beds, the endothelial cells lining the vessels are highly heterogeneous despite arising from a common progenitor.3–4 This heterogeneity is reflected by unique patterns of inflammation‐induced changes in protein expression and leukocyte recruitment between different endothelial cells.5–9 Moreover, specific vascular beds are more susceptible to the development of certain inflammatory diseases,10 underscoring the broad diversity of the endothelium and its role in conferring selectivity and sensitivity to different pathogenic stimuli. Although collectively these studies have confirmed the innate heterogeneity of endothelial cells, they have severely suffered from 2 major shortcomings: limited end‐point analysis and lack of coverage of representative beds. That is, they often compare cells from venous versus microvascular or arterial versus venous origins, but none of these studies have examined endothelial cells from large (aorta), medium (carotid and subclavian), and small (coronary) arteries versus cells of venous origin. Further, these studies have incorporated cells from multiple donors, which can introduce uncontrolled genetic and epigenetic factors that will influence results.
With respect to end points assessed to evaluate heterogeneity of endothelial responses to inflammatory stimuli, studies have focused on early signaling events such as activation of MAPKs11 and transcription factors (NF‐κB and KLF2)12–13 or on more chronic responses related to protein adhesion molecule expression (eg, intracellular adhesion molecule–1 [ICAM‐1] and vascular cell adhesion molecule–1 [VCAM‐1]).7,12,14 Importantly, however, adhesion molecules are heavily N‐glycosylated, which is critical for function. Protein glycosylation is an enzyme‐driven co‐/posttranslation modification that occurs in the endoplasmic reticulum (ER) and Golgi, whereby saccharides are added to the amide residue of asparagine (N‐glycosylation) or the hydroxyl group of serine or threonine (O‐glycosylation).15–16 It has been established that innate differences in surface carbohydrate patterns exists across vascular endothelium in vivo17–18 which is further modified during inflammation and disease.14,19–21 Moreover, it is now evident that endothelial cell expressed carbohydrates are involved in leukocyte trafficking, with these sugars providing a “zip code” to allow specific leukocyte subsets to migrate into specific tissues in response to specific stimuli.19,22–25 For example, our recent studies demonstrate a role for endothelial high mannose N‐glycans in monocyte rolling/adhesion and suggest that N‐glycosylation per se is regulated by inflammatory stimuli, by mechanisms that are distinct from those that affect adhesion molecule protein expression.22 This suggests that in addition to upregulation of protein adhesion molecule expression, N‐glycosylation of these adhesion molecules may also be controlled during inflammation. However, no comparison of surface N‐glycan profiles across cultured primary endothelial cells under basal and stimulated conditions has been conducted.
To test the hypothesis that endothelial N‐glycans are dynamically regulated during inflammation and in a vascular bed–specific manner to regulate leukocyte interactions, we examined the response of human vascular endothelial cells from 5 distinct arterial vascular beds isolated from a single donor to the commonly used pro‐inflammatory stimuli tumor necrosis factor–α (TNF‐α), lipopolysaccharide (LPS), and interleukin‐1β (IL‐1β). In addition, responses of human umbilical vein and pulmonary microvascular endothelial cells (from different donors) were also examined. Acute (ERK1/2 and NF‐κB [p65] phosphorylation) and chronic (ICAM‐1 and VCAM‐1 expression) readouts of inflammatory signaling responses, surface N‐glycan expression and monocyte adhesion under basal and activated conditions were compared within and across all cell lines. The results indicated significant bed‐dependent responses to stimulation and collectively highlighted the importance of choosing the appropriate cell model for understanding disease mechanisms as well as the need to confirm new findings in multiple vascular beds.
Materials
Human umbilical vein endothelial cells (HUVECs) and human pulmonary microvascular endothelial cells (HPmvECs) were purchased from Lonza Corporation and were isolated from a Hispanic female and white male, respectively (per vendor specifications). Human aortic (HAEC), carotid artery (CtAEC), coronary artery (CoAEC), subclavian artery (SCEC), and brachiocephalic artery (BCEC) endothelial cells were obtained from a 51‐year‐old white man (Cell Applications, San Diego, CA). MCDB‐131, RPMI 1640, fetal bovine serum (FBS) trypsin–EDTA, and CellTracker Green were purchased from Invitrogen (Carlsbad, CA). All other reagents were from Sigma‐Aldrich (St. Louis, MO) unless otherwise noted.
Cell Culture and Treatments
Endothelial cells were propagated on gelatin‐coated dishes in MCDB‐131 containing 10% heat‐inactivated fetal bovine serum (FBS), 25 μg/mL endothelial cell growth supplement (BD Biosciences), 30 μg/mL heparin, and penicillin (100 U/mL)/streptomycin (100 μg/mL). For experiments, cells were serum‐starved for 2 hours (0‐ to 1‐hour treatments) or transitioned to MCDB‐131 containing 1% HI‐FBS without ECGS (4‐ to 24‐hour treatments) and were stimulated with 10 ng/mL TNF‐α, 2.5 ng/mL IL‐1β, or 100 ng/mL LPS for the indicated times. For acute and chronic protein expression, cells were used at passage 4 or 5. For N‐glycan analysis, monocyte adhesion cells were used as passage 5 or 6. α‐Mannosidase activity assays were performed between passages 4 and 7. Because endothelial cell aging in culture can be associated with changes in phenotype, adhesion molecule expression, and sensitivity to cytokines,26–28 we ensured that cell passage were identical when comparing like parameters. Cells were seeded at 5×10³ cells/cm2 and used 1‐day postconfluency. THP‐1 monocyte cells were maintained in RPMI 1640 containing 10% heat‐inactivated FBS, penicillin (100 U/mL)/streptomycin (100 ng/mL), and 2 mmol/L beta‐mercaptoethanol. For adhesion experiments THP‐1 cells were labeled with CellTracker Green (1 μmol/L) for 15 minutes at 37°C.
Monocyte Adhesion Assay
Static adhesion assays were performed as previously described.22 Briefly, endothelial cells were grown to confluence in 48‐well plates and treated as described. Cells were washed with warm PBS and incubated with 6×10⁴ THP‐1 cells in Hanks' balanced salt solution containing CaCl and MgCl (1 mmol/L each) for 30 minutes at 37°C. Plates were gently washed with warm PBS, and fluorescence was measured on a Victor2 Perkin‐Elmer Fluorescent plate reader (Exc, 485 nm; Em, 535 nm).
Surface ELISA
Cells were treated as described, washed in PBS, and fixed in 4% paraformaldehyde for 10 minutes. Fixed cells were blocked in TBS containing 5% goat serum and 5% BSA for 30 minutes and incubated in the same buffer containing mouse anti‐ICAM‐1 (ab2213; Abcam, Danvers, MA) and VCAM‐1 for 1 hour at room temperature. After washing, cells were incubated with goat anti‐mouse Alexa Fluor 488 (Invitrogen) for 30 minutes at room temperature in TBS containing 5% goat serum. After exhaustive washing in TBS, fluorescence was measured as above.
Lectin Stain
Surface staining of carbohydrates was performed as previously described.19 Cells were washed in ice‐cold PBS containing MgCl and CaCl (1 mmol/L each) and kept in the same buffer for 10 minutes to abolish endocytosis. Cells were labeled with fluorescein‐conjugated lectins (ConA, LCA, SNA, PHA‐L; Vector Labs) for 10 minutes on ice before exhaustive washing in PBS and detection of fluorescence as above.
α‐Mannosidase Activity Assay
Cells were treated as described and lysed (PBS, 1% Triton X‐100) for 10 minutes on ice before clarification at 10,000g for 10 minutes. For each reaction, 10 μL of acetate buffer (1 mol/L sodium acetate [pH 6.5]) was combined with 40 μL of 25 mmol/L p‐nitrophenol‐α‐mannopyranoside and 50 μL of lysates (protein concentration was separately determined by BCA assay) in a microtiter plate. Plates were incubated overnight at 37°C, and the reaction was stopped by the addition of 100 μL of stop solution (133 mmol/L glycine, 67 mmol/L NaCl, 83 mmol/L sodium carbonate [pH 10.4]). Absorbance was measured at 405 nm. Activity is reported as the relative activity per microgram of protein. Each sample was run in duplicate, and each treatment condition was tested 4 to 6 times.
Western Blotting
Protein samples were collected in SDS‐PAGE sample buffer, boiled for 10 minutes, resolved on 4% to 15% TGX gels, and transferred to PVDF membranes (BioRad, Hercules, CA). Blots were blocked with 5% milk in TBS + 0.1% Tween‐20 (TBST) and incubated overnight at 4°C with antibodies against ICAM‐1 (#4915), ERK (#4695), p‐ERK (T202,Y204; #4370; Cell Signaling Technologies; Danvers, MA), p65 (sc372), p‐p65 (S536; sc33020), VCAM‐1 (sc‐8304; Santa Cruz Biotechnology, Santa Cruz, CA), and β‐actin (ab123020; Abcam). Blots were washed in TBST, incubated with species‐appropriate HRP‐conjugated secondary antibody (Pierce), and washed again in TBST, and signals were detected using ECL (PerkinElmer) and x‐ray film (ThermoFisher).
Statistics
All experiments were conducted a minimum of 3 times (interexperimental replicates), with 3 replicates performed within each (intraexperimental) experiment. Significant differences were calculated using GraphPad Prism and compared with control by a single 1‐way ANOVA with Tukey posttest that included all (time) experimental groups for a given cytokine treatment (ie, control versus TNF‐α, control versus LPS, and control versus IL‐1β). Because there is no a priori reason to compare different stimuli at the doses employed, comparison across treatment groups for a given stimulus was not performed. Correlation analyses were performed by linear regression. Significance was set at P<0.05.
Results
Heterogeneity in Activation of Early Signaling Pathways
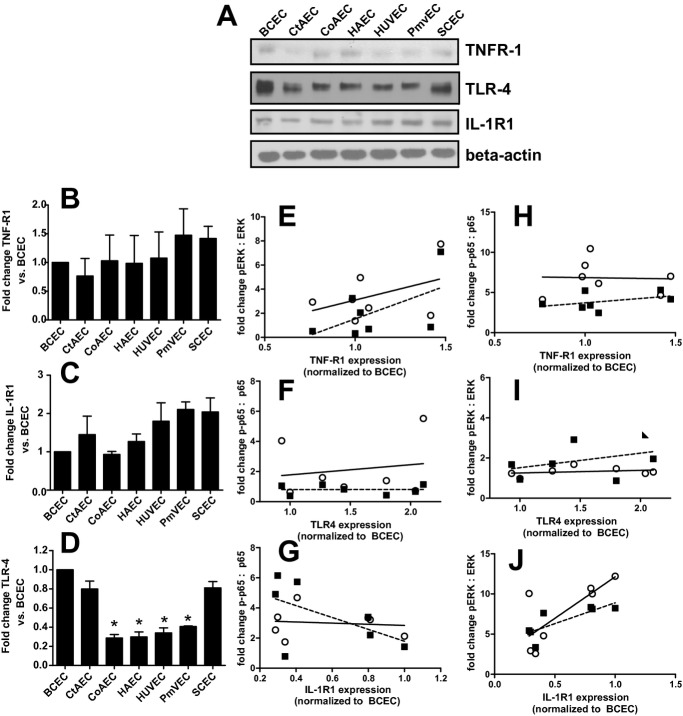
To eliminate donor‐to‐donor variability, endothelial cells were obtained that had been isolated from different vascular beds from a single donor. In addition, HUVECs and PmvECs from separate donors were also used. Cells were left untreated or treated with TNF‐α, LPS, or IL‐1β for 30 or 60 minutes, and activation (phosphorylation) of ERK1/2 (p42/p44 MAPK) and p65 (NF‐κB) measured. These represent key and early signaling intermediates that orchestrate inflammatory responses. Figure 1 shows representative Western blots and Figure 2 quantification of observed changes. TNF‐α‐dependent ERK phosphorylation significantly increased in all cells at 30 minutes. After 60 minutes this returned to control levels in CtAECs, CoAECs, HUVECs, and SCECs, remained elevated in HAECs and PmvECs, and decreased below basal levels in BCECs. LPS only significantly increased ERK phosphorylation in CoAECs and PmvECs at 30 minutes, decreased ERK phosphorylation in BCECs, and had no effect on other cells. IL‐1β increased ERK phosphorylation in BCECs, CtAECs, PmvECs, and SCECs at both the 30‐ and 60‐minute time, was only able to activate ERK at 60 minutes in CoAECs and HAECs, and did not increase phosphorylation of ERK in HUVECs at the observed times. For p65 NF‐κB, TNF‐α increased phosphorylation at both 30 and 60 minutes in all cell types tested (with activation being generally higher at 30 minutes) except CtAEC, which was only significant at 60 minutes. LPS only increased p65 phosphorylation after 60 minutes in CtAECs and had little effect on other cells tested. IL‐1β induced phosphorylation of p65 in all cell types at all times tested. These data demonstrate a broad diversity of TNF‐α‐, LPS‐, and IL‐1β‐dependent induction of early stress response–associated signaling in endothelial cells of different vascular beds. One potential mechanism for the differing extents of activation among distinct endothelial cells is different basal expression of receptors for the pro‐inflammatory stimuli tested and/or of the signaling mediators themselves. Figure 3A through 3D shows that there were no differences in the basal expression of TNFR1 (TNF‐α receptor responsible for mediating pro‐inflammatory signaling of this cytokine) or IL1‐R1 (IL‐1β receptor). Moreover, no correlation was observed between the relative expression of TNFR1 or IL1‐R1 and the degree of ERK (Figure 3E through 3F) or p65 activation (Figure 3H through 3I). For TLR4, however, significant differences in basal expression were observed, being relatively lower in CoAECs, HAECs, HUVECs, and PmvECs (Figure 3D). Interestingly, significant and positive correlations between TLR4 expression and p65 phosphorylation were observed but not for ERK phosphorylation (Figure 3G and 3J). Similarly, any differences in the basal expression ratios of p‐ERK:ERK and p‐p65:p65 could influence the degree of activation observed after the addition of inflammatory stimuli. Figure 4 shows that basal p‐ERK:ERK ratios were highest in CtAECs. Relative analysis of p‐p65:p65 was not possible as the phosphorylated form was not detectable basally in BCECs, CtAECs, and SCECs (not shown). Figure 4B through 4D shows correlations between basal pERK:ERK expression and the induction of ERK phosphorylation by TNF‐α, IL‐1β, and LPS, respectively. No correlations were observed. All together, these data further illustrate the heterogeneity between endothelial cells and indicate that neither the basal expression of the respective receptors for TNF‐α, LPS, or IL1β nor the basal activation state of ERK is the primary determinant of the endothelial‐specific responses observed in Figures 1 and 2.
Figure 1.
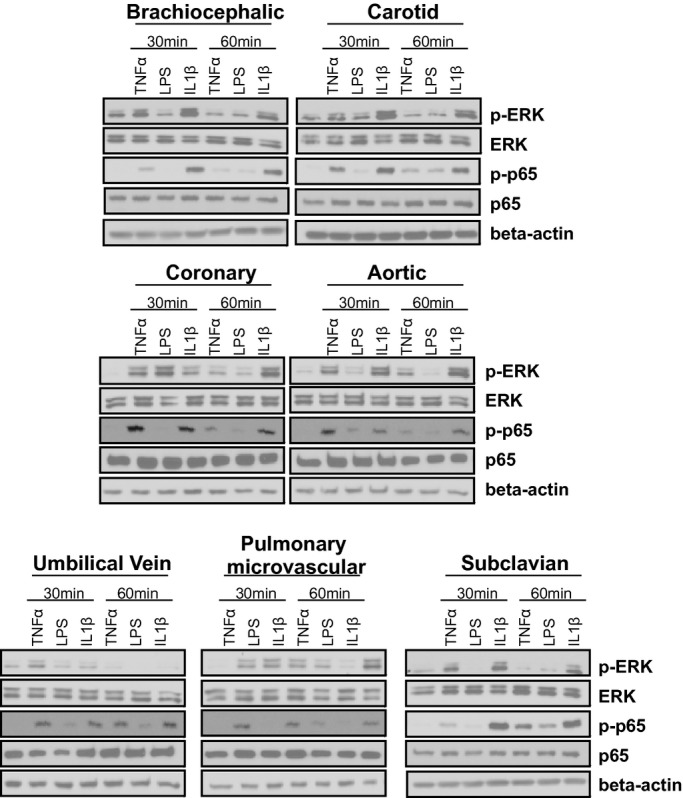
Heterogeneous phosphorylation of ERK and p65 in endothelial cells from divergent vascular beds. Endothelial cells were left untreated or treated with TNF‐α (10 ng/mL), LPS (100 ng/mL), or IL‐1β (2.5 ng/mL) for 30 or 60 minutes. Lysates were analyzed by Western blot analysis for the expression of p‐ERK (T202,Y204), ERK, p‐p65 (S536), p65, and β‐actin. Blots are representative of 3 separate experiments. TNF‐α indicates tumor necrosis factor–α; LPS, lipopolysaccharide; IL‐1β, interleukin‐1β; ERK, extracellular signal‐regulated kinase.
Figure 2.
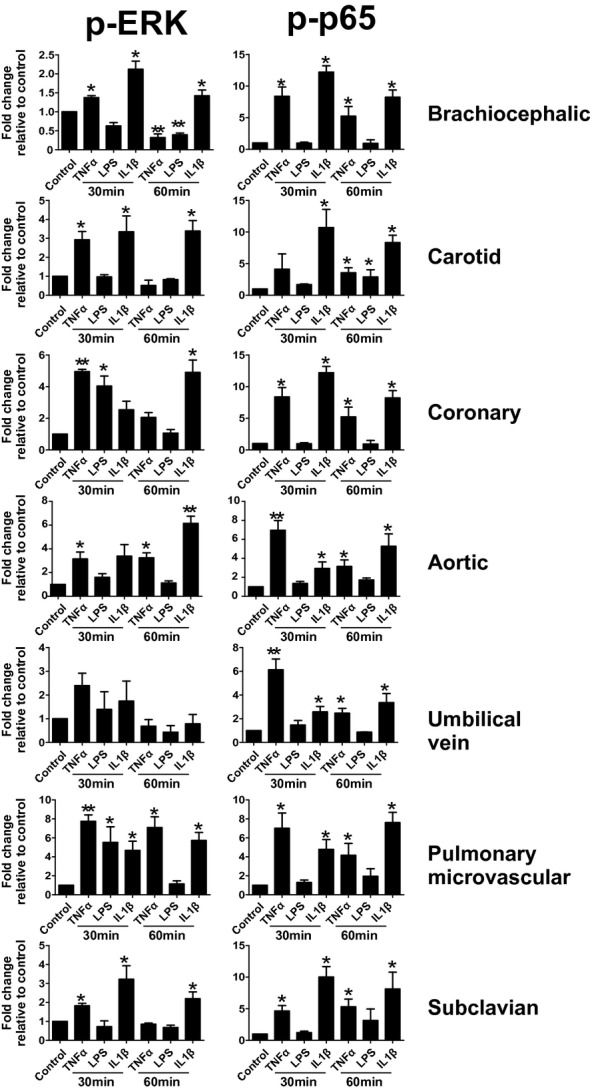
ERK and p65 phosphorylation in endothelial cells from different vascular beds. Endothelial cells were left untreated or treated with TNF‐α (10 ng/mL), LPS (100 ng/mL), or IL‐1β (2.5 ng/mL) for 30 or 60 minutes. Lysates were analyzed by Western blot analysis for the expression of p‐ERK (T202,Y204), ERK, p65 (S536), or p‐p65. Western blot data were analyzed by Image J. Data are mean±SEM (n=3). *P<0.05 and **P<0.01 vs control by a single 1‐way ANOVA with Tukey posttest. TNF‐α indicates tumor necrosis factor–α; LPS, lipopolysaccharide; IL‐1β, interleukin‐1β; SEM, standard error of the mean; ANOVA, analysis of variance.
Figure 3.
Basal expression of TNFR1, IL1‐R1, and TLR4 among different endothelial cells. A, Representative Western blots for basal expression of indicated receptors. B, C, and D, Quantitation of Western blots in A. Data are mean±SEM (n=3). *P<0.01 relative to BCECs, CtAECs, and SCECs by 1‐way ANOVA with Tukey posttest. E, F, and G, Correlations between the degree of ERK activation (normalized to basal levels for each cell type), on the y axis, for TNF‐α, IL‐1β, and LPS, respectively, vs basal expression of TNFR1, IL1‐R1, and TLR4 (x axis), respectively. Receptor expression is shown relative to level in BCECs. H, I, J, Correlations between the degree of p65 activation (normalized to basal levels for each cell type), on the y axis, for TNF‐α, IL‐1β, and LPS, respectively, vs basal expression of TNFR1, IL1‐R1, and TLR4 (x axis), respectively. Data for signaling molecule activation for 30 minutes (○) and 60 minutes (■) post stimulation are shown. Lines show linear regression fits for 30‐minute (—) and 60‐minute (‐ ‐ ‐) data. No correlations were significant (P>0.05) except for J data, which was P<0.05 by linear regression for the 30‐ and 60‐minute data with y=10.3x+1.8 and y=5.2x+3.7 for the 30‐ and 60‐minute data, respectively. TNFR1 indicates tumor necrosis factor–α receptor 1; IL1‐R1, interleukin‐1β receptor 1; SEM, standard error of the mean; BCECs, brachiocephalic artery endothelial cells; CtAECs, carotid artery endothelial cells; SCECs, subclavian artery endothelial cells; ANOVA, analysis of variance; LPS, lipopolysaccharide; HAECs, human aortic endothelial cells; HUVECs, human umbilical vein endothelial cells; PmvECs, pulmonary microvascular endothelial cells; TLF4, toll‐like receptor 4.
Figure 4.
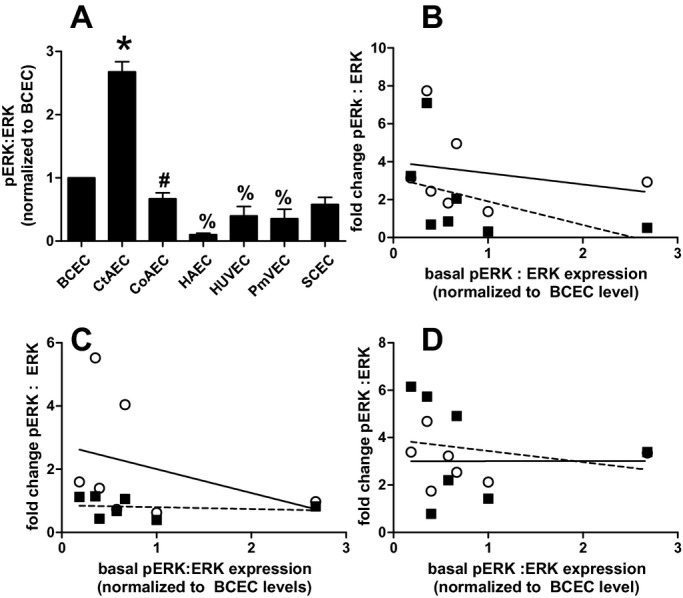
Basal expression of pERK:ERK ratio in different endothelial cells. A, Quantitation of pERK:ERK ratios under basal conditions in different endothelial cells normalized to ratio in BCECs. Data are mean±SEM (n=3). *P<0.01 vs all other cell types, #P<0.05 vs HAECs and %P<0.05 vs BCECs by 1‐way ANOVA with Tukey posttest. B, C, D, Correlations between the degree of ERK activation (normalized to basal levels for each cell type), on the y axis, for TNF‐α, LPS, or IL‐1β, respectively, vs basal expression of the p‐ERK:ERK ratio normalized to the level in BCECs. Data for signaling molecule activation for 30 minutes (○) and 60 minutes (■) poststimulation are shown. Lines show linear regression fits for 30‐minuts (—) and 60‐minute (‐ ‐ ‐) data. No significant correlations were observed. BCECs indicates brachiocephalic artery endothelial cells; CtAECs, carotid artery endothelial cells; SCECs, subclavian artery endothelial cells; HAECs, human aortic endothelial cells; HUVECs, human umbilical vein endothelial cells; PmvECs, pulmonary microvascular endothelial cells; ANOVA, analysis of variance; SEM, standard error of the mean; TNF‐α, tumor necrosis factor–α; LPS, lipopolysaccharide; IL‐1β, interleukin‐1β.
Endothelial Heterogeneity in Activation of Adhesion Molecules
To assess if more chronic signaling responses were also distinct, cells were exposed to TNF‐α, LPS, or IL1β for 0, 4, 12, or 24 hours, and the expression of ICAM‐1 and VCAM‐1 was determined. As seen in Figure 5, TNF‐α and IL‐1β induced ICAM‐1 and VCAM‐1 expression in all cells. Notable observations include distinct time‐dependent changes in ICAM‐1 versus VCAM‐1, minimal induction of adhesion molecule expression in HAECs by LPS, and a relatively lower degree of adhesion molecule expression in PmvECs compared with other cells. To better understand how the level of expression differed between cell lines, the same lysates from Figure 5 (4‐ and 24‐hour treatments) were run side by side for a direct comparison. Figure 6 shows that the expression of adhesion molecules was highly diverse, with CoAECs and HUVECs generally having the highest expression with all stimuli.
Figure 5.
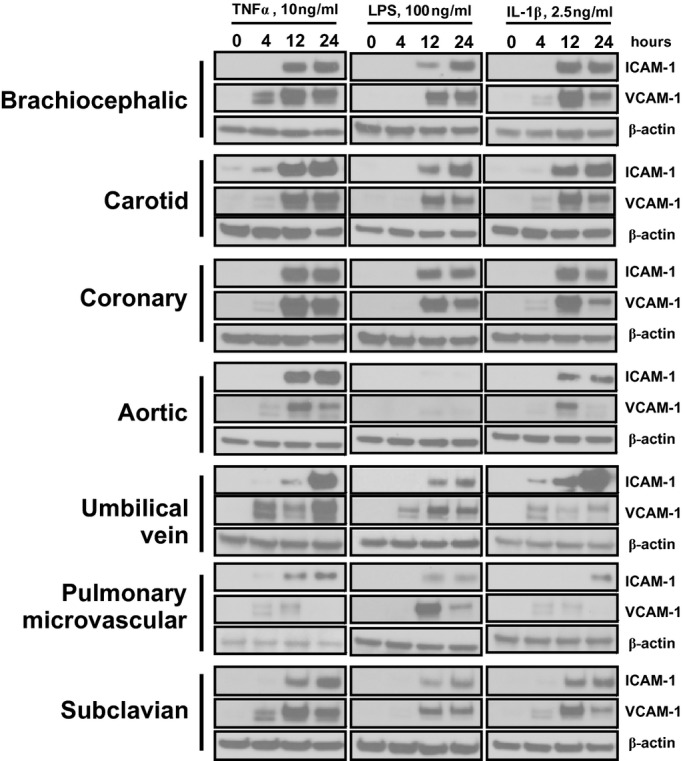
ICAM‐1 and VCAM‐1 expression in different vascular beds. Endothelial cells were left untreated or treated with TNF‐α (10 ng/mL), LPS (100 ng/mL), or IL‐1β (2.5 ng/mL) for 4, 12, or 24 hours. Lysates were run for Western blot analysis, and the expression of ICAM‐1, VCAM‐1, and β‐actin was determined. Data are representative of 3 separate experiments. ICAM‐1 indicates intracellular adhesion molecule–1; VCAM‐1, vascular cell adhesion molecule–1; TNF‐α, tumor necrosis factor–α; LPS, lipopolysaccharide; IL‐1β, interleukin‐1β.
Figure 6.
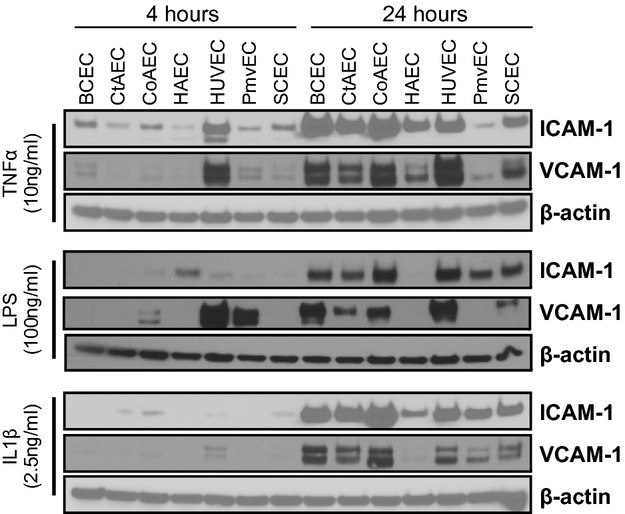
Comparative Western blot analysis of adhesion molecule expression in stimulated endothelial cells. Endothelial cells were stimulated with TNF‐α (10 ng/mL), LPS (100 ng/mL), or IL‐1β (2.5 ng/mL) for 4 or 24 hours. Lysates were resolved for Western blot analysis of ICAM‐1, VCAM‐1, and β‐actin. Blots shown are representative from 3 experiments. TNF‐α indicates tumor necrosis factor–α; LPS, lipopolysaccharide; IL‐1β, interleukin‐1β; ICAM‐1, intracellular adhesion molecule–1; VCAM‐1, vascular cell adhesion molecule–1; BCECs, brachiocephalic artery endothelial cells; CtAECs, carotid artery endothelial cells; CoAECs, coronary artery endothelial cells; HAECs, human aortic endothelial cells; HUVECs, human umbilical vein endothelial cells; PmvECs, pulmonary microvascular endothelial cells; SCECs, subclavian artery endothelial cells.
To participate in leukocyte adhesion, ICAM‐1 and VCAM‐1 must be positioned on the surface of endothelial cells so that they can engage with their integrin ligands. Therefore, to better assess functional implications, ICAM‐1 and VCAM‐1 expression was measured on the cell surface using a surface ELISA in unpermeabilized cells. As seen in Figure 7, there was a time‐dependent induction of ICAM‐1 in all cell types with all stimuli. In contrast, VCAM‐1 expression was maximal in all cases by 4 hours. Note that only TNF‐α induced significant VCAM‐1 surface expression in HUVECs, whereas none of the stimuli significantly increased VCAM‐1 levels in SCECs. A comparison of the expression of ICAM‐1 and VCAM‐1 across the cell lines can be found in Figure 8 and highlights that ICAM‐1 and VCAM levels were generally highest in CoAECs and HUVECs with all stimulations. Collectively, these data show that whole‐cell lysate measurements of ICAM‐1 or VCAM‐1 did not necessarily correlate with surface expression and demonstrate significant vascular bed specificity in how TNF‐α, LPS, and IL‐1β mediate upregulation of these adhesion molecules.
Figure 7.
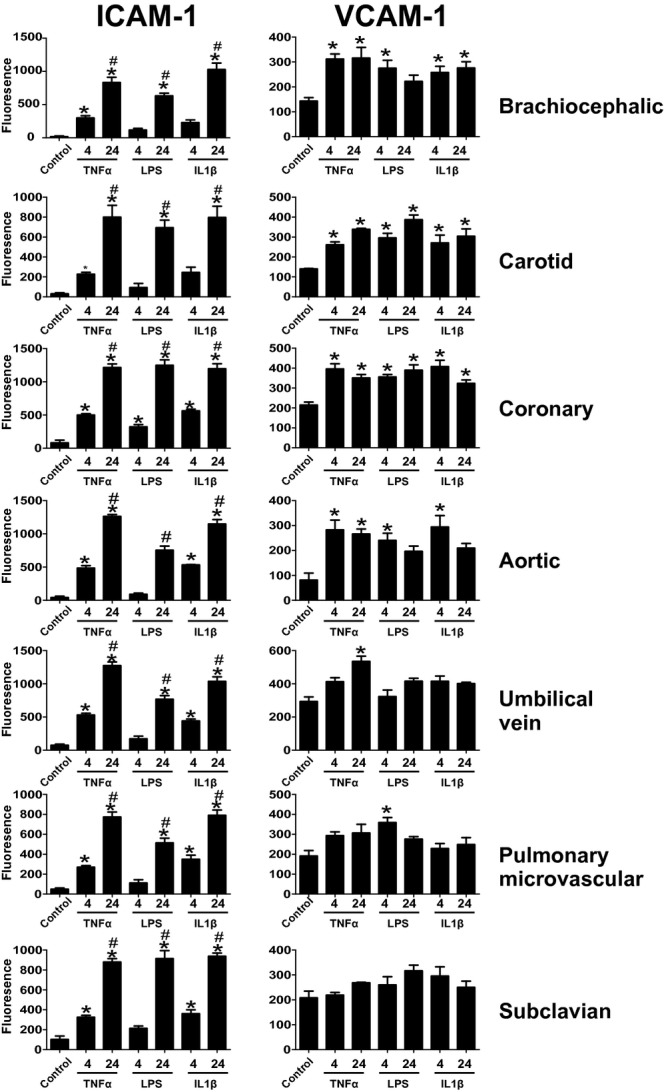
Surface expression of ICAM‐1 and VCAM‐1 Endothelial cells were left untreated or treated with TNF‐α (10 ng/mL), LPS (100 ng/mL), or IL‐1β (2.5 ng/mL) for 4 or 24 hours. Cells were the fixed, and surface ELISA for the expression of ICAM‐1 (A) and VCAM‐1 (B) was performed. *P<0.05 compared witho control, #P<0.05 relative to 4 hours by a single 1‐way ANOVA with Tukey posttest. Data are mean±SEM (n=4). ICAM‐1 indicates intracellular adhesion molecule–1; VCAM‐1, vascular cell adhesion molecule–1; TNF‐α, tumor necrosis factor–α; LPS, lipopolysaccharide; IL‐1β, interleukin‐1β; ANOVA, analysis of variance; SEM, standard error of the mean.
Figure 8.
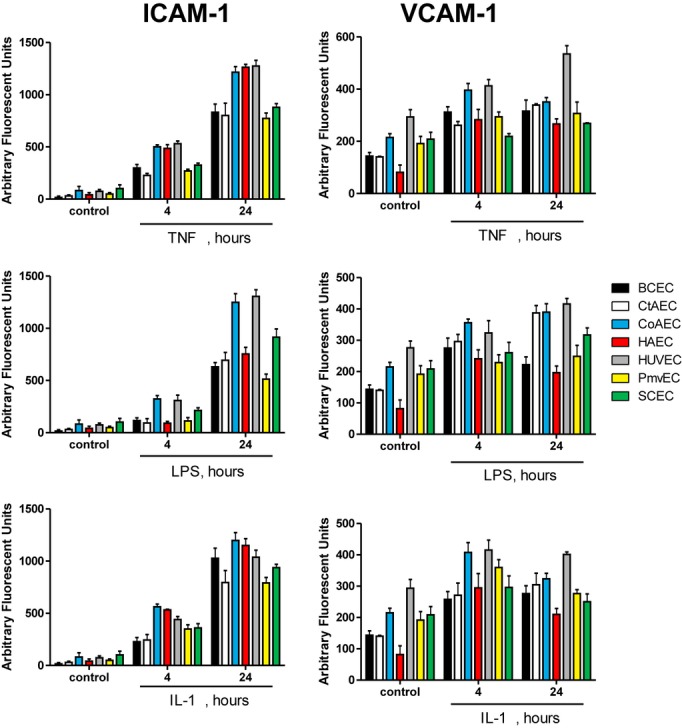
Comparison of surface adhesion molecule expression in endothelial cells from divergent vascular beds. Endothelial cells were left untreated or treated with TNF‐α (10 ng/mL), LPS (100 ng/mL), or IL‐1β (2.5 ng/mL) for 0, 4, or 24 hours, and surface levels of ICAM‐1 and VCAM‐1 were determined by surface ELISA. Data are mean±SEM (n=4). ICAM‐1 indicates intracellular adhesion molecule–1; VCAM‐1, vascular cell adhesion molecule–1; TNF‐α, tumor necrosis factor–α; LPS, lipopolysaccharide; IL‐1β, interleukin‐1β; SEM, standard error of the mean.
Heterogeneity in Cell Surface N‐Glycan Content
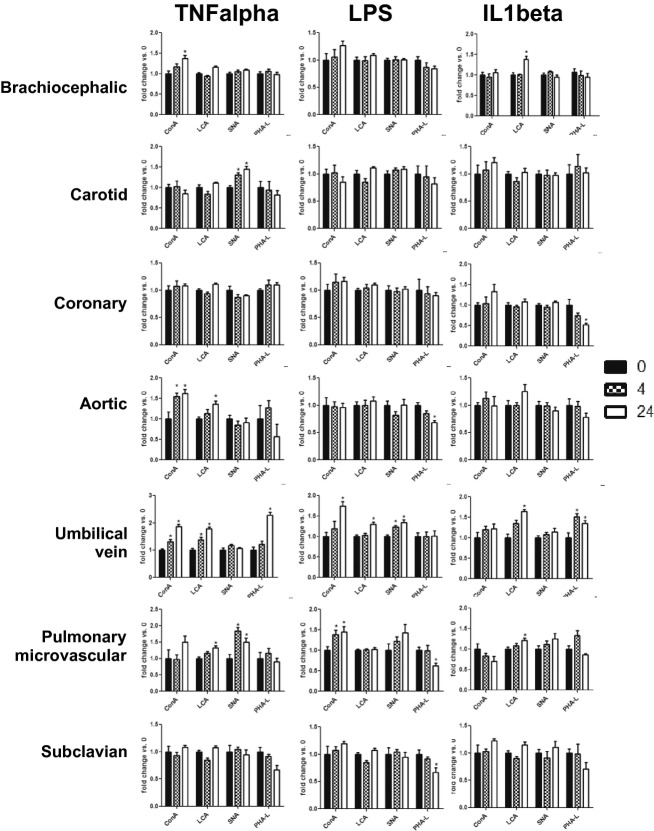
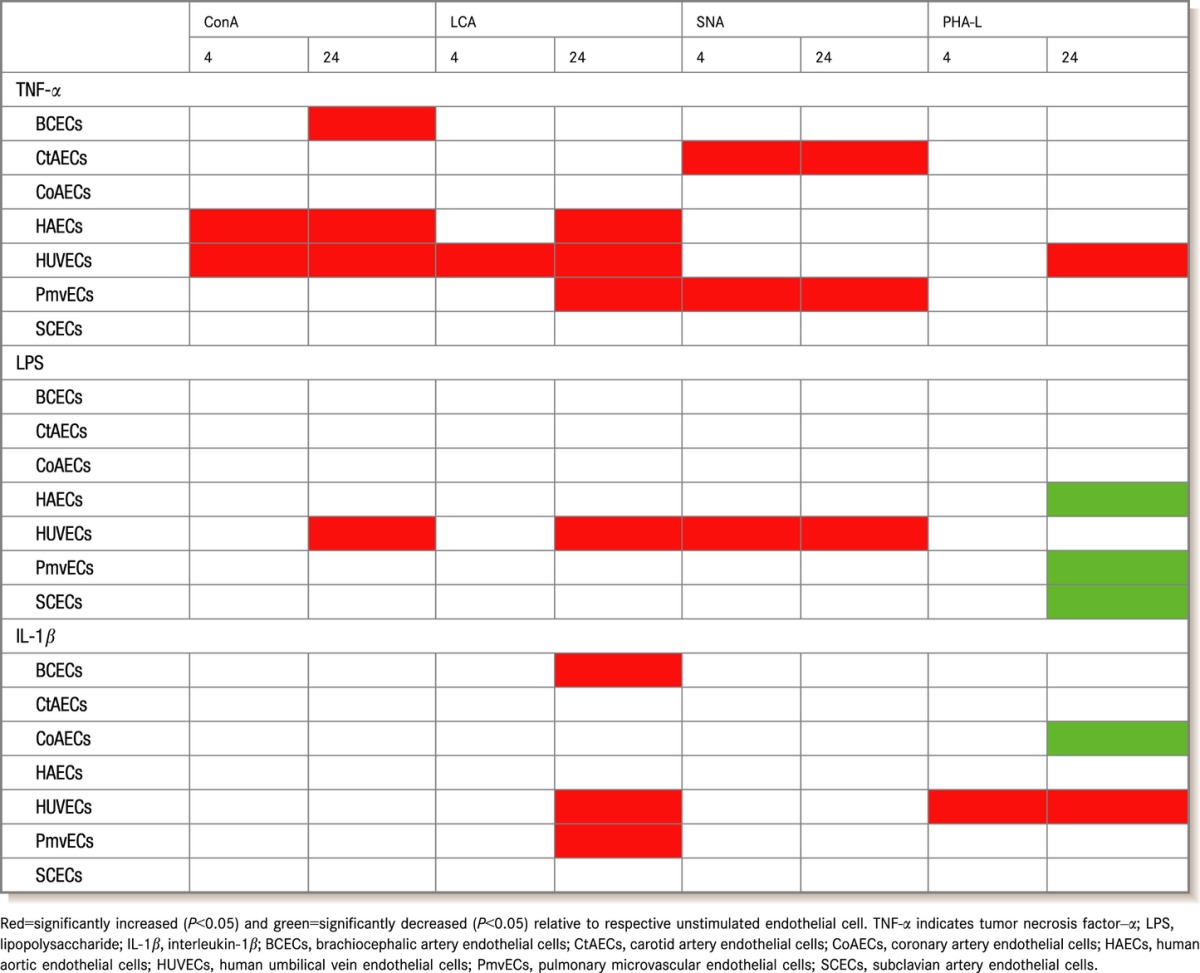
Carbohydrate modifications of endothelial adhesion molecules (both O‐ and N‐glycans) provide important ligands for leukocyte receptors. Our recent studies implicated a role for N‐glycan‐linked high‐mannose epitopes on aortic endothelium in recruiting monocytes.19,22 Carbohydrate profiles on the surface display vascular bed specificity under basal conditions, but little is known about whether this changes during inflammation also in a bed‐dependent manner. Figure 9 shows surface staining of different endothelial cells under basal conditions with a panel of lectins (Table 1) that collectively recognize high mannose, hybrid, and complex N‐glycans, thereby providing broad coverage of all major N‐glycan types. As seen in Figure 9, there was no difference in the basal levels of SNA or PHA‐L binding across the cell types, but ConA binding was higher in CtAECs and CoAECs compared with HAECs, HUVECs, and PmvECs. Also, LCA binding was increased in CtAECs and CoAECs compared with BCECs and was elevated in CoAECs compared with HAECs and HUVECs. These indicate no differences in complex N‐glycans, but increased high mannose and hybrid N‐glycans in CtAECs and CoAECs. Figure 10 shows and Table 2 summarizes changes in surface lectin staining in response to different inflammatory stimuli. TNF‐α increased ConA binding to BCECs, HAECs, and HUVECs, LCA binding in HAECs, HUVECs, and PmvECs, SNA binding to CtAECs and PmvECs, and PHA‐L binding to HUVECs. LPS increased ConA binding to HUVECs and PmvECs, LCA binding to HUVECs, and SNA binding to HUVECs and caused a decrease in PHA‐L binding to HAECs, PmvECs, and SCECs. Finally, IL‐1β had no effect on ConA, increased binding of LCA in BCECs, HUVECs, and PmvECs, increased binding of PHA‐L in HUVECs, and decreased PHA‐L binding in CoAECs.
Figure 9.
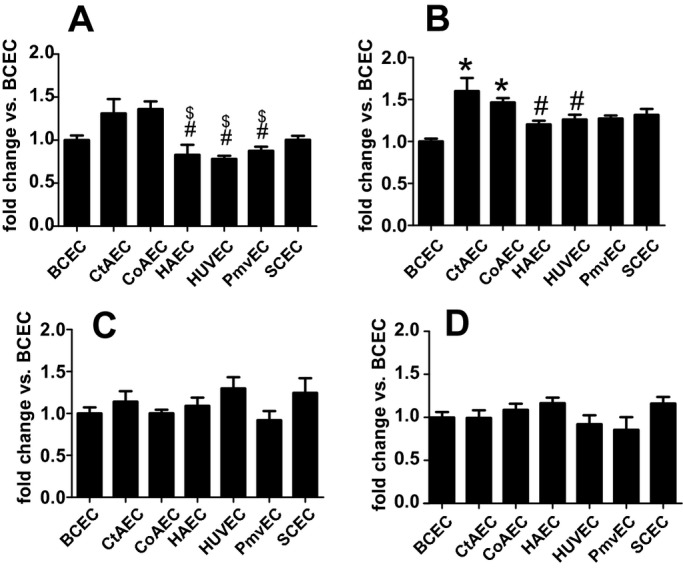
Lectin‐binding patterns across endothelial cells from different vascular beds. Untreated endothelial cells were surface‐labeled with FITC‐conjugated ConA (A), LCA (B), PHA‐L (C), or SNA (D) as described in the Methods section. A, $P<0.05 vs CoAEC and #P<0.05 vs CtAEC. B, *P<0.05 vs BCECs and #P<0.05 vs CtAECs. Data are mean±SEM All statistical analysis by a single 1‐way ANOVA with Tukey posttest (n=4 to 6 for each condition). BCECs indicates brachiocephalic artery endothelial cells; CtAECs, carotid artery endothelial cells; CoAEC, coronary artery endothelial cells; HAECs, human aortic endothelial cells; HUVECs, human umbilical vein endothelial cells; PmvECs, pulmonary microvascular endothelial cells; SCECs, subclavian artery endothelial cells; ANOVA, analysis of variance; SEM, standard error of the mean; FITC, fluorescein isothiocyanate; ConA, concanavalin A; LCA, lens culinaris agglutinin; PHA‐L, phaseolus vulgaris lectin; SNA, sambucus nigra lectin.
Table 1.
Specificity of Lectins Used
| Lectin | N‐Glycan Structure |
|---|---|
| ConA | High‐mannose >>> hybrid > complex |
| LCA | Hybrid |
| SNA | Complex |
| PHA‐L | Complex |
ConA indicates concanavalin A; LCA, lens culinaris agglutinin; SNA, sambucus nigra lectin; PHA‐L, phaseolus vulgaris lectin.
Figure 10.
Quantitaiton of surface N‐glycan content in endothelial cells from divergent vascular beds. Endothelial cells were left untreated or treated with TNF‐α (10 ng/mL), LPS (100 ng/mL), or IL‐1β (2.5 ng/mL) for 0, 4, or 24 hours, and surface levels of ConA, LCA, PHA‐L, and SNA were determined. *P<0.05 vs control by 1‐way ANOVA with Tukey posttest. TNF‐α indicates tumor necrosis factor–α; LPS, lipopolysaccharide; IL‐1β, interleukin‐1β; ANOVA, analysis of variance.
Table 2.
Changes in Surface N‐Glycan Profiles 4 or 24 Hours After Treatment with Different Proinflammatory Stimuli
Previously we demonstrated that TNF‐α‐dependent stimulation of high mannose/hybrid structures on the HAEC surface was associated with decreased α‐mannosidase (α‐MAN) activity.7 N‐glycan maturation occurs in a stepwise process, whereby mannose residues are trimmed in the ER and Golgi by a family of α‐mannosidases. The resultant platforms allow for subsequent maturation into complex N‐glycan structures.15 Inhibition of α‐MAN activity therefore results in the accumulation of hypoglycosylated high‐mannose N‐glycans. Numerous studies have now shown that limiting N‐glycan branching promotes inflammatory disease development.29–33 We hypothesized that distinct sensitivity of α‐MAN during inflammation may provide a mechanism to explain distinct responses of endothelial cells from different vascular beds. Figure 11A shows that basal α‐MAN activity varied 3‐fold among the cell types studied, with activity being highest in HUVECs. Activity in BCECs and CtAECs was also greater compared with CoAECs, HAECs, PmvECs, and SCECs. Figure 11B shows that TNF‐α significantly decreased α‐MAN activity in HAECs and HUVECs, significantly increased it in PmvECs and SCECs, and had no effect in BCECs, CtAECs, or CoAECs. TNF‐α‐dependent decreased α‐MAN activity in HUVECs and HAECs correlated with the increased ConA binding observed in these cells (Table 2), suggesting that this family of enzymes is critical regulators of endothelial N‐glycan processing and, importantly, is distinctly regulated in different vascular beds.
Figure 11.
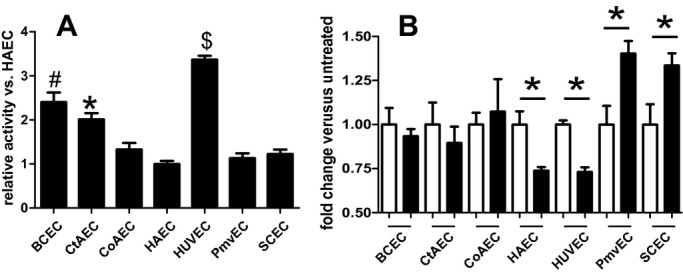
α‐Mannosidase activity in endothelial cells from different vascular beds. A, Basal α‐mannosidase activity levels were measured as described in the Methods section. B, Endothelial cells were left untreated (□) or stimulated (■) with TNF‐α (10 ng/mL, 24 hours), and α‐mannosidase activity was determined. A, $P<0.05 vs all other cells tested, #P<0.05 vs all cells tested, and *P<0.05 vs all cells tested. B, *P<0.05 vs untreated control. All statistical analysis by single 1‐way ANOVA with Tukey posttest (n=4 to 6 for each condition). Data are mean±SEM. TNF‐α indicates tumor necrosis factor–α; ANOVA, analysis of variance; SEM, standard error of the mean.
Heterogeneous Stimulation of Monocyte Adhesion
Functional insights into altered basal and stimulated N‐glycosylation profiles were determined by measuring THP‐1 monocyte adhesion to endothelial cells under basal and activated conditions. Figure 12 shows a striking diversity in basal adhesiveness, with CoAECs and SCECs displaying elevated adhesion compared with other cells tested. After stimulation, TNF‐α significantly increased adhesion in all cells except BCECs, and only in CtAECs and SCECs was there temporal activation of adhesion. LPS stimulated adhesion in all cells although not at all times, as it failed to increase adhesion in BCECs at 4 hours and SCECs at 24 hours. Finally, IL‐1β increased adhesion in all cells at all times except for SCECs, in which it had no effect. Collectively, these data demonstrate bed‐ and stimulus‐specific differences in monocyte adhesion.
Figure 12.
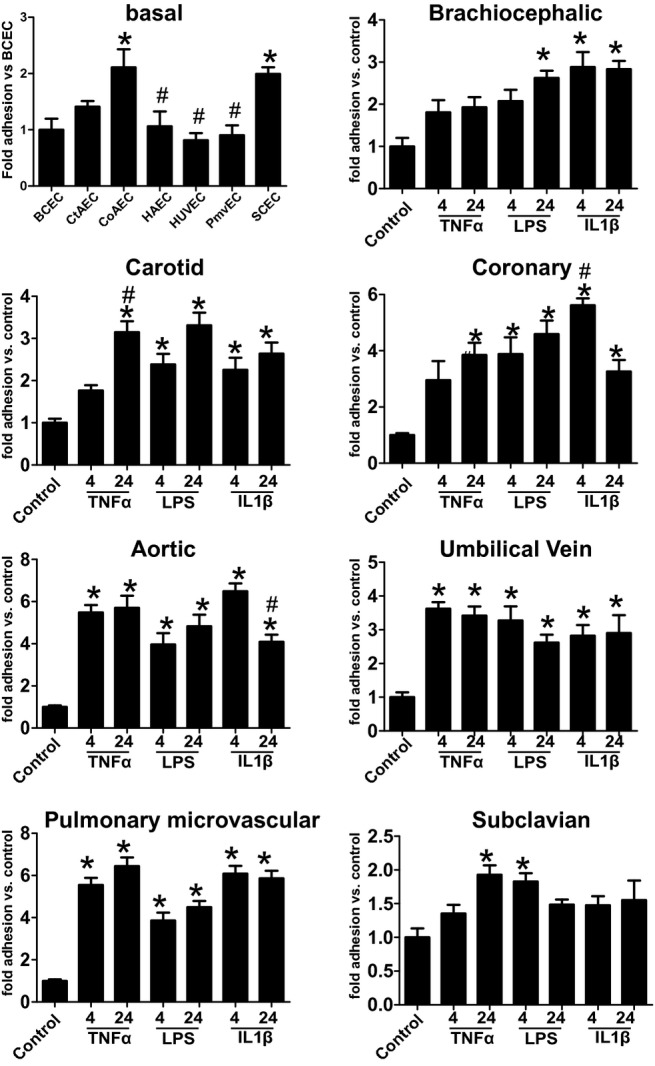
Monocyte adhesion to endothelial cells from different vascular beds. THP‐1 monocyte adhesion was assessed on unstimulated endothelial cells (basal) or after stimulation with TNF‐α (10 ng/mL), LPS (100 ng/mL), or IL‐1β (2.5 ng/mL) for 4 or 24 hours as indicated. For basal data, *P<0.05 vs BCECs and #P<0.05 vs SCECs. For different vascular bed data, *P<0.05 vs unstimulated control by 1‐way ANOVA with Tukey posttest (n=4 to 6 for each condition). Data are mean ± SEM. TNF‐α indicates tumor necrosis factor–α; LPS, lipopolysaccharide; IL‐1β, interleukin‐1β; BCECs, brachiocephalic artery endothelial cells; SCECs, subclavian artery endothelial cells; ANOVA, analysis of variance; SEM, standard error of the mean.
Discussion
In the current work we have examined the heterogeneity of vascular endothelial cells under basal and stimulated conditions to better understand the dynamic nature of inflammatory responses seen throughout the vasculature. We used BCECs, HAECs, CtAECs, CoAECs, and SCECs isolated from a single donor to overcome potential genetic/epigenetic effects that are likely factors when comparing cells from multiple donors. We also tested HUVECs and PmvECs that were from different donors to provide a comparison with commonly used vascular beds. We acknowledge the limitations in this approach, as insights gained may be donor specific and also note the potential for heterogeneity introduced because of underlying diseases present within defined regions of any part of the vasculature. That said, the large majority of studies employing endothelial cells do not describe the number of donors used (most likely 1 and 2) or the basal health status of the donor that the cells were derived from. With this mind, we opted to use cells from only 1 donor because our primary goal was to assess the vascular bed of origin on arterial endothelial cell responses to inflammatory stimuli. Our data show that broad heterogeneity exists in the intrinsic response to stimuli in terms of signaling pathway activation (Figure 1), extent of adhesion molecule expression (Figures 5–8), surface N‐glycan content (Figure 9–10 and Table 2), N‐glycan processing potential (Figure 11), and monocyte adhesion (Figure 12).
The scientific literature contains numerous examples of how cells from different vascular beds respond disparately to similar stimulation.5–7,9,34 For example, Beck and colleagues elegantly demonstrated the disparate responses of 30 distinct HUVEC lines to LPS stimulation13 and specifically showed the ability of LPS to activate NF‐κB in all cells tested, despite profound differences in adhesion molecule expression and cytokine production, demonstrating that there is an uncoupling of endothelial cell activation and proadhesive response. However, this is not surprising given that the cells were from 30 separate donors and included not only uncontrolled variables such as race and age or genetic/epigenetic variation in receptor expression (TLR4) but also lifestyle factors such as tobacco and alcohol use. In the current work, LPS potently induced ICAM‐1/VCAM‐1 (Figures 6 and 7) expression in CoAECs and HUVECs, but to a much lesser extent in other cells, this despite CoAECs and HUVECs having significantly lower TLR4 expression than other cells tested (BCECs, CtAECs, SCECs), indicating that this selective sensitivity to LPS was not regulated at the receptor level. We do note, however, that p65 activation was proportional to the basal level of TLR4 expression. Given that the endothelial cells were from a single donor, environmental factors and underlying donor‐specific variations can be ruled out, and thus a clear conclusion that there are vascular bed–specific differences in LPS signaling can be drawn. Although this is certainly understood given the body of literature cited above, this finding was unexpected in the current work, as the cells were all of arterial origin and from a single donor. It is also striking to note that cells from CoAECs routinely displayed the highest adhesion molecule expression (Figure 1) and increased levels of basal hypoglycosylated N‐glycans (Figure 9) and monocyte adhesion (Figure 12). It is possible that the donor had underlying inflammation in the coronary artery and that this led to these findings. However, that does not change the finding that these cells, when compared with the other arterial beds from that donor, displayed elevated activation and highlights the importance of choosing the proper bed for experimentation as well as the limitation in data interpretation that can come from examining only 1 vascular bed. This underscores that, although cumbersome for researchers, novel findings need to be confirmed in multiple primary cell lines rather than relying on cells from a single donor or bed. Finally, that the differential expression of the associated receptors or immediate downstream signaling molecules for the stimuli tested might be differentially expressed in these cells only underscore the heterogeneity of the cells tested.
Our data also demonstrate that although profound differences in endothelial cell activation and adhesion molecule expression exist, so do surface N‐glycan content and N‐glycan processing potential (Figures 10 and 11 and Table 1). The latter is interesting because regulation of protein expression is controlled by the genetic code, but N‐glycan‐dependent posttranslation modification is largely controlled by the relative activity of N‐glycan processing enzymes and carbohydrate substrate availability. We suggest that modulation of α‐MAN activities is a critical and novel mechanism that couples canonical inflammation‐dependent activation of NF‐κB and adhesion molecule expression with ensuring that the N‐glycoforms of these proteins are appropriately formed and, moreover, that this occurs in a vascular bed–specific manner. From a functional perspective, N‐glycosylation is typically thought to ensure proteins are folded and trafficked to membranes for surface expression or secretion (eg, for E‐ and L‐selectin35–37). However, mounting evidence suggests that endothelial cell N‐glycans are also critical mediators of leukocyte trafficking.1,19,22 In terms of endothelial adhesion molecules known to participate in leukocyte recruitment, the glycosylation status of ICAM‐1,38–39 VCAM‐1,23 and PECAM‐140 has been shown to affect functions pertaining to leukocyte recruitment.
Interestingly, in the case of each of the proteins in which N‐glycosylation is known to play a role in function, less complex N‐glycans (hypoglycosylated N‐glycans) appear to promote leukocyte trafficking.1,9,40 In support of this conclusion, CoAECs displayed elevated basal levels of hypoglycosylated N‐glycans (Figure 9) and also showed the highest level of basal THP‐1 binding (Figure 12). As to which adhesion molecules could possibly carry these N‐glycans, ICAM‐1 is a lead candidate. It was previously demonstrated that ICAM‐1 carrying high‐mannose N‐glycans supports increased Mac‐1 binding, and removal of N‐glycans around the Mac‐1 binding site by point mutagenesis also increases Mac‐1 binding.38 It was originally postulated that this occurred because N‐glycans in close proximity to the Mac‐1 binding domain provided a steric hindrance. However, another possibility exists in the context of high‐mannose ICAM‐1, whereby the lectin‐like domain of Mac‐1 may be involved in binding. Previous studies demonstrated that Mac‐1 could bind mannose in the form of α‐d‐mannopyronoside41 or mannosylated glycopolymers,42 or with mannose‐rich type I fimbriated Escherichia coli43 and that its lectin domain is involved in cell adhesion.41,44 Recent evidence has shown that interactions with carbohydrates is sufficient to activate Mac‐1‐mediated signaling45 and implicates a potential role of ICAM‐1 mannose residues in leukocyte interactions.
Another possible candidate is VCAM‐1, as removal of sialic acid increases leukocyte trafficking, but this phenomenon was difficult to explain, as no N‐glycan sites are found in proximity to the VLA‐4 binding domain.23 This gap has recently been clarified by studies demonstrating that galectin‐3 can bind to VCAM‐1 and support leukocyte adhesion.24–25 With PECAM‐1, α‐2,6‐sialic acid has been reported to be critical for homodimerization and associated antiapoptotic signaling.40 Whether ICAM‐1, PECAM‐1, VCAM‐1, or any of the other proteins mentioned exist in hypoglycosylated forms or in different N‐glycoforms in different vascular beds requires additional investigation. It should be noted that the glycosylation state of adhesion molecules is known to be directly influenced by the cell in which they are produced,46–49 so the concept of regional N‐glycoforms of proteins is intriguing.
In fact, the concept that regional changes in endothelial glycosylation could regulate immune cell trafficking by creating a “zip code” is not new.21 In this scenario, the adhesion molecule protein acts as a molecular scaffold that carries the glycan, and only when found together can proper receptor–ligand interactions occur. This concept has been well explored in leukocytes in which certain proteins such as PSGL‐1 carry sialyl‐Lewis x (sLex) epitopes that are ligands for endothelial selectins.50 However, not all PSGL‐1 proteins contain sLex, and many proteins that do contain sLex are not ligands for endothelial selectins. This clearly demonstrates that to support maximal leukocyte adhesion, the proper combination of protein adhesion molecule and N‐glycan must be present.37 We hypothesize that expression of specific adhesion molecule glycoforms with distinct functions or selective interactions with leukocyte subsets will be vascular bed dependent.
Other notable findings in the current work include differences between VCAM‐1 and ICAM‐1 expression within a cell type and the lack of any direct correlation between these adhesion molecules when measured in whole‐cell lysates by Western blotting compared with surface expression. Expression of both VCAM‐1 and ICAM‐1 occurs via NF‐κB‐dependent processes. However, clear cell‐type and inflammatory stress–dependent differences in how these adhesion molecules are induced were evident. Specifically, both ICAM‐1 and VCAM‐1 displayed time‐dependent increases in whole‐cell lysates, which was largely correlated with temporal changes for ICAM‐1 on the cell surface. In contrast, VCAM‐1 surface expression was maximal at 4 hours and was not induced at all in SCECs, despite significant increases in expression by all cytokines tested measured by Western blotting. Whether this reflects differential protein turnover rates or inefficiency of membrane expression of newly transcribed proteins is unclear. However, because the surface‐expressed protein is the functional one, these data suggest that surface expression needs to complement any whole‐cell measurements when functional implications for leukocyte adhesion are being discerned. This is underscored by the discussion above highlighting the potential role for specific N‐glycoforms in imparting functional selectivity.
In summary, the work presented highlights the complex heterogeneity that exists across endothelial cells from different vascular beds. Characteristic profiles of activation, adhesion molecule expression, and surface carbohydrate content lead to unique patterns of monocyte adhesion. Further research is required, especially in vivo, to determine how this heterogeneity contributes to leukocyte trafficking in inflammation and disease.
Sources of Funding
This work was supported by an American Heart Association predoctoral fellowship and Howard Hughes Medical Institute Med‐to‐Grad Fellowship (to D.W.S.), a T32 fellowship (to M.O.V.; T32 HL007457, Mechanisms of hypertension in cardiovascular disease) and the National Institutes of Health (HL092624; to R.P.P).
Disclosures
None.
References
- 1.Ley K, Laudanna C, Cybulsky MI, Nourshargh S. Getting to the site of inflammation: the leukocyte adhesion cascade updated. Nat Rev Immunol. 2007; 7:678-689 [DOI] [PubMed] [Google Scholar]
- 2.Schmidt S, Moser M, Sperandio M. The molecular basis of leukocyte recruitment and its deficiencies. Mol Immunol. 2013; 55:49-58 [DOI] [PubMed] [Google Scholar]
- 3.Kume T. Specification of arterial, venous, and lymphatic endothelial cells during embryonic development. Histol Histopathol. 2010; 25:637-646 [DOI] [PMC free article] [PubMed] [Google Scholar]
- 4.Aird WC. Endothelial cell heterogeneity. Cold Spring Harb Perspect Med. 2012; 2:a006429. [DOI] [PMC free article] [PubMed] [Google Scholar]
- 5.Methe H, Balcells M, Alegret Mdel C, Santacana M, Molins B, Hamik A, Jain MK, Edelman ER. Vascular bed origin dictates flow pattern regulation of endothelial adhesion molecule expression. Am J Physiol Heart Circ Physiol. 2007; 292:H2167-H2175 [DOI] [PubMed] [Google Scholar]
- 6.Hauser IA, Johnson DR, Madri JA. Differential induction of VCAM‐1 on human iliac venous and arterial endothelial cells and its role in adhesion. J Immunol. 1993; 151:5172-5185 [PubMed] [Google Scholar]
- 7.Kalogeris TJ, Kevil CG, Laroux FS, Coe LL, Phifer TJ, Alexander JS. Differential monocyte adhesion and adhesion molecule expression in venous and arterial endothelial cells. Am J Physiol. 1999; 276:L9-L19 [DOI] [PubMed] [Google Scholar]
- 8.Mason JC, Yarwood H, Sugars K, Haskard DO. Human umbilical vein and dermal microvascular endothelial cells show heterogeneity in response to pkc activation. Am J Physiol. 1997; 273:C1233-C1240 [DOI] [PubMed] [Google Scholar]
- 9.Amberger A, Maczek C, Jurgens G, Michaelis D, Schett G, Trieb K, Eberl T, Jindal S, Xu Q, Wick G. Co‐expression of ICAM‐1, VCAM‐1, ELAM‐1 and Hsp60 in human arterial and venous endothelial cells in response to cytokines and oxidized low‐density lipoproteins. Cell Stress Chaperones. 1997; 2:94-103 [DOI] [PMC free article] [PubMed] [Google Scholar]
- 10.Aird WC. Phenotypic heterogeneity of the endothelium: Ii. Representative vascular beds. Circ Res. 2007; 100:174-190 [DOI] [PubMed] [Google Scholar]
- 11.Yashima R, Abe M, Tanaka K, Ueno H, Shitara K, Takenoshita S, Sato Y. Heterogeneity of the signal transduction pathways for VEGF‐induced MAPKs activation in human vascular endothelial cells. J Cell Physiol. 2001; 188:201-210 [DOI] [PubMed] [Google Scholar]
- 12.Liu M, Kluger MS, D'Alessio A, Garcia‐Cardena G, Pober JS. Regulation of arterial‐venous differences in tumor necrosis factor responsiveness of endothelial cells by anatomic context. Am J Pathol. 2008; 172:1088-1099 [DOI] [PMC free article] [PubMed] [Google Scholar]
- 13.Beck GC, Rafat N, Brinkkoetter P, Hanusch C, Schulte J, Haak M, van Ackern K, van der Woude FJ, Yard BA. Heterogeneity in lipopolysaccharide responsiveness of endothelial cells identified by gene expression profiling: role of transcription factors. Clin Exp Immunol. 2006; 143:523-533 [DOI] [PMC free article] [PubMed] [Google Scholar]
- 14.Peng Y, Li J, Geng M. The glycan profile of endothelial cells in the present of tumor‐conditioned medium and potential roles of beta‐1,6‐GlcNAc branching on HUVEC conformation. Mol Cell Biochem. 2010; 340:143-152 [DOI] [PubMed] [Google Scholar]
- 15.Stanley P, Schachter H, Taniguchi N. In: Varki A, Cummings RD, Esko JD, Freeze HH, Stanley P, Bertozzi CR, Hart GW, Etzler ME. (eds.). N‐glycans. Essentials of glycobiology. 2009NY: Cold Spring Harbor; [PubMed] [Google Scholar]
- 16.Brockhausen I, Schachter H, Stanley P. In: Varki A, Cummings RD, Esko JD, Freeze HH, Stanley P, Bertozzi CR, Hart GW, Etzler ME. (eds.). O‐galnac glycans. Essentials of glycobiology. 2009NY: Cold Spring Harbor; [PubMed] [Google Scholar]
- 17.Yano K, Gale D, Massberg S, Cheruvu PK, Monahan‐Earley R, Morgan ES, Haig D, von Andrian UH, Dvorak AM, Aird WC. Phenotypic heterogeneity is an evolutionarily conserved feature of the endothelium. Blood. 2007; 109:613-615 [DOI] [PubMed] [Google Scholar]
- 18.Jilani SM, Murphy TJ, Thai SN, Eichmann A, Alva JA, Iruela‐Arispe ML. Selective binding of lectins to embryonic chicken vasculature. J Histochem Cytochem. 2003; 51:597-604 [DOI] [PubMed] [Google Scholar]
- 19.Chacko BK, Scott DW, Chandler RT, Patel RP. Endothelial surface N‐glycans mediate monocyte adhesion and are targets for anti‐inflammatory effects of peroxisome proliferator‐activated receptor gamma ligands. J Biol Chem. 2011; 286:38738-38747 [DOI] [PMC free article] [PubMed] [Google Scholar]
- 20.Garcia‐Vallejo JJ, Van Dijk W, Van Het Hof B, Van Die I, Engelse MA, Van Hinsbergh VW, Gringhuis SI. Activation of human endothelial cells by tumor necrosis factor‐alpha results in profound changes in the expression of glycosylation‐related genes. J Cell Physiol. 2006; 206:203-210 [DOI] [PubMed] [Google Scholar]
- 21.Renkonen J, Tynninen O, Hayry P, Paavonen T, Renkonen R. Glycosylation might provide endothelial zip codes for organ‐specific leukocyte traffic into inflammatory sites. Am J Pathol. 2002; 161:543-550 [DOI] [PMC free article] [PubMed] [Google Scholar]
- 22.Scott DW, Chen J, Chacko BK, Traylor JG, Jr, Orr AW, Patel RP. Role of endothelial N‐glycan mannose residues in monocyte recruitment during atherogenesis. Arterioscler Thromb Vasc Biol. 2012; 32:e51-e59 [DOI] [PMC free article] [PubMed] [Google Scholar]
- 23.Abe Y, Smith CW, Katkin JP, Thurmon LM, Xu X, Mendoza LH, Ballantyne CM. Endothelial alpha 2,6‐linked sialic acid inhibits vcam‐1‐dependent adhesion under flow conditions. J Immunol. 1999; 163:2867-2876 [PubMed] [Google Scholar]
- 24.Rao SP, Wang Z, Zuberi RI, Sikora L, Bahaie NS, Zuraw BL, Liu FT, Sriramarao P. Galectin‐3 functions as an adhesion molecule to support eosinophil rolling and adhesion under conditions of flow. J Immunol. 2007; 179:7800-7807 [DOI] [PubMed] [Google Scholar]
- 25.Tadokoro T, Ikekita M, Toda T, Ito H, Sato T, Nakatani R, Hamaguchi Y, Furukawa K. Involvement of Galectin‐3 with vascular cell adhesion molecule‐1 in growth regulation of mouse BALB/3T3 cells. J Biol Chem. 2009; 284:35556-35563 [DOI] [PMC free article] [PubMed] [Google Scholar]
- 26.Mun GI, Boo YC. Identification of CD44 as a senescence‐induced cell adhesion gene responsible for the enhanced monocyte recruitment to senescent endothelial cells. Am J Physiol Heart Circ Physiol. 2010; 298:H2102-H2111 [DOI] [PubMed] [Google Scholar]
- 27.Prasad Chennazhy K, Krishnan LK. Effect of passage number and matrix characteristics on differentiation of endothelial cells cultured for tissue engineering. Biomaterials. 2005; 26:5658-5667 [DOI] [PubMed] [Google Scholar]
- 28.Shi Q, Aida K, Vandeberg JL, Wang XL. Passage‐dependent changes in baboon endothelial cells–relevance to in vitro aging. DNA Cell Biol. 2004; 23:502-509 [DOI] [PMC free article] [PubMed] [Google Scholar]
- 29.Mkhikian H, Grigorian A, Li CF, Chen HL, Newton B, Zhou RW, Beeton C, Torossian S, Tatarian GG, Lee SU, Lau K, Walker E, Siminovitch KA, Chandy KG, Yu Z, Dennis JW, Demetriou M. Genetics and the environment converge to dysregulate n‐glycosylation in multiple sclerosis. Nat Commun. 2011; 2:334. [DOI] [PMC free article] [PubMed] [Google Scholar]
- 30.Li CF, Zhou RW, Mkhikian H, Newton BL, Yu Z, Demetriou M. Hypomorphic MGAT5 polymorphisms promote multiple sclerosis cooperatively with MGAT1 and interleukin‐2 and 7 receptor variants. J Neuroimmunol. 2013; 256:71-76 [DOI] [PMC free article] [PubMed] [Google Scholar]
- 31.Green RS, Stone EL, Tenno M, Lehtonen E, Farquhar MG, Marth JD. Mammalian n‐glycan branching protects against innate immune self‐recognition and inflammation in autoimmune disease pathogenesis. Immunity. 2007; 27:308-320 [DOI] [PubMed] [Google Scholar]
- 32.Chui D, Sellakumar G, Green R, Sutton‐Smith M, McQuistan T, Marek K, Morris H, Dell A, Marth J. Genetic remodeling of protein glycosylation in vivo induces autoimmune disease. Proc Natl Acad Sci USA. 2001; 98:1142-1147 [DOI] [PMC free article] [PubMed] [Google Scholar]
- 33.Ohtsubo K, Chen MZ, Olefsky JM, Marth JD. Pathway to diabetes through attenuation of pancreatic beta cell glycosylation and glucose transport. Nat Med. 2011; 17:1067-1075 [DOI] [PMC free article] [PubMed] [Google Scholar]
- 34.Fernandez‐Pisonero I, Duenas AI, Barreiro O, Montero O, Sanchez‐Madrid F, Garcia‐Rodriguez C. Lipopolysaccharide and sphingosine‐1‐phosphate cooperate to induce inflammatory molecules and leukocyte adhesion in endothelial cells. J Immunol. 2012; 189:5402-5410 [DOI] [PubMed] [Google Scholar]
- 35.Sperandio M, Gleissner CA, Ley K. Glycosylation in immune cell trafficking. Immunol Rev. 2009; 230:97-113 [DOI] [PMC free article] [PubMed] [Google Scholar]
- 36.Phillips ML, Nudelman E, Gaeta FC, Perez M, Singhal AK, Hakomori S, Paulson JC. ELAM‐1 mediates cell adhesion by recognition of a carbohydrate ligand, sialyl‐lex. Science. 1990; 250:1130-1132 [DOI] [PubMed] [Google Scholar]
- 37.Varki A. Selectin ligands: will the real ones please stand up? J Clin Invest. 1997; 99:158-162 [DOI] [PMC free article] [PubMed] [Google Scholar]
- 38.Diamond MS, Staunton DE, Marlin SD, Springer TA. Binding of the integrin Mac‐1 (CD11b/CD18) to the third immunoglobulin‐like domain of ICAM‐1 (CD54) and its regulation by glycosylation. Cell. 1991; 65:961-971 [DOI] [PubMed] [Google Scholar]
- 39.Sriramarao P, Berger E, Chambers JD, Arfors KE, Gehlsen KR. High mannose type n‐linked oligosaccharides on endothelial cells may influence beta 2 integrin mediated neutrophil adherence in vitro. J Cell Biochem. 1993; 51:360-368 [DOI] [PubMed] [Google Scholar]
- 40.Kitazume S, Imamaki R, Ogawa K, Komi Y, Futakawa S, Kojima S, Hashimoto Y, Marth JD, Paulson JC, Taniguchi N. Alpha2,6‐sialic acid on platelet endothelial cell adhesion molecule (PECAM) regulates its homophilic interactions and downstream antiapoptotic signaling. J Biol Chem. 2010; 285:6515-6521 [DOI] [PMC free article] [PubMed] [Google Scholar]
- 41.Thornton BP, Vetvicka V, Pitman M, Goldman RC, Ross GD. Analysis of the sugar specificity and molecular location of the beta‐glucan‐binding lectin site of complement receptor type 3 (CD11b/CD18). J Immunol. 1996; 156:1235-1246 [PubMed] [Google Scholar]
- 42.Park KH, Na K, Lee YS, Chang WK, Park JK, Akaike T, Kim DK. Effects of mannosylated glycopolymers on specific interaction to bone marrow hematopoietic and progenitor cells derived from murine species. J Biomed Mater Res, Part A. 2007; 82:281-287 [DOI] [PubMed] [Google Scholar]
- 43.Gbarah A, Gahmberg CG, Ofek I, Jacobi U, Sharon N. Identification of the leukocyte adhesion molecules CD11 and CD18 as receptors for type 1‐fimbriated (mannose‐specific) escherichia coli. Infect Immun. 1991; 59:4524-4530 [DOI] [PMC free article] [PubMed] [Google Scholar]
- 44.Xia Y, Borland G, Huang J, Mizukami IF, Petty HR, Todd RF, 3rd, Ross GD. Function of the lectin domain of Mac‐1/complement receptor type 3 (CD11b/CD18) in regulating neutrophil adhesion. J Immunol. 2002; 169:6417-6426 [DOI] [PubMed] [Google Scholar]
- 45.O'Brien XM, Heflin KE, Lavigne LM, Yu K, Kim M, Salomon AR, Reichner JS. Lectin site ligation of CR3 induces conformational changes and signaling. J Biol Chem. 2012; 287:3337-3348 [DOI] [PMC free article] [PubMed] [Google Scholar]
- 46.Otto VI, Schurpf T, Folkers G, Cummings RD. Sialylated complex‐type N‐glycans enhance the signaling activity of soluble intercellular adhesion molecule‐1 in mouse astrocytes. J Biol Chem. 2004; 279:35201-35209 [DOI] [PubMed] [Google Scholar]
- 47.Bloom JW, Madanat MS, Ray MK. Cell line and site specific comparative analysis of the N‐linked oligosaccharides on human ICAM‐1des454‐532 by electrospray ionization mass spectrometry. Biochemistry. 1996; 35:1856-1864 [DOI] [PubMed] [Google Scholar]
- 48.de Fougerolles AR, Diamond MS, Springer TA. Heterogenous glycosylation of ICAM‐3 and lack of interaction with Mac‐1 and p150,95. Eur J Immunol. 1995; 25:1008-1012 [DOI] [PubMed] [Google Scholar]
- 49.Weber KS, Alon R, Klickstein LB. Sialylation of ICAM‐2 on platelets impairs adhesion of leukocytes via LFA‐1 and DC‐SIGN. Inflammation. 2004; 28:177-188 [DOI] [PubMed] [Google Scholar]
- 50.Sperandio M. The expanding role of alpha2‐3 sialylation for leukocyte trafficking in vivo. Ann N Y Acad Sci. 2012; 1253:201-205 [DOI] [PubMed] [Google Scholar]


