

Abstract
In human cells the length of telomeres depends on telomerase activity. This activity and the expression of the catalytic subunit of human telomerase reverse transcriptase (hTERT) is strongly up-regulated in most human cancers. hTERT expression is regulated by different transcription factors, such as c-Myc, Mad1 and Sp1. In this study, we demonstrated that 15d-PG J2 and rosiglitazone (an endogenous and synthetic peroxisome proliferators activated receptor γ (PPARγ) ligand, respectively) inhibited hTERT expression and telomerase activity in CaCo-2 colon cancer cells. Moreover, both ligands inhibited c-Myc protein expression and its E-box DNA binding activity. Additionally, Mad1 protein expression and its E-box DNA binding activity were strongly increased by 15d-PG J2 and, to a lesser extent, by rosiglitazone. Sp1 transcription factor expression and its GC-box DNA binding activity were not affected by both PPARγ ligands. Results obtained by transient transfection of CaCo-2 cells with pmaxFP-Green-PRL plasmid constructs containing the functional hTERT core promoter (including one E-box and five GC-boxes) and its E-box deleted sequences, cloned upstream of the green fluorescent protein reporter gene, demonstrated that 15d-PG J2, and with minor effectiveness, rosiglitazone, strongly reduced hTERT core promoter activity. E-boxes for Myc/Mad/Max binding showed a higher activity than GC-boxes for Sp1. By using GW9662, an antagonist of PPARγ, we demonstrated that the effects of 15d-PG J2 are completely PPARγ independent, whereas the effects of rosiglitazone on hTERT expression seem to be partially PPARγ independent. The regulation of hTERT expression by 15d-PG J2 and rosiglitazone, through the modulation of the Myc/Max/Mad1 network, may represent a new mechanism of action of these substances in inhibiting cell proliferation.
Keywords: PPARγ ligands, h-TERT, telomerase activity, rosiglitazone, 15-deoxy-prostaglandin J2, CaCo-2 cells, Myc/Mad/Max network, Sp1, GW9662
Introduction
Synthesis and maintenance of telomeres, the ends of eukaryotic chromosomes, are mediated by a specialized enzyme, known as telomerase [1], a ribonucleoprotein complex which contains a catalytic subunit, the human telomerase reverse transcriptase (hTERT). hTERT uses a small integral RNA component (hTR) as a template for the synthesis of the dGT-rich strand of telomeres [2–4], which are specialized structures containing unique (TTAGGG)n repeats [1–5]. Because cellular DNA polymerases cannot replicate the 5′ end of the linear DNA molecule, the number of telomere repeats decreases (by 50–200 nucleotides/cell division) during aging of normal somatic cells [6]. Synthesis of new telomeric repeats by telomerase protects the chromosomes from DNA degradation, end to end fusions, rearrangements and chromosome loss [7]. Inhibition of telomerase activity leads the cells to senescence or death [8]. Although normal somatic cells do not express telomerase, immortalized cells such as tumour cells express this enzyme [9–10]. The major control mechanism of telomerase activity seems to be the regulation of hTERT expression [11], because a striking correlation exists between the presence of hTERT mRNA and telomerase activity [12]. In fact, ectopic expression of hTERT in otherwise mortal human cells induced efficient elongation of telomeres and permanent cell growth. [13]. Importantly, telomerase can cooperate with oncogenes or with inactivated tumour suppressor genes to induce tumorigenic conversion of normal human epithelial cells and fibroblasts [14]. These findings indicate that telomerase plays an important role not only in cellular aging but also in tumorigenesis.
Peroxisome proliferators activated receptor γ (PPARγ) is a member of the nuclear receptor hormone superfamily that was initially shown to be a key regulator of fat cell differentiation [15–16]. Subsequent studies showed that the antidiabetic drugs, belonging to the thiazolideneidinediones class, bind to the PPARγ receptor [17–18] and inhibit the growth of a variety of cancer cell types including those of the colon [19–20] Putative endogenous ligands for PPARγ include polyunsaturated fatty acids, 15-deoxy-prostaglandin J2 (15d-PGJ2) [19–21] and two products of oxidative metabolism of linoleic acid, 13-hydroxyoctadecadienoic acid, and 2,4-dienone 13 oxoocta decadienoic acid [22]. Although activation of PPARγ will initiate pathways leading to growth arrest, the PPARγ ligands seem to act through both a PPAR-dependent and a PPAR-independent mechanism [20–23].
In colon cancer, PPARγ ligands play a controversial role. In fact, agonists of PPARγ reduce pre-malignant intestinal lesions in rats treated with the carcinogen azoxymethane [24] but slightly increase colon polyps in Adenomatous polyposis mutant mice that are predisposed to intestinal adenomas [25] Normal colonic mucosa and colonic tumours express abundant PPARγ and genetic studies have shown that there are heterozygous loss-of-function mutations in the gene encoding PPARγ from tumours in about 10% of human colon cancer patient examined [26] emphasizing that the receptor is likely to have a tumour suppressive function in the colon. In a previous study [27], we demonstrated that PPARγ ligands rosiglitazone and 15d-PG J2 inhibited CaCo-2 colon cancer cell proliferation and reduced the expression of some growth regulatory genes, including c-myc oncogene. The c-myc network proteins (including Myc, Mad and Max proteins) are transcription factors of the basic/helic-loop-helix/leucine zipper family that are involved in the control of transcription of several genes [28]. C-Myc oncoprotein, through the binding to E-box sequences (CACGTG) in the promoter of hTERT, participates in the control of hTERT expression which was found to limit the rate of telomerase activity [29]. Besides the Myc oncoprotein, the transcriptional repressor Mad1, is able to regulate hTERT promoter-driven reporter gene activity, as it has been demonstrated in transient transfection assays [30]. Moreover, serial deletion assays of the hTERT core promoter revealed that the 5′-region containing the E-box, which binds to Myc/Max or Mad1/Max; as well as the 3′-region containing five GC-boxes, which binds to Sp1, are essential for transactivation [13]. On the basis of these results, we have suggested that the modulation of transcription factor expressions, by PPARγ ligands rosiglitazone and 15d-PG J2, may interfere with hTERT expression and telomerase activity in CaCo-2 colon cancer cells. For this reason, we analysed hTERT expression and telomerase activity in PPARγ ligand-treated CaCo-2 cells and we investigated whether the expression of Myc, Mad1 and Sp1 and their consensus sequences in the hTERT promoter are modulated by PPARγ ligands. Finally, to determine the PPARγ dependence of the PPARγ ligand effects, the treatment with PPARγ ligands has been performed in presence or in absence of GW9662, a specific PPARγ inhibitor.
Materials and methods
Cell culture and treatments
CaCo-2 cells, obtained from European Collection of Cell Cultures (ECACC) were cultured at 37°C in a humidified atmosphere of 5% CO2 -air. For all experiments, cells, from 1 to 10 passages, were used. Cells were grown in D-MEM medium supplemented with 10% fetal bovine serum (Biochrom AG Seromed, Berlin, Germany), 2 mM glutamine, 1% non-essential amino acids solution and 1% antibiotic mixture (penicillin-streptomycin) (Sigma, Milano, Italy).
Treatments with rosiglitazone (SPRI, Geneva, Switzerland) and 15d-PG J2 (Calbiochem, La Jolla, CA, USA) were performed by resuspending the drugs in DMSO. The concentration of vehicle in culture did not exceed 1%. Moreover the cultures treated with 1% DMSO alone were performed to exclude vehicle’s effects.
In the experiments performed to assess the involvement of PPARγ in the control of hTERT expression, 10 μM GW9662, a PPARγ specific inhibitor, was added to the cell cultures in presence or absence of PPARγ ligands.
Cell proliferation and viability
The effects of the PPAR ligands on cell proliferation were evaluated by the kit ‘CellTiter-Glo Luminescent Cell Viability Assay’ (Promega, Milano, Italy). This highly sensitive assay detects the luminescence released by the metabolically active cells. Quantification of luminescence was expressed as relative light units (RLUs).
For the proliferation experiments, treatments were performed by adding the drugs (at different concentrations) to the CaCo-2 cells seeded at about 4000 cells/well in a 96-well plate.
Preparation of total extracts and Western blot analysis
CaCo-2 cells were grown in flasks and seeded at the concentration of 10 × 106/flask. After 24 and 48 hrs, the cells, exposed to different substances, were harvested using a plastic policeman, washed twice in cold PBS, pH 7.4. Total extracts were prepared by lysis in a buffer containing Tris-HCl buffer, pH 7.4, 150 mM NaCl, 5 mM ethylenediaminetetraacetic acid (EDTA), 1% Nonidet P-40, 1 mM sodium orthovanadate, 1 mM phenylmethylsulphonyl fluoride and 0.05% aprotinin. Insoluble proteins were discarded by high-speed centrifugation at 4°C. Protein concentration in the supernatant was measured in triplicate using a commercially available Bio-Rad Protein assay (Bio-Rad Laboratories, Segrate, Italy). All proteins were separated by SDS-PAGE (Bio-Rad Mini Protean II system) and electroblotted to nitrocellulose membranes (GE Healthcare, Milano, Italy), by using the Biometra-Fast-Blot, a semidry blotting apparatus (400 mA, 30 min.) (Biometra, Goettingen, Germany). Membranes were blocked overnight at 4°C in Tris buffered saline containing 5% milk plus 0.5% Tween 20 and then incubated at room temperature with primary antibodies: anti-hTERT (clone Ab-2, from Calbiochem), anti-c-myc (clone 9E10, from Santa Cruz Biotechnology, CA, USA), anti-Mad1 (clone C-19, from Santa Cruz Biotechnology) anti-Sp1 (clone 1C6, from Santa Cruz Biotechnology), anti-β actin (clone AC-15, from Sigma) and horseradish peroxidase-conjugated secondary antibodies (Bio-Rad Laboratories). Detection was carried out by enhanced chemiluminescence according to the manufacturer’s protocol (Amersham-Pharmacia Biotech. Italia, Cologno Monzese, Italy). Densitometric analysis was performed by using a software program (Multi-Analyst, version 1.1, Bio-Rad Laboratories). All results were standardized using the signal obtained with β-actin.
RNA isolation and semi-quantitative RT-PCR analysis
RNA analyses were performed by a semi-quantitative PCR method as previously described [31]. Total RNA was isolated using the RNA fast Kit (Molecular System, Genenco, Milano, Italy). cDNA synthesis was performed with 4 μg of total RNA in a reaction volume of 40 μl containing 1.25 μg of random primers, l mM of dATP, dGTP, dCTP and dTTP (Invitrogen, Milano, Italy), 66 units of RNAguard (Amersham Biosciences, Cologno Monzese, Milano, Italy), 8 μl of 5× first strand buffer, 10 mM DTT, 300 units of MMLV reverse transcriptase (Invitrogen). Samples were incubated for 1 hr at 37°C and the reaction was stopped by heating for 10 min. at 95°C. PCR reactions were performed in a GeneAmp PCR System 9600 (Perkin Elmer, Monza, Milano, Italy), with 1 μl of cDNA reaction mixture in a volume of 50 μl containing 200 μM of dATP, dTTP, dGTP and dCTP, 1 μM of 5′ and 3′ primer and 1.25 units of TAQ DNA polymerase (Finnzymes, Milano, Italy). Samples were subjected to denaturation at 94°C for 30 sec., annealing (1 min. at 52°C for GAPDH primers, 30 sec. at 64°C for sp-1 and c-myc primers, 1 min. at 62°C for mad1 primers) and extension at 72°C for 45 sec., followed by a final extension at 72°C for 3 min. Negative controls contained water instead of cDNA. The primer pair sequences used for PCR amplification and the numbers of PCR cycles done are indicated as follows:
hTERT [32]– 33 cycles
(forward primer): 5′-ACGGCGACATGGAGAACAA-3′
(reverse primer): 5′-CACTGTCAACCGCAAGTTCAC-3′
amplifying a 175-bp fragment.
GAPDH–25 cycles
(forward primer): 5′-GTCGGAGTCAACGGATTTGG-3′
(reverse primer): 5′-GGGTGGAATCATATTGGAACATG-3′
amplifying a 119-bp fragment.
Telomerase activity
Proteins for telomerase assay were extracted from CaCo-2 cells of control or treated with 25 μM 15d PG J2 or 200 μM rosiglitazone, after 24 and 48 hrs from the treatments. A total of 10 × 106 cells were seeded and resuspended in 200 μl of 3-[(3-cholamidopropyl) dimethylammonio]-1-propanesulfonate (CHAPS) lysis buffer, containing 0.5% CHAPS, 1 mM MgCl2, 10% glycerol, 10 mM Tris HCl pH 7.5, 1 mM ethylene glycol-bis(2-aminoethylether)-N,N,N’,N’-tetraacetic acid (EGTA), di 0.1 mM phenylmethylsulphonyl fluoride and 5 mM β-mercaptoethanol (Sigma-Aldrich S.p.A., Milano, Italy). After 30 min. of incubation in ice, the lysates were centrifuged at 16,000 ×g for 20 min. at 4°C, and the supernatant was rapidly frozen and stored at −80°C. Telomerase activity was assayed by a modification of conventional TRAP assay [33], as described by Gelmini and colleagues [34]. This method is based on the use of a sensitive fluorochrome that selectively binds double-stranded DNA. Because telomerase, contained in a protein extract, generates double-stranded DNA by adding nucleotide to a primer and because the amount of newly synthesized DNA is proportional to telomerase activity, the measurement of DNA concentration in post-PCR samples can be considered quantitatively related to telomerase activity [34]. Each sample was assayed for telomerase activity in duplicate, starting from protein extracts of cell lines. A negative control, obtained after pre-treatment of the sample with RNase, was also assayed for each specimen. The protein concentration was measured in each extract by the Bio-Rad Protein Assay (Bio-Rad Laboratories). An aliquot of extract containing 3 μg of protein was used for each duplicate. RNase (Roche Diagnostic S.p.A., Monza, Milano, Italy) was used at 0.5 μg/assay for 30 min. at 37°C to inactivate telomerase. Each extract was assayed in 47.2 μl of reaction mixture containing 10 mM Tris-HCl pH 8.3, 50 mM KCl, 4.5 mM MgCl2, 1 mM each dNTP, 20 pmol of TAG-U primer [35] and 0.5 μM T4 gene 32 protein (Roche Diagnostic S.p.A.). After 60 min. incubation at 30°C for telomerase-mediated extension of TAG-U primer, the reaction mixture was heated at 90°C for 3 min. and then subjected to 50–60 PCR cycles of 95°C for 30 sec., 64°C for 30 sec. and 72°C for 30 sec., followed by 72°C for 10 min. after the addition of 2.8 μl of a second reaction mixture containing 20 pmol of CTA-R primer [35] and 0.3 μl of 5 U/μl of Taq Gold (Applera Italia, Monza, Italy). Ten microlitres of each PCR product was diluted with 490 μl of 10 mM Tris-HCl, 1 mM EDTA pH 7.5 (Sigma-Aldrich S.p.A.), and then 500 μl of ultrasensitive fluorescent dye PicoGreen (Molecular Probes, Inc., Leiden, The Netherlands; 1:1000 diluted stock solution) was added. Fluorescence was measured in a Luminescence Spectrometer LS 55 (Perkin Elmer) using standard wavelengths (excitation at 480 nm, emission at 520 nm). The DNA concentration was calculated for each sample on a calibration curve generated by dilutions of a control DNA (0–100 μg/ml). The final DNA concentration of each sample was obtained by subtracting the DNA amount obtained in the same specimen after RNase treatment. Telomerase activity was calculated as the mean of duplicates, expressed in term of ng DNA/μg protein and reported as percentage of control sample.
DNA binding activity of c-Myc, Mad1 and Sp1 transcription factors
The c-Myc, Mad1 and Sp1 DNA binding activity assays were performed using Trans-AM ELISA-based kits from Active Motif (Carlsbad, CA, USA) according to the manufacturer’s protocol. Briefly, cell extracts were incubated in a 96-well plate coated with an oligonucleotide containing the E-box motif (5′-CACGTG-3′), or the GC-box motif (5′-GGGCGG-3′). Activated transcription factors from extracts, specifically bound to the respective immobilized oligonucleotide, were detected using the antibody to c-Myc, Mad-1 or Sp1 followed by a secondary antibody conjugated to horseradish peroxidase in an ELISA-like assay.
Generation of hTERT-GFP (green fluorescent protein) constructs
Two constructs containing fragment of hTERT promoter (sequence available on NCBI Gene Bank, accession number AF098956) were generated by PCR, by using as template DNA from healthy blood donor leucocytes. The first fragment (284 bp) is spanning a region between −279 and +5 of hTERT promoter, it contains one E-box and five GC-boxes and it corresponds to the hTERT minimal core promoter [36]. The second one (154 bp) is spanning a region between −149 to +5 of hTERT promoter and it correspond to the E-box deleted form of the minimal core promoter.
The primers used for amplification of the 284 and 154 bp fragments were respectively:
5′-gatacgagatctgacccccgggtccg-3′ (forward) and 5′-gatacggaattcgctgcctgaaactcgcgcc-3′ (reverse); 5-gatacgagatctgccccttcaccttccagc-3′ (forward) and 5′ gatacggaattcgctgcctgaaactcgcgcc-3′ (reverse).
PCR products sequence was checked by direct sequencing (3100 Avant Genetic Analyzer Applied Biosystems, Foster City, CA, USA).
After digestion with with EcoRI and BamHI, the two fragments were cloned into the multicloning site of pmaxFP-Green-PRL (Amaxa AG, Cologne, Germany) upstream of the maxFP-Green coding sequence, an improved variant of CopGFP from copepod Pontellina Plumata [37]. Orientation and sequence of each insert were checked by automatic sequence analysis (3100 Avant Genetic Analyzer Applied Biosystems). The constructs were named Ebox-hTERT-GFP (containing the 284 bp fragment) and Ebox-less-hTERT-GFP (containing the 154 bp fragment).
The plasmids were propagated in E. coli competent Cells (Promega) employing standard procedures and purified employing the EndoFree Plasmid Maxi Kit (QIAGEN S.p.A., Milano, Italia).
Transient transfection
For transfection experiment, CaCo-2 cells were seeded into six wells and grown until 80% confluence. A total of 4 μg of Ebox-hTERT-GFP and Ebox-less-hTERT-GFP plasmid constructs were transfected using Lipofectamine 2000 reagent (Invitrogen), according to the manufacturer’s instruction.
Cells transfected with pmaxFP-Green-PRL, promoter-less, were used as negative control for each transfection. For positive control, pmaxGFP plasmid (Amaxa AG) encoding the GFP under the control of the cytomegalovirus promoter (pCMV), was used. At least three independent experiments for each condition were performed.
Promoter activity was determined by analysing GFP expression by Western blot.
Statistics
Statistical significance of data were checked by ANOVA and paired Student’s t-test. The corresponding probability (P) value <0.05 was considered to be significant.
Results
PPARγ ligand effects on hTERT expression and telomerase activity
hTERT expressions, evaluated both as mRNA and protein contents in CaCo-2 cells treated with different concentrations of 15d-PG J2, are shown in Fig. 1. 15d-PG J2 caused a down-regulation of hTERT expression starting from 25 μM concentrations in a dose-dependent way. The decrease of hTERT expression was evident 24 hrs after the treatment and became even more pronounced after 48 hrs (Fig. 1A and B). The growth of CaCo-2 cells was almost completely blocked for 24 hrs with all the concentrations used (Fig. 1C). However, a loss of viable cells was observed after 48 hrs from the treatments with the highest 15d-PG J2 concentrations. For this reason, the concentrations of 25 μM 15d-PG J2, which inhibited hTERT expression, but did not show any cytotoxic effect, was used for the following experiments.
Fig 1.
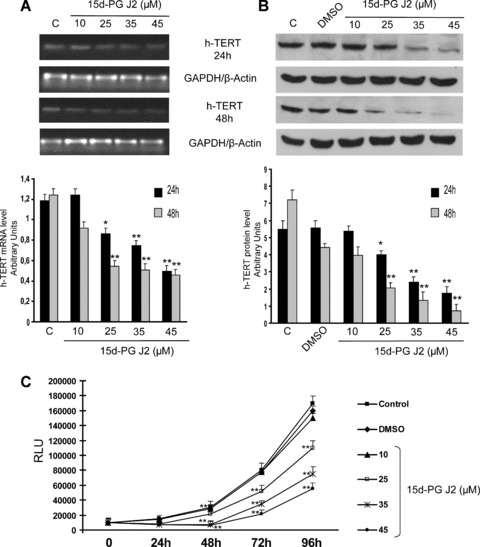
(A) hTERT mRNA levels determined by RT-PCR in CaCo-2 cells treated with different doses of 15d-PG J2 (from 10 to 45 μM) and collected at the indicated times after the treatment. The graphic represents the relative quantification of RT-PCR products performed by densitometric scanning. Data were normalized by using the GAPDH signal and expressed as arbitrary densitometric units. Values represent the means ± S.D. of three independent experiments. Variance analysis: **P < 0.01 versus control. (B) Western blot analysis of hTERT proteins in CaCo-2 cells treated with different doses of 15d-PG J2 (from 10 to 45 μM) and collected at the indicated times after the treatment. Equal protein loading was confirmed by exposure of the membranes to the anti-β-actin antibody. The graphic represents the relative quantification of protein products performed by densitometric scanning. Data were normalized by using the β-actin signal and expressed as arbitrary densitometric units. Values represent the means ± S.D. of three independent experiments. Variance analysis: **P < 0.01 versus control. (C) Growth of CaCo-2 cells treated with 15d-PG J2 at the indicated concentrations (from 10 to 45 μM), collected at the indicated times. Cell proliferation was detected by measuring the luminescence released by the metabolically active cells. The values, expressed in RLUs are the means ± S.D. of three separate experiments. Variance analysis: *P < 0.05, **P < 0.01 versus control.
To assess whether the inhibition of hTERT expression was evident after treatment with a synthetic PPARγ agonist, CaCo-2 cells were exposed to increasing doses of rosiglitazone. Rosiglitazone induced a decrease of hTERT mRNA and protein expression at 24 and 48 hrs, starting from 200 μM concentration (Fig. 2A, B). Cell growth was significantly reduced after treatment with 200 and 250 μM rosiglitazone (Fig. 2C). The concentration of 200 μM rosiglitazone, which was able to reduce cell proliferation and hTERT expression without any cytotoxic effect, was selected for the further experiments.
Fig 2.
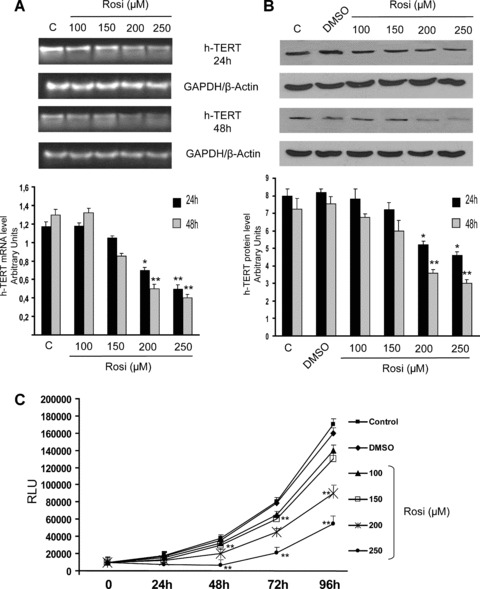
(A) hTERT mRNA levels determined by RT-PCR in CaCo-2 cells treated with different concentrations of rosiglitazone (Rosi) (from 100 to 250 μM), collected at the indicated times after the treatment. The graphic represents the relative quantification of RT-PCR products performed by densitometric scanning. Data were normalized by using the GAPDH signal and expressed as arbitrary densitometric units. Values represent the means ± S.D. of three independent experiments. Variance analysis: **P < 0.01 versus control. (B) Western blot analysis of hTERT proteins in CaCo-2 cells, treated with different doses of rosiglitazone (Rosi), collected at the indicated times after the treatment. Equal protein loading was confirmed by exposure of the membranes to the anti-β-actin antibody. The graphic represents relative quantification of RT-PCR products performed by densitometric scanning. Data were normalized by using the β-actin signal and expressed as arbitrary densitometric units. Values represent the means ± S.D. of three independent experiments. Variance analysis: **P < 0.01 versus control. (C) Growth of CaCo-2 cells, treated with different doses of rosiglitazone (Rosi) (from 100 to 250 μM), collected at the indicated times. Cell proliferation was detected by measuring the luminescence released by the metabolically active cells. The values, expressed in RLUs are the means ± S.D. of three separate experiments. Variance analysis: *P < 0.05, **P < 0.01 versus control.
Telomerase activity was assayed in CaCo-2 cells, treated with 25 μM 15d-PG J2 and 200 μM rosiglitazone at 24 and 48 hrs from the treatments. Both substances inhibited telomerase activity (Fig. 3). In 15d-PG J2 –treated cells, the telomerase activity was inhibited by 40%, after 24 hrs and this inhibition became more evident after 48 hrs (65%). Rosiglitazone inhibited telomerase activity by 35% after 24 hrs and by 55% after 48 hrs. With respect to cells treated with rosiglitazone, the inhibition of telomerase activity was stronger in 15d-PG J2-treated cells, which correlates with the degree of inhibition of hTERT expression.
Fig 3.
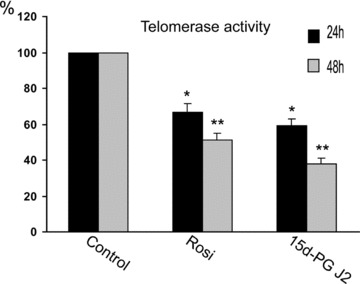
Telomerase activity. The activity was evaluated at the indicated times in CaCo-2 cells after treatment with PPARγ ligands (200 μM Rosiglitazone, Rosi, and 25 μM 15d-PG J2). The activity was expressed as ng of DNA produced/μg of protein and reported as the percentage of control (C) values.
Effects of PPARγ ligands on hTERT transcription factor expressions and binding to DNA
To assess whether the inhibition of hTERT expression may be related to the modification of the c-Myc, Mad1 and Sp1 protein content, we analysed these protein expressions 24 and 48 hrs after the treatments (Fig. 4). We confirmed the inhibition of c-Myc expression (Fig. 4A) determined by both substances, as previously reported [27], and observed a strong increase of Mad1 expression at 24 and 48 hrs after treatment with 25 μM 15d-PG J2 and only at 48 hrs after treatment with 200 μM rosiglitazone (Fig. 4B). Sp1 transcription factor expression did not change after treatments with both 15d PG J2 and rosiglitazone (Fig. 4C).
Fig 4.
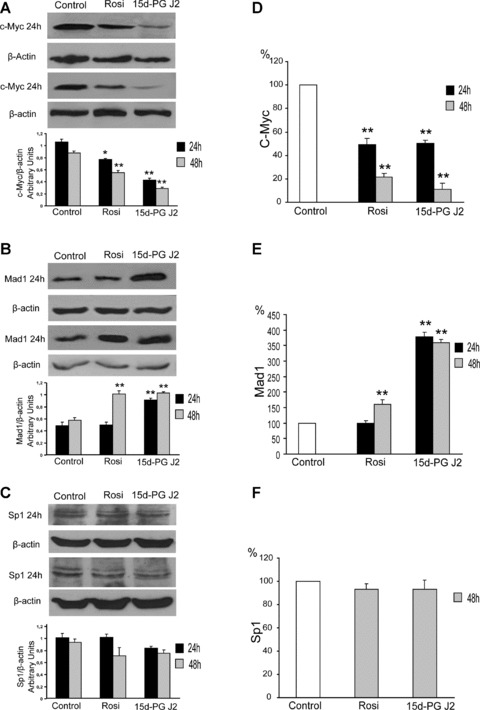
Left side: Western blot analysis of c-Myc protein (A), Mad1 protein (B) and Sp1 protein (C). CaCo-2 cells were treated with 25 μM 15d-PG J2 or 200 μM rosiglitazone (Rosi) and collected 24 or 48 hrs after the treatment. Equal protein loading was confirmed by exposure of the membranes to the anti-β-actin antibody. Graphics indicate the quantification of proteins performed by densitometric scanning. Data were normalized by using the β-actin signal and expressed as arbitrary densitometric units. Values represent the means ± S.D. of three independent experiments. Variance analysis: **P < 0.01 versus control. Right side: DNA binding activity of c-Myc (D), Mad1 (E) and Sp1 (F) transcription factors. Nuclear extracts were obtained from control and CaCo-2 cells treated with 25 μM 15d-PG J2 or 200 μM rosiglitazone (Rosi) and collected 24 and 48 hrs after the treatment. c-Myc, Mad1 and Sp1 binding was analysed by using an ELISA-based kit (Trans-AM; Active Motif). Protein/oligonucleotide binding (5 μg of nuclear proteins) was determined by measuring the absorbance at 450 nm. Results are expressed as a percentage of the control values and are indicated as the means ± S.D. of three independent experiments.
The DNA binding of c-Myc, Mad1 and Sp1 followed the trend of protein expressions. In fact, Myc binding decreased starting from 24 hrs after both 15d- PG J2 and rosiglitazone treatments (Fig. 4D); Mad1 binding strongly increased in 15d-PG J2-treated cells at 24 and 48 hrs, whereas, in rosiglitazone-treated cells, the increase of Mad1 binding was significant only at 48 hrs, and this increase was less pronounced than that observed after 15d-PG J2 treatment (Fig. 4E). Finally, Sp1 binding did not change after both 15d-PG J2 and rosiglitazone treatments (Fig. 4F).
Effects of PPARγ ligands in controlling hTERT promoter activity
To determine whether the modulation of Myc and Mad1 expression and binding to DNA could induce modification of hTERT promoter activity, transfection experiments, with two hTERT promoter sequences, containing (Ebox-hTERT-GFP) or not containing (Ebox-less-hTERT-GFP) the E-box binding site, were performed (Fig. 5). The Ebox-hTERT-GFP promoter activity was strongly reduced in cells treated for 48 hrs with 15d-PG J2, whereas the reduction observed in rosiglitazone-treated cells, even if significant, was less pronounced. The Ebox-less-hTERT-GFP promoter activity showed the lowest activity, which was almost absent in 15d-PG J2 and rosiglitazone treated cells. Moreover, we demonstrated that the treatment with both PPARγ ligands did not alter the transfection efficiently, measured as expression of GFP under the control of the pCMV (right side of the Fig. 5).
Fig 5.
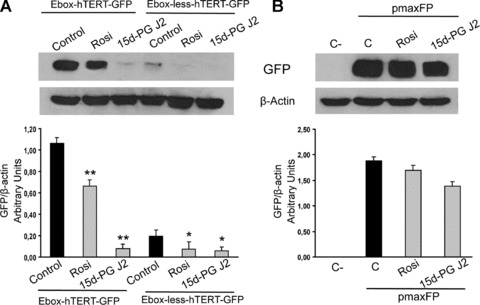
(A) Promoter activity determined by Western blot analysis of GFP protein levels in cells transfected with two different constructs, Ebox-hTERT-GFP and Ebox-less-hTERT-GFP. Transfected cells were non-treated (C) or treated with 200 μM rosiglitazone (Rosi) or 25 μM 15d-PG J2 and collected after 48 hrs from the treatment. Equal protein loading was confirmed by exposure of the membranes to the anti-β-actin antibody. The graphic represents relative quantification of protein products performed by densitometric scanning. Data were normalized by using the β-actin signal and expressed as arbitrary densitometric units. Values represent the means ± S.D. of three independent experiments. Variance analysis: **P < 0.01 versus control. (B) Evaluation of the transfection efficacy by Western blot analysis of GFP protein levels in cells transfected with the empty vector (C-) and with pmaxGFP plasmid containing the strong pCMV. Cells were treated with 200 μM rosiglitazone (Rosi) or 25 μM 15d-PG J2 and collected 48 hrs from the treatment. Equal protein loading was confirmed by exposure of the membranes to the anti-β-actin antibody. The graphic represents the relative quantification of protein products performed by densitometric scanning. Data are normalized by using the β-actin signal and expressed as arbitrary densitometric units. Values represent the means ± S.D. of three independent experiments. Variance analysis: **P < 0.01 versus control.
Analysis of PPAR-dependence of the effects displayed by PPARγ ligands
Because several effects are displayed by PPARγ ligands in a PPAR-independent way, we treated CaCo-2 cells with GW9662, a well-known antagonist of PPARγ (Fig. 6). The inhibition of hTERT expression was not reverted by GW9662 in 15d-PG J2-treated cells (Fig. 6A, left side). On the contrary, GW9662 did partially revert the inhibition of hTERT expression caused by 200 μM rosiglitazone (Fig. 6A, right side). The inhibition of c-myc expression was not reverted by GW9662 in 15d-PG J2 treated cells (Fig. 6B, left side), whereas it was partially reverted in rosiglitazone-treated cells (Fig. 6B, right side). Finally, GW9662 did not interfere with the increase of Mad1 protein observed after the treatment with both 15d-PG J2 and rosiglitazone (Fig. 6C, left and right side, respectively).
Fig 6.

(A) Western blot analysis of hTERT proteins. CaCo-2 cells were treated with 25 μM 15-deoxy prostaglandin J2 (15d-PG J2) alone or in presence of GW9662 (15d-PJ J2 + GW) (left side) or with 200 μM rosiglitazone alone (Rosi) or in presence of GW9662 (Rosi + GW) (right side). (B) Western blot analysis of c-Myc proteins. CaCo-2 cells were treated with 25 μM 15-deoxy prostaglandin J2 (15d-PG J2) alone or in presence of GW9662 (15d-PJ J2 + GW) (left side) or with 200 μM rosiglitazone alone (Rosi) or in presence of GW9662 (Rosi + GW) (right side). (C) Western blot analysis of Mad1 proteins. CaCo-2 cells were treated with 25 μM 15-deoxy prostaglandin J2 (15d-PG J2) alone or in presence of GW9662 (15d-PJ J2 + GW) (left side) or with 200 μM rosiglitazone alone (Rosi) or in presence of GW9662 (Rosi + GW) (right side). Cells were collected 48 hrs after the treatment. Equal protein loading was confirmed by exposure of the membranes to the anti-β-actin antibody. Graphics represent the relative quantification of protein products performed by densitometric scanning. Data were normalized by using the β-actin signal and expressed as arbitrary densitometric units. Values represent the means ± S.D. of three independent experiments. Variance analysis: **P < 0.01 versus control.
Discussion
In this work we demonstrated that PPARγ ligands, 15d-PG J2 and rosiglitazone, inhibit hTERT expression and telomerase activity in colon cancer cells. It has been demonstrated that PPARγ ligands can affect telomerase activity and hTERT expression in other cellular models. In fact, rosiglitazone and pioglitazone inhibited telomerase activity in smooth muscle cells [38], pioglitazone caused a dose-dependent decrease of hTERT mRNA in normal human peripheral blood mononuclear cells [38] and 15d-PG J2 induced a dose-dependent decrease of hTERT mRNA and protein content in the MIAPaCa-2 pancreatic cancer cells [40]. These observations suggest that PPARγ ligands may act as effective hTERT inhibitors not only in colon cancer cells but in other tumours also. In colon cancer, telomerase activity and hTERT expression play an important role in the development of disease. In fact, it has been recently reported that hTERT and survivin are the best risk predictors for long-term, metachronous colorectal cancer development in patients with sporadic colorectal adenomas [41]. Moreover, it has been reported that telomerase activity is significantly high in about 80% of cancers and correlates well with the degree of malignancy [42]. Thus, the discovery of new drugs, that are able to inhibit this activity, may help the adjustment of new therapeutic trials. However, our results indicate that the doses of rosiglitazone, able to inhibit cell proliferation and telomerase activity are rather high. Although the epithelial colon cells may be exposed to high doses of drugs before and during its absorption, this datum suggests a prudent evaluation of the therapeutic use of rosiglitazone in colon cancer and further studies, by utilizing other synthetic PPARγ ligands, are needed. Indeed, within each cancer type, individual cell lines were found to respond differently to distinct PPARγ ligands. For instance, Eucker et al.[43] demonstrated that very different doses of synthetic PPARγ ligands are needed to inhibit the proliferation of diverse mantle cell lymphoma cell lines and Allred and Kilgor [44] observed a selective modulation of PPARγ, within a single cell line, by different ligands.
The mechanisms by which PPARγ ligands affect hTERT expression, and consequently telomerase activity, have not yet been elucidated. It has been reported that the activation of cholesterol–activated Receptor Ck down-regulated the transcription of c-myc, hTERT and PPARγ in peripheral blood mononuclear cells [39]. Moreover, the treatment with pioglitazone, a PPARγ agonist, reduced the mRNA level of c-myc and hTERT, suggesting that the inhibition of c-myc expression can play an important role in the inhibition of hTERT expression.
We demonstrated that the inhibition of hTERT expression in CaCo-2 cells, strictly depends on the modulation of the Myc/Mad/Max network. On one hand, the inhibition of c-Myc protein expression by PPARγ ligands has been reported to occur in diverse cancer cells [27, 38, 44], while, on the other, a small number of papers report the modulation of Mad1 expression after drug treatments [46, 47], although the Mad1 protein was fundamental for hTERT regulation [48]. In this paper we reported a great increase of Mad1 expression, induced by 15d-PG J2 and, to a lesser extent, by rosiglitazone. In a number of tissues, Mad1 expression was too low to be analysed; however, in the particular case of colon cancers, as many as 91% of the tumours showed decreased Mad1 mRNA levels. In the combined 29 samples of tumours from colon, lung, stomach and rectum, Mad1 expression was lost or down-regulated in 69% of the samples as compared with normal tissue from the same patient [46]. Of note, several members of the Mad family have been discussed as tumour suppressors [49–50]. On the basis of our observations, it has been suggested that the repression of the hTERT promoter by Mad1 limits the replicative potential of a cell and thereby contributes to the tumour suppressor phenotype [46]. The expression of c-Myc and Mad1 correlated well with the binding to DNA of these two transcription factors. Moreover, the transient transfection experiments show that, in CaCo-2 cells, the inhibition of hTERT expression by PPARγ ligands mainly involves the E-box binding site, spanning a region between −187 and −182 of the hTERT promoter. These experiments also demonstrate that Sp1, which is not affected by PPARγ ligands, plays a secondary role in the control of hTERT expression in CaCo-2 cells. Thus, we postulate that the down-regulation of c-Myc and the up-regulation of Mad1 by PPARγ ligands, inhibit the hTERT promoter activity, hTERT expression and, consequently, telomerase activity.
The experiments, performed in the presence of GW9662, demonstrated that this PPARγ antagonist partially reverted the inhibitory effect displayed by rosiglitazone on the c-myc and hTERT expression. On the contrary, the inhibition of hTERT and c-Myc expression by 25 μM 15d-PG J2 were not affected by GW9662, demonstrating it to be a PPARγ-independent event. It has been demonstrated that several effects, displayed by PPARγ ligands, are independent on their binding with PPAR [51]. In some cases, the PPAR dependence of PPARγ ligand effects is related to the dose of ligand employed [52]. Considering the high dose of rosiglitazone used [53], although its inhibitory effects are partially reverted by GW9662, we suggest that these inhibitory effects may be due to PPARγ-independent effects.
It is noteworthy that the both ligands increase Mad1 expression independently by PPARγ activation. This result indicates that other signal pathways could be involved. Recently, Mad1 promoter sequences have been cloned [54]. This study provides a first analysis of the Mad1 promoter and suggests that STAT3 functions as a C/EBPβ cofactor in the regulation of the Mad1 gene. We can postulate that 15d-PG J2 and rosiglitazone interfere with the signal transduction pathways that control the expression of Mad1.
In conclusion, our finding demonstrated a dose-dependent regulation of hTERT expression by 15d-PG J2 and rosiglitazone through the modulation of the Myc/Max/Mad1 network suggesting a new mechanism of action of these substances in inhibiting colon cancer cell proliferation.
Acknowledgments
This work was supported by grants from Regione Piemonte (grant 2006), Università degli Studi di Torino (ex 60%).
References
- 1.Greider CW. Telomere length regulation. Annu Rev Biochem. 1996;65:337–65. doi: 10.1146/annurev.bi.65.070196.002005. [DOI] [PubMed] [Google Scholar]
- 2.Greider CW, Blackburn EH. Identification of a specific telomere terminal transferase activity in Tetrahymena extracts. Cell. 1985;43:405–13. doi: 10.1016/0092-8674(85)90170-9. [DOI] [PubMed] [Google Scholar]
- 3.Greider CW, Blackburn EH. A telomeric sequence in the RNA of Tetrahymena telomerase required for telomere repeat synthesis. Nature. 1989;337:331–7. doi: 10.1038/337331a0. [DOI] [PubMed] [Google Scholar]
- 4.Nakamura TM, Cech TR. Reversing time: origin of telomerase. Cell. 1998;92:587–90. doi: 10.1016/s0092-8674(00)81123-x. [DOI] [PubMed] [Google Scholar]
- 5.Moyzis RK, Buckingham JM, Cram LS, et al. A highly conserved repetitive DNA sequence, (TTAGGG)n, present at the telomeres of human chromosomes. Proc Natl Acad Sci USA. 1988;85:6622–6. doi: 10.1073/pnas.85.18.6622. [DOI] [PMC free article] [PubMed] [Google Scholar]
- 6.Watson JD. Origin of concatemeric T7 DNA. Nat New Biol. 1972;239:197–201. doi: 10.1038/newbio239197a0. [DOI] [PubMed] [Google Scholar]
- 7.Cech TR. Beginning to understand the end of the chromosome. Cell. 2004;116:273–9. doi: 10.1016/s0092-8674(04)00038-8. [DOI] [PubMed] [Google Scholar]
- 8.Herbert B, Pitts AE, Baker SI, et al. Inhibition of human telomerase in immortal human cells leads to progressive telomere shortening and cell death. Proc Natl Acad Sci USA. 1999;96:14276–81. doi: 10.1073/pnas.96.25.14276. [DOI] [PMC free article] [PubMed] [Google Scholar]
- 9.Kim NW, Piatyszek MA, Prowse KR, et al. Specific association of human telomerase activity with immortal cells and cancer. Science. 1994;266:2011–15. doi: 10.1126/science.7605428. [DOI] [PubMed] [Google Scholar]
- 10.Shay JW, Bacchetti SA. Survey of telomerase activity in human cancer. Eur J Cancer. 1997;33:787–91. doi: 10.1016/S0959-8049(97)00062-2. [DOI] [PubMed] [Google Scholar]
- 11.Kyo S, Inoue M. How to inhibit telomerase activity for cancer therapy. Curr Med Chem Anti-Cancer Agents. 2002;2:613–26. doi: 10.2174/1568011023353796. [DOI] [PubMed] [Google Scholar]
- 12.Ducrest AL, Amacker M, Mathieu YD, et al. Regulation of human telomerase activity: repression by normal chromosome 3 abolishes nuclear telomerase reverse transcriptase transcripts but does not affect c-Myc activity. Cancer Res. 2001;61:7594–602. [PubMed] [Google Scholar]
- 13.Horikawa I, Barrett JC. Transcriptional regulation of the telomerase hTERT gene as a target for cellular and viral oncogenic mechanisms. Carcinogenesis. 2003;24:1167–76. doi: 10.1093/carcin/bgg085. [DOI] [PubMed] [Google Scholar]
- 14.Hahn WC, Stewart SA, Brooks MW, et al. Inhibition of telomerase limits the growth of human cancer cells. Nat Med. 1999;5:1164–70. doi: 10.1038/13495. [DOI] [PubMed] [Google Scholar]
- 15.Lowell BB. PPARγ: an essential regulator of adipogenesis and modulator of fat cell function. Cell. 1999;9:239–42. doi: 10.1016/s0092-8674(00)81654-2. [DOI] [PubMed] [Google Scholar]
- 16.Tontonoz P, Hu E, Spiegelman BM. Stimulation of adipogenesis in fibroblasts by PPARγ2, a lipid-activated transcriprion factor. Cell. 1994;79:1147–56. doi: 10.1016/0092-8674(94)90006-x. [DOI] [PubMed] [Google Scholar]
- 17.Lehmann JM, Moore LB, Smith-Oliver TA, et al. An antidiabetic thiazolidinedione is a high affinity ligand for peroxisome proliferator-activated receptor gamma (PPAR gamma) J Biol Chem. 1995;270:12953–6. doi: 10.1074/jbc.270.22.12953. [DOI] [PubMed] [Google Scholar]
- 18.Forman BM, Tontonoz P, Chen J, et al. 15-Deoxy-delta 12, 14-prostaglandin J2 is a ligand for the adipocyte determination factor PPAR gamma. Cell. 1995;83:803–12. doi: 10.1016/0092-8674(95)90193-0. [DOI] [PubMed] [Google Scholar]
- 19.Gupta RA, Dubois RN. Controversy: PPARgamma as a target for treatment of colorectal cancer. Am J Physiol Gastrointest Liver Physiol. 2002;283:266–9. doi: 10.1152/ajpgi.00486.2001. [DOI] [PubMed] [Google Scholar]
- 20.Sporn MB, Suh N, Mangelsdorf DJ. Prospects for prevention and treatment of cancer with selective PPARgamma modulators (SPARMs) Trends Mol Med. 2001;7:395–400. doi: 10.1016/s1471-4914(01)02100-1. [DOI] [PubMed] [Google Scholar]
- 21.Kliewer SA, Lenhard JM, Willson TM, et al. A prostaglandin J2 metabolite binds peroxisome proliferator-activated receptor gamma and promotes adipocyte differentiation. Cell. 1995;83:813–9. doi: 10.1016/0092-8674(95)90194-9. [DOI] [PubMed] [Google Scholar]
- 22.Kliewer SA, Sundseth SS, Jones SA, et al. Fatty acids and eicosanoids regulate gene expression through direct interactions with peroxisome proliferator-activated receptors alpha and gamma. Proc Natl Acad Sci USA. 1997;94:4318–23. doi: 10.1073/pnas.94.9.4318. [DOI] [PMC free article] [PubMed] [Google Scholar]
- 23.Pandhare J, Cooper SK, Phang JM. Proline oxidase, a proapoptotic gene, is induced by troglitazone: evidence for both peroxisome proliferator-activated receptor gamma-dependent and -independent mechanisms. J Biol Chem. 2006;281:2044–52. doi: 10.1074/jbc.M507867200. [DOI] [PubMed] [Google Scholar]
- 24.Tanaka T, Kohno H, Yoshitani S, et al. Ligands for peroxisome proliferator-activated receptors alpha and gamma inhibit chemically induced colitis and formation of aberrant crypt foci in rats. Cancer Res. 2001;61:2424–8. [PubMed] [Google Scholar]
- 25.Lefebvre AM, Chen I, Desreumaux P, et al. Activation of the peroxisome proliferator-activated receptor gamma promotes the development of colon tumors in C57BL/6J-APCMin/+ mice. Nat Med. 1998;4:1053–7. doi: 10.1038/2036. [DOI] [PubMed] [Google Scholar]
- 26.Sarraf P, Mueller E, Jones D, et al. Differentiation and reversal of malignant changes in colon cancer through PPARgamma. Nat Med. 1998;4:1046–52. doi: 10.1038/2030. [DOI] [PubMed] [Google Scholar]
- 27.Cerbone A, Toaldo C, Laurora S, et al. 4-Hydroxynonenal and PPARgamma ligands affect proliferation, differentiation, and apoptosis in colon cancer cells. Free Radic Biol Med. 2007;42:1661–70. doi: 10.1016/j.freeradbiomed.2007.02.009. [DOI] [PubMed] [Google Scholar]
- 28.Allshire RC, Dempster M, Hastie ND. Human telomeres contain at least three types of G-rich repeat distributed non-randomly. Nucleic Acids Res. 1989;17:4611–27. doi: 10.1093/nar/17.12.4611. [DOI] [PMC free article] [PubMed] [Google Scholar]
- 29.Ahmed A, Tollefsbol TO. Telomerase, telomerase inhibition, and cancer. J Anti Aging Med. 2003;6:315–25. doi: 10.1089/109454503323028911. [DOI] [PubMed] [Google Scholar]
- 30.Günes C, Lichtsteiner S, Vasserot AP, et al. Expression of the hTERT gene is regulated at the level of transcriptional initiation and repressed by Mad1. Cancer Res. 2000;60:2116–21. [PubMed] [Google Scholar]
- 31.Pizzimenti S, Barrera G, Dianzani MU, et al. Inhibition of D1, D2, and A-cyclin expression in HL-60 cells by the lipid peroxidation product 4-hydroxynonenal. Free Radic Biol Med. 1999;26:1578–86. doi: 10.1016/s0891-5849(99)00022-2. [DOI] [PubMed] [Google Scholar]
- 32.Yajima T, Yagihashi A, Kameshima H, et al. Establishment of quantitative reverse transcription-polymerase chain reaction assays for human telomerase-associated genes. Clin Chim Acta. 2000;290:117–27. doi: 10.1016/s0009-8981(99)00188-6. [DOI] [PubMed] [Google Scholar]
- 33.Kim W, Piatyszek MA, Prowse KR, et al. Specific association of human telomerase activity with immortal cells and cancer. Science. 1994;266:2011–5. doi: 10.1126/science.7605428. [DOI] [PubMed] [Google Scholar]
- 34.Gelmini S, Caldini A, Becherini L, et al. Rapid, quantitative nonisotopic assay for telomerase activity in human tumors. Clin Chem. 1998;44:2133–8. [PubMed] [Google Scholar]
- 35.Tatematsu K, Nakayama J, Danbara M, et al. A novel quantitative ‘stretch PCR assay’, that detects a dramatic increase in telomerase activity during the progression of myeloid leukemias. Oncogene. 1996;13:2265–74. [PubMed] [Google Scholar]
- 36.Horikawa I, Cable PL, Afshari C, et al. Cloning and characterization of the promoter region of human telomerase reverse transcriptase gene. Cancer Res. 1999;59:826–30. [PubMed] [Google Scholar]
- 37.Shagin DA, Barsova EV, Yanushevich YG, et al. GFP-like proteins as ubiquitous metazoan superfamily: evolution of functional features and structural complexity. Mol Biol Evol. 2004;21:841–50. doi: 10.1093/molbev/msh079. [DOI] [PubMed] [Google Scholar]
- 38.Ogawa D, Nomiyama T, Nakamachi T, et al. Activation of peroxisome proliferator-activated receptor gamma suppresses telomerase activity in vascular smooth muscle cells. Circ Res. 2006;98:50–9. doi: 10.1161/01.RES.0000218271.93076.c3. [DOI] [PubMed] [Google Scholar]
- 39.Sikand K, Kaul D, Varma N. Receptor Ck-dependent signaling regulates hTERT gene transcription. BMC Cell Biol. 2006;7:2–22. doi: 10.1186/1471-2121-7-2. [DOI] [PMC free article] [PubMed] [Google Scholar]
- 40.Kondoh K, Tsuji N, Asanuma K, et al. Inhibition of estrogen receptor beta-mediated human telomerase reverse transcriptase gene transcription via the suppression of mitogen-activated protein kinase signaling plays an important role in 15-deoxy-Delta(12,14)-prostaglandin J(2)-induced apoptosis in cancer cells. Exp Cell Res. 2007;313:3486–96. doi: 10.1016/j.yexcr.2007.06.028. [DOI] [PubMed] [Google Scholar]
- 41.Soreide K, Gudlaugsson E, Skaland I, et al. Metachronous cancer development in patients with sporadic colorectal adenomas-multivariate risk model with independent and combined value of hTERT and survivin. Int J Colorectal Dis. 2008;230:389–400. doi: 10.1007/s00384-007-0424-6. [DOI] [PubMed] [Google Scholar]
- 42.Janknecht R. On the road to immortality: hTERT upregulation in cancer cells. FEBS Lett. 2004;564:9–13. doi: 10.1016/S0014-5793(04)00356-4. [DOI] [PubMed] [Google Scholar]
- 43.Eucker J, Sterz J, Krebbel H, et al. Peroxisome proliferator-activated receptor ligands inhibit proliferation and induce apoptosis in mantle cell limphoma. Anti-cancer Drugs. 2009;17:763–9. doi: 10.1097/01.cad.0000217432.71741.da. [DOI] [PubMed] [Google Scholar]
- 44.Allred CD, Kilgore MW. Selective activation of PPARgamma in breast, colon, and lung cancer cell lines. Mol Cell Endocrinol. 2005;235:21–9. doi: 10.1016/j.mce.2005.02.003. [DOI] [PubMed] [Google Scholar]
- 45.Muzio G, Maggiora M, Trombetta A, et al. Mechanisms involved in growth inhibition induced by clofibrate in hepatoma cells. Toxicology. 2003;187:149–59. doi: 10.1016/s0300-483x(03)00055-6. [DOI] [PubMed] [Google Scholar]
- 46.Günes C, Lichtsteiner S, Vasserot AP, et al. Expression of the hTERT gene is regulated at the level of transcriptional initiation and repressed by Mad1. Cancer Res. 2000;60:2116–21. [PubMed] [Google Scholar]
- 47.Chen HJ, Yu RA, He LF, et al. Inhibitory effects of selenium on telomerase activity and hTERT expression in cadmium-transformed 16HBE cells. Biomed Environ Sci. 2007;20:307–12. [PubMed] [Google Scholar]
- 48.Lin SY, Elledge SJ. Multiple tumor suppressor pathways negatively regulate telomerase. Cell. 2003;113:881–9. doi: 10.1016/s0092-8674(03)00430-6. [DOI] [PubMed] [Google Scholar]
- 49.Henriksson M, Luscher B. Proteins of the Myc network: essential regulators of cell growth and differentiation. Adv Cancer Res. 1996;68:109–82. doi: 10.1016/s0065-230x(08)60353-x. [DOI] [PubMed] [Google Scholar]
- 50.Cerni C, Skrzypek B, Popov N, et al. Repression of in vivo growth of Myc/Ras transformed tumor cells by Mad1. Oncogene. 2002;21:447–59. doi: 10.1038/sj.onc.1205107. [DOI] [PubMed] [Google Scholar]
- 51.Barrera G, Toaldo C, Pizzimenti S, et al. The role of PPAR ligands in controlling growth-related gene expression and their interaction with lipoperoxidation products. PPAR Res. 2008 doi: 10.1155/2008/524671. Doi: 10.1155/2008/524671. [DOI] [PMC free article] [PubMed] [Google Scholar]
- 52.Berry EB, Keelan JA, Helliwell RJ, et al. Nanomolar and micromolar effects of 15-deoxy-delta 12,14-prostaglandin J2 on amnion-derived WISH epithelial cells: differential roles of peroxisome proliferator-activated receptors gamma and delta and nuclear factor kappa B. Mol Pharmacol. 2005;68:169–78. doi: 10.1124/mol.104.009449. [DOI] [PubMed] [Google Scholar]
- 53.Panigrahy D, Shen LQ, Kieran MW, et al. Therapeutic potential of thiazolidinediones as anticancer agents. Expert Opin Investig Drugs. 2003;12:1925–37. doi: 10.1517/13543784.12.12.1925. [DOI] [PubMed] [Google Scholar]
- 54.Jiang K, Hein N, Eckert K, et al. Regulation of the MAD1 promoter by G-CSF. Nucleic Acids Res. 2008;36:1517–31. doi: 10.1093/nar/gkn002. [DOI] [PMC free article] [PubMed] [Google Scholar]