

Abstract
The diagnosis of multiple sclerosis (MS) is challenging for the lack of a specific diagnostic test. Recent researches in quantitative proteomics, however, offer new opportunities for biomarker discovery and the study of disease pathogenesis. To find more potential protein biomarkers, we used two technologies, 2-dimensional fluorescence difference in-gel electrophoresis (2D-DIGE), followed by matrix-assisted laser desorption ionization time-of-flight mass spectrometry (MALDI-TOF MS) and ultra-performance liquid chromato-graph coupled with quadrupole time-of-flight mass spectrometry (UPLC/Q-TOF MS), to quantitatively analyse differential proteomic expression in the cerebrospinal fluid (CSF) between patients with MS (the experiment group) and patients with other neurological diseases (ONDs; the control group). Analysis by the former technology identified more than 43 different protein spots (39 proteins), of which 17 spots (13 proteins) showed more than 1.5-fold difference in abundance as analysed by DeCyder software (GE Healthcare, Piscataway. NJ, USA) between the MS and the ONDs groups. The expression of five protein spots was elevated and the expression of 12 protein spots was decreased in the MS group. Meanwhile, the latter method, UPLC/Q-TOF MS showed 68 different proteins. There were 45 proteins with a difference of more than 1.5 folds between the two groups, in which the expression of 20 proteins was elevated and the expression of 25 proteins was decreased in the MS group. Data provided by the two methods indicated that the proteins overlapped ratio was 27% in the 26 significant proteins that had the same regulation tendency. The differential CSF proteins were analysed further by biological network and it revealed interaction of them. The subsequent ELISA measuring the concentration of cystatin C (P < 0.01), which was one of the proteins discovered simultaneously with the two technologies, confirmed the results of the two quantitative proteomic analysis. The combination of the two quantitative proteomic technologies was helpful in discovering differentially expressed proteins that may have a connection with MS disease physiology and serve as useful biomarkers for diagnosis and treatment of MS diseases.
Keywords: multiple sclerosis, quantitative proteomic, 2D-DIGE, UPLC/Q-TOF, ELISA
Introduction
Multiple sclerosis (MS), the most ubiquitous autoimmune disease affecting the central nervous system (CNS), is a chronic inflammatory demyelinating disease and leads to progressive neurological dysfunction disease of unknown cause [1, 2]. The diagnosis of MS is generally based on the facts of clinical, radiological and laboratory analyses [3]. Epidemiological and genetic investigations suggest that an exogenous agent, perhaps a viral agent, brings on the disease [4]. Currently, no antigen in MS has been identified as the major target of the immune response and a true biomarker for MS with which people could predict subtypes and progression of diseases to improve individually tailored treatment.
The cerebrospinal fluid (CSF) is a promising source of biomarkers for disorders of the CNS, since the CSF compartment is in close contact with the brain interstitial fluid in which biochemical changes related with the undiscovered disease are usually shown [5].
The proteomic approach for the identification and quantification of the entire protein content (proteome) of a single cell, tissue or body fluid at a given time may provide people with insight into the mechanisms of diseases and is capable of revealing biomarkers for various cases [6]. However, many proteomic technologies have not yet been standardized and require extensive optimization for specific biological applications. In addition, some proteomic methods cover incomplete proteome, lack quantitative precision and/or yield large amounts of data. It is difficult to discern the biological relevance of those data. Two-dimensional electrophoresis (2-DE) is an important technique that has been and is widely used in global proteomics but it does not provide optimal resolution of highly acidic proteins, highly basic proteins or high-molecular-weight proteins [7]. 2-DE is plagued by high run-to-run variability and various staining techniques of 2-DE are definite on versatility, sensitivity and linearity up to now [8].
Recent advance and innovation have led to significant improvement on 2-DE technology. One is difference in-gel electrophoresis (DIGE), with which samples are differentially labelled and multiplexed prior to gel analysis. The high accuracy arises from the utilization of an internal standard, which has been previously applied to increase substantially the accuracy of quantification [9]. This approach facilitates quantitative comparison, improves greatly the dynamic range and controls experimental variation [10, 11].
Ultra-performance liquid chromatograph (UPLC) coupled with quadrupole time-of-flight mass spectrometry (Q-TOF MS) (UPLC/Q-TOF MS) is an effective and sensitive analytical tool, through rapid elution in a short column with 1.7-μm particles, which enables elution of sample subjects in much narrower, more concentrated bands, resulting in better chromatographic resolution and increased peak capacity, with a high capture rate mass spectrometry (Q-TOF) with accurate mass measurement that enables the removal of interpretation ambiguities. With this high-resolution and sensitive system, people are able to obtain multi-parametric metabolite profiles from biofluids, rapidly and effectively. It is considered as a powerful metabonomic tool [12].
Two quantitative proteomic technologies were applied in this study, which were respectively 2D-DIGE (2-dimensional fluorescene difference in-gel elec-trophoresis) followed by MALDI-TOF MS (matrix-assisted laser desorption ionization time-of-flight mass spectrometry), and UPLC/Q-TOF MS. In both of the methods, internal standard was added for quantitatively analyzing the differential proteomic expression in the CSF between the MS and ONDs groups. 2D-DIGE seperates impact protein while UPLC/Q-TOF seperates peptide. ELISA was also employed to validate the quantitative proteomic results. The differentially expressed proteins identified between the two groups were further investigated to reveal the biological pathways of these proteins in association with the pathogenesis of MS. We drew a comparison between the capacities of the two methods in protein separation to determine the relative overlap in protein separation, which expanded the proteome coverage better. This study allows the detection, identification and quantification of a large number of putative biomarkers in MS, leading to a ‘molecular signature’ of proteomic patterns free of pre facto bias.
Materials and methods
CSF specimens
In the experimental group, the CSF samples were taken from 30 patients with MS (relapsing-remitting MS). A diagnosis of MS was confirmed on the basis of the criteria of McDonald [13]. When the patients underwent lumbar puncture, none of them received an immunomodulatory therapy. In the control group, CSF samples were taken from 36 patients with ONDs (headache etc). A lumbar puncture was performed in the L4-L5 intervertebral space, and CSF samples that became turbid or mixed with blood were excluded in this study. Each sample of 1.5-ml CSF was then centrifuged at 16,000 ×g (4°C) for 10 min. to eliminate cells and other insoluble materials. The samples were then stored at −80°C before the succeeding manipulation. The study was approved by the local ethical committee at Affiliated Qilu Hospital, Shandong University, China. All the patients were from Affiliated Qilu Hospital, Shandong University, and gave informed consent to participate in the study. The clinical and laboratory features of the patients are summarized in Table 1.
Table 1.
Clinical and laboratory features of MS and ONDs patients
| Diagnosis | N (male/female) | Age (years) | CSF cells (μ/l) | CSF protein (g/l) | CSF IgG (mg/l) | N of OCB | Disease duration (years) |
|---|---|---|---|---|---|---|---|
| Relapsingremitting MS | 30 (14/16) | 39.4 (18–62) | 6 (0–16) | 0.45 (0.31–0.64) | 46.1 (30.2–99.6) | 5 (3–6) | 6.4 (0.1–30) |
| ONDs | 36 (20/16) | 40.2 (17–61) | 0.7 (0–5) | 0.32 (0.16–0.48) | 21.1 (13–42.5) | 0 | _ |
Sample preparation for 2D-DIGE
Ten CSF samples were selected randomly from the experimental group and the control group each (1 ml each). They generated two sample pools (MS sample and ONDs sample, 10 ml each) for 2D-DIGE. The solubilization for discovery proteomic analysis was done according to the protocol described by Yuan and her coworkers [14] with our own modifications. Briefly, 10-ml CSF samples were precipitated with 100% ice-cold acetone in a 4:1 ratio of acetone and the CSF and stored overnight at −20°C to remove salt from the samples. Then, the mixture was centrifuged at 16,000 ×g at 4°C for 30 min. The pellet was washed twice with 90% acetone and then air-dried. The pellet was solubilized in a lysis buffer containing 8 M urea, 4% CHAPS and 30 mM Tris. The protein concentrations were measured with 2D Quant kit according to the manufacturer's instructions.
Labelling
Since each 2D-DIGE experiment was performed three times, the sample pools were subdivided into three equal fractions prior to label. We labelled the three sample pools (MS, ONDs and internal standard) containing equal amounts of protein with three different cyanine dyes (Cy dyes; Cy2, Cy3 and Cy5; GE Healthcare). The internal standard was labelled with Cy2 and the pool of the MS was labelled with Cy3 and that of the ONDs was labelled with Cy5. For each of the three 2D-DIGE experiments, Cy dyes were reconstituted in anhydrous dimethylformamide (DMF) and mixed with the samples at a ratio of 400 pmol Cy dye per 50 μg of protein (30 min. on ice). By adding 1 μl of 10 mM lysine for 10 min. on ice, the reaction was stopped.
2-DE
The first dimension of 2-DE was run on an IPGphor IEF system (GE Healthcare). The samples labelled with Cy3 and Cy5 as well as internal standards labelled with Cy2 were pooled, then the same volume supplement buffer was added containing 8 M urea, 4% CHAPS, 30 mM Tris, 2% DL-dithiothreitol (DTT) and 2% immobilized pH gradient (IPG) buffer and was left for 10 min. on ice in dark. A rehydration solution containing 8 M urea, 2% CHAPS, 0.5% IPG buffer, 18 mM DTT and a trace of bromophenol blue was added to a total volume of 340 μl and applied to IPG dry strips (18 cm, 3–10 none linear [NL]). Isoelectric focusing (IEF) was performed for analytical runs as follows: 200 V for 1 hr; 500 V for 1 hr; 1000 V for 1 hr; gradient of 8000 V over 2 hrs and 8000 V for 60000 vhr. SDS-PAGE was carried out vertically in an Ettan DALT six (GE Healthcare) electrophoresis system. All the procedures were carried out in dark. In total, 1000 μg of proteins without labelling was run to develop preparative gels for MALDI-TOF MS. After 2-DE, the preparative gels were fixed in 40% ethanol and 10% acetic acid for 1 hr and then stained with Coomassie blue based on the procedure described by Neuhoff [15].
Image analysis
The analytical gels were scanned with a Typhoon TRIO (GE Healthcare) imager at excitation/emission values of 488/520 nm for Cy2 dye, 532/580 nm for Cy3 dye and 633/670 nm for Cy5 dye. The gel images were analysed with commercially available DeCyder software 6.0 (GE Healthcare) using the automated spot detection, algorithm of differential in-gel analysis (DIA) module and biology variation analysis (BVA). The minimum thresholds required for the data to be used for quantitation is ±0.2 (MS/ONDs). For each treatment, images from at least three biological repeats were used for statistical analysis of protein abundance. And, the difference between the MS group and the ONDs group was assessed by the independent-samples t-test with the SPSS 11.5 software (SPSS Inc., Chicago, IL, USA).
MALDI-T0F MS and database searching
The protein spots that were found altering significantly by the statistical analysis were excised from the preparative gels, de-stained in microtubes with 40% methanol or 10% acetic acid (HAc) for 6 hrs and then dried completely by centrifugal lyophilization. The dried gel slices were re-swollen and washed twice for 1 hr. After discarding the liquid phase, the gel slices were crushed in the tube and 40 μJ of 100 mM ammonium bicarbonate (NH4HCO3), containing 5 μl of 10 ng/μl trypsin, was added and then the gel pieces were incubated at 37°C for 24 hrs. The gel pieces were extracted with 200 μl of 60% acetonitrile (ACN)/0.1% trifluoroacetic acid (TFA) for 20 min. with sonication and the supernatant was removed. The extraction was repeated three times and then dried. Peptide extracts were analysed on a MALDI-TOF MS 4700 (ABI Corp, Carlsbad, CA, USA) in positive ion reflectron mode. Peptide mass fingerprint (PMF) was obtained by processing with DATA EXPLORER software (version 4.0.0.0) and MSight (version 2.0, Proteome Informatics Group, Geneva Switzerland). The peptide mass data were searched against Swiss-Prot protein database, Swiss-Prot number 53.3 (release 53.3 of 10th July 2007), by searching the engine of Mascot (MatrixScience Ltd., London UK) with Homo sapiens as the species searched. If more than one protein was identified in a spot, the single-protein member with the highest score (top rank) was singled out from the multi-protein family. The basic requirement for the identification was a significance threshold of P < 0.05, as Mascot acquiesced. The protein score is −10 × log (P), where P is the probability that the observed match is a random event.
UPLC/Q-T0F MS
We selected randomly another two batches of CSF samples, one from 10 patients with MS and one from 10 controls with ONDs, to generate two sample pools. The method of protein preparation was according to sample preparation for 2D-DIGE. The protein concentrations also were measured with 2D Quant kit. The proteins were solubilized in 50 mM NH4HCO3 (pH 8.5) for UPLC/Q-TOF MS. The volumes of the samples were adjusted to 100 μL with 50 mM ammonium bicarbonate (pH 8.5) containing 0.1% RapiGest SF (Waters Ltd, Elstree, UK) [16]. Protein (about 200 μg of protein per sample) was reduced in the presence of 5 mM DTT at 60°C for 30 min. Three standard proteins were prepared with the same digestion method, and 2-μJ full-loop injections containing about 0.15 μg of sample protein were digested, spiked with standard digestion as described below: 25 fmol/μJ enolase, 125 fmol/μJ alcohol dehydrogenase (ADH) and 25 fmol/μJ glycogen phosphorylase in the control group and 25 fmol/μJ enolase, 25 fmol/μJ ADH and 200 fmol/μJ glycogen phosphorylase in the experimental group. The samples were injected again at a higher concentration, about 0.45 μg of sample protein, in the column (3-fold increase in loading) to disclose the low-abundance proteins.
UPLC/Q-TOF MS was performed on a Waters® Premier NanoACQUITYSystem (V mode analysis) (Waters Ltd), equipped with a binary solvent delivery system, an autosampler and a TUV detector. The chromatography was performed on a 10 cm × 75 μm ID BEH Waters Acquity 1.7-μm C18 column. The mobile phase was 5–40% acetonitrile for over 90 min. The injection volume was 2 μl at the speed of 200 μl/min. All analyses were performed using positive nanoelectrospray ion mode. The time-of-flight analyser of the mass spectrometer was externally calibrated with Nal from m/z 50 to 1990, with the data post acquisition lock mass corrected using the monoisotopic mass of the doubly charged precursor of [Glu] fibrinopeptide B. The reference sprayer was sampled with a frequency of 30 s [17]. Accurate mass liquid chromatography/mass spectrometry (LC/MS) and LC/MSE data were collected using 10 eV for MS and 15–35 eV for MSE acquisition so that one cycle of MS and MSE data was acquired every 4.0 s. The radio frequency (RF) offset was adjusted so that the LC/MS data were effectively acquired from m/z 300 to 2000, which ensured that any masses observed in the LC/MS data that were less than m/z 300 were known to arise from dissociations in the collision cell. Each sample was run in triplicate. For analysis, on the protein identification and quantification level, the observed intensity measurements are normalized on the intensity measurement of the identified peptides of the digested internal standard. Data and protein identification information were processed and searched using ProteinLynx GlobalServer version 2.0 (Waters Corporation). Protein identification information was obtained by the embedded ion accounting algorithm of the software and by searching a human database. The MS/MS figure was obtained by processing with MSight (version 2.0).
The fragment ion tolerance was ± 0.5 D. Trypsin was chosen for ‘Enzyme’, carbamidomethyl (C) was chosen for fixed modification and oxidation (M) was chosen for variable modification. The ion detection and normalization were performed using ProteinLynx GlobalServer [17]. The false-positive rate of the ion accounting identification algorithm is typically 3–4% with a randomized database five times the size of the original utilized database [17]. The number of protein entries in the database actually searched were automatically acquired. The detailed strategy about the protein identification was described by Johannes [17]. The minimum thresholds required for data to be used for quantitation is ±0.1 (MS/ONDs). If the ratio is ≤−3, the proteins are unique in the ONDs group. In contrast, if the ratio is ≥3, the proteins are unique in the MS group. The difference between the two groups was assessed by the independent-samples t-test with the SPSS 11.5 software.
ELISA
All CSF samples containing 30 MS and 36 ONDs were used for validation analysis. The ELISA kit for human cystatin C (Biovendor, CTPark Modrice, Modrice, Czech Republic) was used and the assays was run according to the manufacturer's directions. The ELISA data were statistically analysed and the difference between the experimental group and the control group was assessed by the independent-samples t-test. Statistical significance was defined as P < 0.01.
Networks and function analysis using MetaCore
MetaCore (GeneGo, St. Joseph, Ml, USA), which is an integrated software suite for functional analysis of experimental data, was used to build the dif-ferentially expressed proteins into biological networks. In total, 26 proteins with the same tendency that have more than 1.5 folds of different expression between the two groups were converted into Swiss-Prot ID and uploaded to MetaCore for analysis. The biological process enrichment was analysed based on the shortest-path algorithm to build the shortest path for interaction. The shortest-path algorithm tries to link the original genes with additional objects from the database.
Results
Proteins differentially expressed by 2D-DIGE and MALDI-T0F MS
2D-DIGE technology has been used to study the differences in the CSF proteome of MS and ONDs patients. In the overlapped gel, a total of 3444 protein spots were detected. Apart from 2534 spots that were similar in concentration in both groups, 760 spots were decreased and 150 were increased in the MS group. Forty-three protein spots (39 proteins) were identified by MALDI-TOF, of which 17 spots showed more than 1.5-fold difference in abundance between MS and ONDs (Fig. 1). The difference between the experimental group and the control group was assessed by the independent-samples t-test (P < 0.05). MALDI-TOF MS showed that these spots corresponded to 13 distinct proteins in MS (Table 2, dark grey shadow). The analysis information of the significant proteins is shown in Supporting Information (Fig. S1).
Fig. 1.

Representative overlapped gel from 2-D DIGE experiment, which included 10 CSF samples with minimal Cy dye labelling. Fifty micrograms of protein from MS (Cy3-labelled), 50 μg of protein from ONDs (Cy5-labelled), and 50 μg of internal standard (Cy2-labelled) were loaded on one 2D gel. Gels for minimal labelling were scanned with a Typhoon TRIO. After electrophoresis, the gels were processed as described in Materials and Methods. White line and numbers indicate identified proteins with a difference of more than 1.5 folds in abundance, which corresponded to Table 2. Green spots reveal up-regulating protein spots and red spots reveal down-regulating protein spots in MS compared with ONDs.
Table 2.
The detail information of proteins identified by the two quantitative proteomic technology
| Protein no. | Primary accession number (Swiss-Prot) | Protein description | Swiss-Prot | Score (2D-DIGE/ UPLC-Q/TOF) | Theoretical (Mr/ PI) | Experimental (Mr/ PI) | Sequence coverage (%) | Peptide counts (2D-DIGE/ UPLC- Q/TOF) | 2D-DIGE volume ratio (MS/ ONDs) (P<0.05) | UPLC-Q/TOF in normalized ratio (MS/ ONDs) (P<0.05) |
|---|---|---|---|---|---|---|---|---|---|---|
| 1 | P01034 | Cystatin-C precursor | CYTC_HUMAN | 155/49 | 16.02/9.00 | 15.80/8.76 | 64.74 | 12/2 | −1.65 ± 0.012 | −0.25 ± 0.006 |
| 2 (left) | P68871 | Haemoglobin beta chain | HBB_HUMAN | 181/27 | 15.97/6.81 | 15.87/7.12 | 53.01 | 15/1 | 8.02 ± 0.015 | 1.50 ± 0.021 |
| 2 (right) | P68871 | Haemoglobin beta chain | HBB_HUMAN | 104 | 15.97/6.81 | 15.87/7.21 | 47.20 | 9 | 10.05 ± 0.145 | - |
| 3 (upper) | P02766 | Transthyretin precursor | TTHY_HUMAN | 135/102 | 15.99/5.52 | 34.00/5.21 | 63.25 | 11/1 | −2.11 ± 0.016 | −2.20 ± 0.013 |
| 3 (lower) | P02766 | Transthyretin precursor | TTHY_HUMAN | 115 | 15.99/5.52 | 16.58/5.50 | 59.70 | 11 | −1.70 ± 0.009 | - |
| 4 (right) | P00738 | Haptoglobin precursor | HPT_HUMAN | 71/64 | 45.86/6.13 | 17.90/6.13 | 22.47 | 9/1 | −1.89 ± 0.007 | ≤−3 |
| 4 (left) | P00738 | Haptoglobin precursor | HPT_HUMAN | 82 | 45.86/6.13 | 18.00/5.60 | 29.43 | 10 | −1.65 ± 0.011 | - |
| 5 (lower) | P01834 | Ig kappa chain C region | KAC_HUMAN | 66/76 | 11.70/5.58 | 28.05/7.50 | 43.64 | 5/1 | 2.98 ± 0.013 | 1.60 ± 0.026 |
| 5 (upper) | P01834 | Ig kappa chain C region | KAC_HUMAN | 57 | 11.70/5.58 | 30.00/7.50 | 35.30 | 5 | 2.66 ± 0.011 | - |
| 6 | P01842 | Ig lambda chain C region | LAC_HUMAN | 69/123 | 11.40/6.92 | 35.00/8.76 | 6.58 | 5/1 | 2.16 ± 0.035 | 0.40 ± 0.007 |
| 7 | P01028 | Complement C4 precursor | C04_HUMAN | 110/43 | 19.42/6.65 | 36.05/8.06 | 37.14 | 21/1 | −1.52 ± 0.018 | −1.60 ± 0.045 |
| 8 | P02649 | Apolipoprotein E precursor | APOE_HUMAN | 181/90 | 36.25/5.65 | 37.25/5.45 | 41.94 | 21/2 | −1.82 ± 0.018 | −1.45 ± 0.019 |
| 9 | P02675 | Fibrinogen beta-chain precursor | FIBB_HUMAN | 149 | 56.58/8.54 | 36.21/7.45 | 33.36 | 15 | −2.62 ± 0.028 | - |
| 10 | P02768 | Serum albumin precursor | ALBU_HUMAN | 400/138 | 71.32/5.92 | 64.00/7.60 | 62.17 | 37/4 | −1.60 ± 0.016 | −1.50 ± 0.011 |
| 11 | P36955 | Pigment epithelium-derived factor precursor | PEDF_HUMAN | 162/121 | 46.48/5.97 | 65.02/7.13 | 40.06 | 17/1 | −1.58 ± 0.021 | −1.90 ± 0.032 |
| 12 | P02774 | Vitamin D-binding protein precursor (DBP) | VTDB_HUMAN | 242/225 | 54.53/5.40 | 67.45/5.72 | 56.10 | 22/4 | −1.51 ± 0.018 | −1.45 ± 0.029 |
| 13 | P63261 | Actin | ACTG_HUMAN | 84 | 42.10/5.31 | 65.60/5.20 | 18.21 | 7 | −4.42 ± 0.059 | - |
| 14 | P51693 | Amyloid-like protein 1 precursor | APP1_HUMAN | /89.8 | 72.00/5.54 | - | - | /1 | - | −2.50 ± 0.019 |
| 15 | Q92876 | Kallikrein6 precursor | KLK6_HUMAN | 141/67 | 27.52/7.15 | 32.01/7.2 | 50.80 | /2/1 | −1.40 ± 0.008 | −2.25 ± 0.029 |
| 16 | Q9UBP4 | Dikkopf-relatted protein-3 precursor | DKK3_UMAN | /11.4 | 38.29/4.55 | - | - | /2 | - | −2.25 ± 0.016 |
| 17 | P05060 | Secretogranin1 precursor | SG1_HUMAN | /70.3 | 78.25/5.02 | - | - | /2 | - | −2.20 ± 0.079 |
| 18 | P02652 | Apolipoprotein A-II precursor | APA2_HUMAN | /65.8 | 11.18/6.27 | - | - | /1 | - | −2.00 ± 0.038 |
| 19 | P23142 | Fibulin-1 precursor | FBL1_HUMAN | /113.6 | 77.00/5.10 | - | - | /4 | - | −1.90 ± 0.053 |
| 20 | Q9UEF2 | Ubiquitin UBC | UBIQ_HUMAN | /201.5 | 77.04/7.16 | - | - | /1 | - | −1.80 ± 0.039 |
| 21 | P06396 | Gelsolin precursor | GELS_HUMAN | /22.8 | 86.00/5.80 | - | - | /1 | - | −1.75 ± 0.032 |
| 22 | P01019 | Angiotensinog en precursor | ANGT_HUMAN | /19.5 | 50.00/5.50 | - | - | /2 | - | −1.70 ± 0.056 |
| 22 | P01019 | Angiotensinog en precursor | ANGT_HUMAN | /19.5 | 50.00/5.50 | - | - | /2 | - | −1.70 ± 0.056 |
| 23 | P10909 | Clusterinassociated protein 1 | CLUA1_HUMAN | 40/86.9 | 48.10/4.68 | 55.24/5.2 | 9.00 | 4/5 | −1.45 ± 0.006 | −1.70 ± 0.012 |
| 24 | Q12805 | EGF-containing fibulin-like extracellular | FBL3_HUMAN | /93.1 | 54.64/4.95 | - | - | /4 | - | −1.65 ± 0.031 |
| 25 | P05090 | Apolipoprotein D precursor | APOD_HUMAN | /131.2 | 31.00/4.23 | - | - | /2 | - | −1.65 ± 0.031 |
| 26 | P41222 | Prostaglandin -H2 D | PGHD_HUMAN | /96.0 | 21.03/7.66 | - | - | /2 | - | −1.63 ± 0.012 |
| 27 | P02787 | Serotransferrin precursor | TRFE_HUMAN | 165/78 | 79.28/6.81 | 78.00/6.50 | 31.20 | 17/5 | 1.0 ±0.002 | −1.3± 0.003 |
| 28 | P02790 | Haemopexin precursor | HAEMO_HUMAN | /9.3 | 78.00/5.34 | - | - | /1 | - | −1.25 ± 0.023 |
| 29 | P02647 | Apolipoprotein A-l precursor | APA1_HUMAN | /8.9 | 23.00/5.47 | - | - | /3 | - | −1.25 ± 0.012 |
| 30 | P05155 | Plasma protease C1 inhibitor precursor | IC1_HUMAN | /56.8 | 55.15/6.09 | - | - | 12 | - | −1.2± 0.002 |
| 31 | P01011 | Alpha-1-antichy- motrypsin precursor | AACT_HUMAN | /124.7 | 71.00/4.40 | - | - | /5 | - | −1.0± 0.001 |
| 32 | P01023 | Alpha-2 macroglobulin precursor | A2MG_HUMAN | /11.6 | 161.0/5.90 | - | - | /1 | - | −0.75 ± 0.003 |
| 33 | P25311 | Zinc-alpha-2- glycoprotein precursor | ZA2G_HUMAN | 213/89 | 34.10/5.57 | 35.24/5.30 | 24.51 | 18/3 | −0.5 ± 0.001 | −0.7 ± 0.002 |
| 34 | P00450 | Ceruloplasmin precursor | CERU_HUMAN | 90/72 | 122.13/5.44 | 116.0/5.40 | 8.00 | 8/1 | −0.3 ± 0.001 | −0.51 ± 0.005 |
| 35 | P01765 | Ig heavy chain VJII region TIL | HV3D_HUMAN | /87.6 | 55.30/7.17 | - | - | 12 | - | −0.5 ± 0.006 |
| 36 | P04004 | Vitronectin precursor | VTNC_HUMAN | /21.0 | 52.00/5.30 | - | - | /1 | - | −0.3 ± 0.001 |
| 37 | P01009 | Alpha-1- antitrypsin precursor | A1AT_HUMAN | 80/65 | 46.70/5.37 | 48.46/5.23 | 14.00 | 6/3 | −0.2 ± 0.001 | −0.2 ± 0.002 |
| 38 | P01860 | Ig gamma-3 chain C region | IGHG3_HUMAN | /90.1 | 32.33/7.89 | - | - | 12 | - | −0.2 ± 0.001 |
| 39 | P01859 | Ig gamma-2 chain C region | IGHG2_HUMAN | /76.5 | 35.88/7.66 | - | - | 12 | - | −0.15 ± 0.001 |
| 40 | P01024 | Complement C3 precursor | C03_HUMAN | /129.7 | 105.0/5.90 | - | - | 12, | - | −0.15 ± 0.001 |
| 41 | Q9UL91 | Myosin-reactive immunoglobu-lin heavy chain | Q9UL91_HUMAN | /91.2 | 12.84/5.25 | - | - | /1 | - | 0.1 ±0.001 |
| 42 | P01857 | Ig gamma-1 chain C region | IGHG1_HUMAN | 139/184.5 | 36.59/8.46 | 65.35/8.24 | 23.44 | 13/4 | 0.2 ± 0.001 | 0 |
| 43 | P01766 | Ig heavy chain V_II region BRO | HV3E_HUMAN | /65.9 | 55.30/7.17 | - | - | 12 | - | 0.15 ± 0.003 |
| 44 | P02763 | Alpha-1-acid glycoprotein 1 precursor | A1AG_HUMAN | /79.4 | 47.00/3.95 | - | - | 12 | - | 0.17 ± 0.005 |
| 45 | Q96KX8 | Hypothetical 53.4 kD protein | Q96KX8_HUMAN | /120.1 | 53.39/8.07 | - | - | /1 | - | 1.0 ±0.013 |
| 46 | Q9UDW8 | WUGSC:H-DJ0747G18.3 protein | Q9UDW8_HUMAN | /89.3 | 67.26/4.76 | - | - | /1 | - | ≤−3 |
| 47 | Q96IZ1 | Secreted phos-phoprotein 1 (osteopontin) | OSTP_HUMAN | /13.8 | 33.83/4.4 | - | - | /1 | - | ≤−3 |
| 48 | P35527 | K1C1_HUMAN keratin | K1C1_HUMAN | /61.9 | 61.99/5.14 | - | - | /1 | - | ≤−3 |
| 49 | P04264 | K2C1_HUMAN keratin | K2C1_HUMAN | /67.3 | 65.89/8.16 | - | - | /1 | - | ≤−3 |
| 50 | P05067 | Alzheimer's disease amyloid A4 protein precursor | A4_HUMAN | /59.6 | 86.94/4.73 | - | - | 12 | - | ≤−3 |
| 51 | Q15668 | Epididymal secretory protein E1 precursor | NPC2_HUMAN | /102.3 | 16.57/7.57 | - | - | /1 | - | ≤−3 |
| 52 | Q9UQS6 | Fibronectin | Q9UQS6_HUMAN | /235.1 | 38.66/9.65 | - | - | /1 | - | ≥3 |
| 53 | P01620 | Ig kappa chain V_II region SIE | KV3B_HUMAN | /37.4 | 11.80/8.7 | - | - | /3 | - | ≥3 |
| 54 | P01598 | Ig kappa chain V_II region EU | KV1F_HUMAN | /53.8 | 11.79/8.62 | - | - | /1 | - | ≥3 |
| 55 | P01871 | Ig MU chain C region | MUC_HUMAN | /89.2 | 49.57/6.35 | - | - | /1 | - | ≥3 |
| 56 | Q96DK0 | CDNA FLJ25298 fis | Q96DK0_HUMAN | /25.3 | 53.53/6.21 | - | - | /1 | - | ≥3 |
| 57 | Q9UL85 | Myosin-reactive immunoglobu-lin kappa chain | Q9UL85_HUMAN | /68.1 | 11.76/8.76 | - | - | /1 | - | ≥3 |
| 58 | P36222 | Chitinase-3-like protein 1 precursor | CH3L1_HUMAN | /135.8 | 42.61/8.69 | - | - | 12 | - | ≥3 |
| 59 | Q96PF6 | Kappa 1 light chain variable region | Q96PF6_HUMAN | /39.6 | 12.74/7.98 | - | - | 12 | - | ≥3 |
| 60 | P01042 | Kininogen precursor | KNG_HUMAN | /76.9 | 71.95/6.34 | - | - | /1 | - | ≥3 |
| 61 | P02747 | Complement C1q subcomponent | C1QC_HUMAN | /13.0 | 25.77/8.61 | - | - | /1 | - | ≥3 |
| 62 | P00751 | Complement factor B precursor | CFAB_HUMAN | /15.1 | 85.53/6.67 | - | - | /3 | - | ≥3 |
| 63 | P02748 | Complement component C9 precursor | C09_HUMAN | /98.6 | 63.17/5.43 | - | - | /5 | - | ≥3 |
| 64 | P02750 | Leucine-rich alpha-2-glyco- protein | A2GL_HU MAN | /120.3 | 38.18/6.45 | - | - | 12 | - | ≥3 |
| 65 | P04217 | Alpha-1B- glycoprotein precursor | A1BG_HUMAN | 164/78 | 54.81/5.58 | 60.42/5.32 | 54.30 | 19/4 | 1.0 ±0.002 | ≥3 |
| 66 | P01008 | Antithrombin-III | ANT3_HUMAN | 81/74 | 52.57/6.32 | 60.33/6.45 | 18 | 7/2 | 1.25 ± 0.001 | ≥3 |
| 67 | P00747 | Plasminogen precursor | PLMN_HUMAN | 58/69 | 90.51/7.04 | 62.25/7.20 | 9 | 6/1 | 1.30 ± 0.001 | ≥3 |
| 68 | P08603 | Complement factor H precursor | CFAH_HUMAN | 61/79 | 138.98/6.23 | 125.88/5.52 | 8 | 8/3 | 1.20 ± 0.003 | ≥3 |
| 69 | P00737 | Haptoglobin-1 precursor | HPT_HUMAN | /42.9 | 38.45/6.13 | - | - | /1 | - | ≤3 |
| 70 | P69905 | Haemoglobin alpha chain | HBA_HUMAN | 114/95 | 15.17/8.73 | 14–86/8–52 | 58.87 | 7/1 | 1.3 ±0.011 | ≥3 |
| 71 | P02753 | Retinol-binding protein precursor | RETBP_HUMAN | 138 | 23.37/5.76 | 20.10/5.32 | 36.62 | 12 | 1.13 ± 0.015 | - |
| 72 | P02679 | Fibrinogen gamma chain precursor | FIBG_HUMAN | 88 | 52.11/5.37 | 59.88/6.02 | 12.24 | 10 | 0.5 ±0.001 | - |
| 73 | Q28758 | Apolipoprotein A-IV precursor | APOA4_HUMAN | 56 | 45.37/5.28 | 45.23/5.5 | 12 | 5 | −0.6 ± 0.001 | - |
| 74 | Q53GI3 | Zinc finger protein 394 | ZN394_HUMAN | 41 | 64.22/8.14 | 45.37/5.34 | 5 | 4 | −0.2 ± 0.002 | - |
| 75 | P02679 | Zinc finger protein 268 | ZN268_HUMAN | 56 | 108.30/9.14 | 65.79/6.6 | 8 | 6 | −0.3 ± 0.001 | - |
| 76 | Q9UID9 | Zinc finger protein255 | ZN255_HUMAN | 58 | 75.06/8.99 | 68.78/7.21 | 9.88 | 6 | −0.5 ± 0.001 | - |
| 77 | Q70EKB | Inactive ubiq-uitin carboxyl-terminal hydrolase 53 | UBP53_HUMAN | 61 | 120.73/7.54 | 62.55/5.2 | 5 | 7 | −1.0± 0.003 | - |
| 78 | P00441 | Superoxide dismutase | SODC_HUMAN | 34 | 16.02/5.7 | 16.54/6.0 | 10.78 | 3 | 0.7 ±0.001 | - |
| 79 | Q8WYAD | Carnitine deficiency-associated protein | CDV1_HUMAN | 61 | 80.04/8.9 | 65.02/5.01 | 13.16 | 12 | −0.9 ± 0.002 | - |
| 80 | Q16647 | Prostacyclin synthase | PTGIS_HUMAN | 22 | 57.18/6.8 | 60.45/6.8 | 2.26 | 4 | −0.2 ± 0.005 | - |
| 81 | P61769 | β-2 microglobulin precursor | B2MG_HUMAN | 88 | 13.82/6.06 | 14.23/6.0 | 36.74 | 6 | 0.8 ±0.001 | - |
| 82 | Q9H5—1 | Hypothetical UPF0195 protein | U195_HUMAN | 34 | 18.63/4.88 | 50.21/4.80 | 11.42 | 2 | −0.2 ± 0.006 | - |
| 83 | P07196 | Neurofilament | NFL_HUMAN | 49 | 55.35/5.34 | 57.36/5.25 | 17.00 | 5 | 0.8 ±0.001 | _ |
| 84 | P22352 | Plasma glutathione peroxidase precursor | GPX3_HUMAN | 68 | 25.77/8.20 | 28.75/6.8 | 23.13 | 6 | 0.2 ±0.001 | - |
The data from No. 1 to No. 13 indicate 13 proteins with a difference of at least more than 1.5 folds identified by both 2D-DIGE and UPLC/Q-TOF MS. The data from No. 14 to No. 26 contain the proteins with a difference of at least more than 1.5 folds identified by 2D-DIGE or UPLC/Q-TOF MS.
The finding of more than 8-fold increase of haemoglobin beta chain was seen in three DIGE gels groups. Besides the secretion of CSF by the choroid plexus, the fluid also derives directly from the brain by the ependymal lining of the ventricular system and the glial membrane and from blood vessels in the arachnoid. It is unavoidable that various amounts of blood contamination in the CSF may arise during sample acquisition. The concentration of protein in the CSF is only 0.2–0.5% of that in blood. Minor contamination of the CSF with blood during the collection of the fluid may dramatically alter the protein profile and confound the identification of potential biomarkers. You and his coworkers reported that haemoglobin alpha chain and haemoglobin beta chain could be used as blood contamination markers for proteomic analysis of the CSF [18]. Therefore, the high increase of haemoglobin beta chain in this study may be caused by blood contamination.
Proteins differentially expressed by UPLC/Q-TOF MS
Two protein mixtures extracted in two sample pools, one from 10 patients with MS and one from 10 controls with ONDs, were digested to two peptide mixtures and then separated with a UPLC column packed with reverse-phase media to acquire eluting ion peaks, which electrosprayed into an online Q (quadrupole)-TOF MS instrument. We identified and quantified 68 differences in the proteins. There were 45 proteins with a difference of more than 1.5 folds in abundance between the two groups of CSF samples (Fig. 2). The expression of 20 proteins was elevated and the expression of 25 proteins was decreased (Table 2).
Fig. 2.

Distribution map for the expression levels of proteins identified by UPLC/Q-TOF MS. We identified and quantified 68 differences proteins by UPLC/Q-TOF MS, in which 42 proteins were common to both samples, 8 proteins were unique to ONDs and 18 proteins were unique to MS (sample 2). Forty-five proteins of all showed a difference of more than 1.5 folds in abundance between both the samples. The minimum threshold required for data to be used for quantitation was ±0.1(MS/ONDs). If the ratio was ≤−3, the proteins were unique in the ONDs. In contrast, if the ratio was ≥3, the proteins were unique in the MS. The detailed information of all proteins are shown in the figure, in which the abscissa represents normalized ratio, negative value shows down-regulating and positive value shows up-regulating in MS compared with ONDs (grey circle showed unique proteins).
The accuracy of mass measurement and chromatographic reproducibility are needed to acquire a wonderful result in UPLC/Q-TOF MS [19]. We run in triplicate per sample. The data quality was checked statistically by system statistics at the peptide level, including retention time reproducibility, mass precision, replication level and ion intensity reproducibility (Fig. S1). The utilization of the 1.7-μm ethylene bridged hybrid (BEH) particles and 5–40% acetonitrile as the mobile phase at 200 nl/min. increased column efficiency. Good separation and narrow peaks were achieved, which resulted in better chromatographic resolution and increased signal-to-noise ratio. Q-TOF systems have inherently good mass accuracy. Lock mass allows for real-time mass measurement correction during data acquisition. The result we obtained revealed a better reproducible chromatography between triplicate injections (Fig. 3). In order to acquire relative peptide quantification, we utilized low- and high-energy ways to survey all precursor ions and fragment ions and then used fold-change of exact mass retention times (EMRTs) to drive subsequent searches (Fig. 4). The analysis information of the significant proteins is shown in Supporting Information (Fig. S1).
Fig. 3.
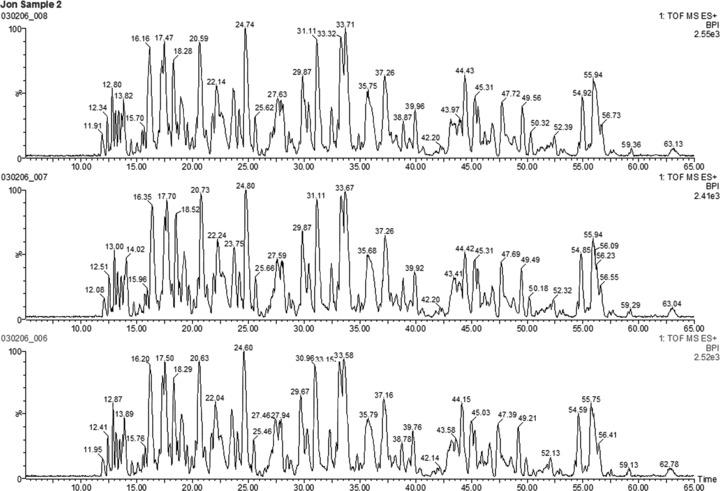
Base peak chromatograms for peptide mixtures. MS sample (sample 2) indicating the complexity of the mixtures. Major chromatographic peaks are labelled with the retention time (RT) of the base peak. Each sample was run in triplicate; reproducibility of chromatography between triplicate injections is shown by the three figures.
Fig. 4.

Example of typical low-/high-energy spectra (RT = 31.7 min.) from MS sample (sample 2). The upper spectrum represents low energy (10 eV). The lower spectrum represents high energy (15 eV-35 eV).
Combination of 2D-DIGE-MALDI-T0F MS and UPLC/Q-TOF MS
2D-DIGE analysis showed 39 different proteins identified with MALDI-TOF MS, whereas UPLC/Q-TOF MS analysis showed 68 different proteins between the MS and the ONDs groups. We compared the result of 2D-DIGE and UPLC/Q-TOF MS analysis and found that 23 proteins were common in the two methods, in which the overlap ratio was 27% (Fig. 5A), having the same regulation tendency. In particular, it was remarkable that the former 13 proteins (from No. 1 to No. 13 in Table 2) were identified by the two methods. 2D-DIGE has a higher sensitivity in separation of basic and low-molecular-weight proteins compared with UPLC, while the latter has the advantage of separation without limit in isoelectric point (pi) and mass and it is especially suited for the analysis of acid and higher-molecular-weight proteins (Fig. 5B and C). Therefore, an optimal separation effect could be achieved by means of the combination of these two technologies.
Fig. 5.

Distribution of the biochemical properties of proteins identified with 2D-DIGE and UPLC/Q-TOF MS. (A) The overlap of proteins identified by each technology, 27% (shade) of identifications were common to all, 19% (black) were by 2D-DIGE and 54% (grey) were by UPLC/Q-TOF MS. (B) pI of the protein identifications over increments of 1.0 units of the proteins separated by either 2D-DIGE (black bars) or UPLC/Q-TOF MS (grey bars). Identifications following 2D-DIGE revealed clustering of protein pi values between 8.0–9.0 and 9.0–10.0, whereas proteins identified following UPL/Q-TOF MS tended to be shifted toward lower pI values. (C) Molecular mass distribution over 10-kD increments of the proteins identified by 2D-DIGE and UPLC/Q-TOF MS. Identifications following 2D-DIGE revealed clustering of protein molecular mass values between 10 and 70 kD, whereas proteins identified following UPLC/Q-TOF MS tended to be shifted toward higher-molecular-mass values.
Verification of differential expressed proteins by ELISA
For one candidate protein, cystatin C, we measured the CSF concentrations in another two batches of CSF samples. The level of cystatin C in the MS group was (4.17 ± 3.62 mg/l), which was lower than (6.33 ± 4.91 mg/l) in the ONDs group (P< 0.01). The result of expression change of cystatin C between the two groups was consistent with 2-DIGE and UPLC-Q/TOF MS results (Fig. 6).
Fig. 6.

ELISA results of CSF The left column represents the cystatin C concentrations of MS CSF (4.17 ± 3.62 mg/l) and the right represents the concentrations of ONDs CSF (6.33 ± 4.91 mg/l). Statistical differences are indicated as P < 0.01.
Networks and function analysis using MetaCore
Twenty-four of the 26 uploaded proteins were brought together in the networks map with the shortest paths of interactions using the shortest-path algorithm (Fig. 7). The differentially expressed proteins were mostly involved in the processes of cell organization, biosynthesis and metabolism, which were related to CNS disorders or neural growth, transport or binding, anti-inflammatory processes related to immune system, transport of lipoproteins and non-phosphorylated modifier and signal transfer. In total, 25% of the proteins are relative to anti-inflammatory processes (Fig. 8). Interrelations between some proteins and their functions were analysed, allowing for the differential protein expressions.
Fig. 7.

Biological network analysis of differentially expressed proteins using MetaCore mapping tool. The network was generated using the shortest-path algorithm to map interaction between the 24 proteins (26 proteins were uploaded). Nodes represent proteins; lines between the nodes indicate direct protein-protein interaction.
Fig. 8.

Classification of the proteins with more than 1.5-fold difference identified by 2D-DIGE or UPLC/Q-TOF MS into molecular functions.
Discussion
Currently, no single proteomic technology has sufficient analytical power to allow for the detection of an entire proteome of an organelle, cell, or tissue and the CSF [20]. The combination of different technologies can be used to expand proteome coverage and define biologically relevant protein changes.
Relative quantification can provide information regarding protein abundance changes between the two conditions [21]. 2-DE is a classical proteomic technology that separates intact proteins on the basis of their pi and molecular weight. However, it has a practical dynamic range of 104 orders of magnitude [22], which is relatively narrower than the dynamic range of protein in the CSF. This restricts the analysis of a proteome within narrow limits. As a result, it is difficult to represent proteins with extreme hydropho-bicity, mass, or pi. 2D-DIGE was a two-dimensional electrophoresis to which an internal standard was added and scanned by Cy dyes fluorochrome and it had the same shortcoming as described above. UPLC coupled with Q-TOF MS (UPLC/Q-TOF MS) is a powerful proteomic tool to separate and identify peptide mixtures with a wonderful reproducibility and is capable of obtaining rapidly and effectively proteomic parametric profiles [19]. However, a lower resolution and a lower throughput than 2-DE were the shortcomings of the technology.
In the present study, 2D-DIGE and UPLC/Q-TOF MS were utilized to quantitatively analyse the differential proteomic expression in the CSF between patients with MS and the ONDs group. 2D-DIGE is much more accurate than conventional 2-DE because of the participation of an internal standard to analyse the proteomic changes. 2D-DIGE can minimize gel-to-gel variance and quantify protein levels between samples [9]. Consequently, it has recently been validated as a powerful tool for the differential expression of proteins [10, 11]. In UPLC/Q-TOF MS investigation, we used a tryptic digest of two samples spiked with a standard protein mixture (enolase, ADH and glycogen phosphorylase) to observe and correct the different behaviours in the signals from digested peptides corresponding to the protein concentrations experimentally configured. A relative quantitative analysis of the differential expression of proteins in MS CSF showed the same tendency in the two technologies.
In this study, 26 uploaded proteins showed significant differential expressions between the two groups, in which some proteins have been reported in MS [6, 23]. It was reported that the depletion of high-abundance proteins such as immunoglobulin G (IgG) could enrich low-abundance proteins concentration to enhance the sensitivity of the experiment. However, it could also lose some low-abundance proteins simultaneously. For this reason, we used natural, untreated CSF samples, which can reflect the actual protein information of the CSF
One of the most prominent regulatory proteins in the networks is ubiquitin, which interacts with other 14 factors, including cas-pase-3, IRF8, c-fos, SREBP2, SREBP1, P63, P7, E2A, ESR2, STAT1, c-jun and STAT5A. Ubiquitin has been shown to have anti-inflammatory properties and a therapeutic potential after severe trauma and brain injuries in recent studies [24]. The ubiquitin pro-teasome pathway is a key regulator of homeostasis within cells, degrading misfolded or redundant proteins and also those involved in mediating transcription, cell cycle progression and apoptosis [25]. Our quantitation research previously mentioned showed that ubiquitin down-regulated in the MS group.
In the CNS, cystatin C is localized in the glial cells and neurons and is mostly synthesized in the human CSF by the choroid plexus and leptomeningeal cells [26]. It is considered that there are some relationship between crystatin C in CSF and disease of the nervous system. In our study, quantitation of cystatin C, including ELISA, 2D-DIGE and UPLC-Q/TOF MS, showed decrease in the MS group. Cystatin C is the inhibitor of cysteine proteases [27]. It could be regulated by ubiquitin through IRF8 in the networks. Caspases, the intracellular cysteine proteases, which showed an association with ubiquitin in the network map, are essential for the regulation of apoptosis and are considered as potential targets for the treatment of MS [28]. Caspase-3 activity is induced by the CSF in MS patients and its inhibitors can protect neuronal cells from apoptosis [29].
Moreover, the network map revealed that caspase-3 has an influence on nuclear factor κB (NF-κB) through gelsolin. First, ourquantitation research showed a decrease of gelsolin in the MS group. This result provided an evidence on the other side for the report that gelsolin overexpression would attenuate T-cell signalling to activation [30], since MS is a chronic inflammatory demyelinating disease [31]. Second, NF-κB is an important nuclear factor that takes part in the inflammatory reaction, the immune reaction and the expression of cytokine, adhesion molecule and correlated acceptors [32].
NF-κB is not only regulated by caspase-3 but also regulated by transthyretin (TTR), which shows a decrease in our quantitation research by both DIGE and UPLC. TTR is a component of the network that determines thyroid hormone (TH) distribution. It is well established that TH is required for the normal timing of differentiation and maturation of oligodendrocyte precursor cells (OPCs), the most important source of remyelinating oligodendrocytes in the adult CNS [33]. It is reported that TH enhances and accelerates remyelination in an experimental model of chronic demyelination [34]. Our result confirmed this idea.
The transport protein apolipoprotein (ApoE) has been associated with clinical features of MS [35]. Our research revealed that ApoE decreased in the MS group. The networks showed that ApoE could effect ubiquitin through FGFR1, FRS2, GRB2, c-CBI and c-Fos and could be regulated by FGF2. ApoE is considered as a neurotrophic factor, thus any decrease in intrathecal ApoE synthesis may contribute to the progression of the disease [23].
Otherwise, there were some proteins that we did not find in the networks map but they are still very important. High expression of Ig kappa-chain C region and Ig lambda-chain C region was found in the MS group. It was reported that intrathecally generated Igs. specifically IgG, are found in 95% of MS patients [36].
Vitamin D-binding protein (DBP) is known to function as an immunomodulatory factor as well as the main carrier of vitamin D [37]. Vitamin D is an immune modulator, but whether it can be considered as a disease modulator in MS remains uncertain. Nevertheless, it is a good reason for further research in this direction [38]. What is more, DBP was analysed for linkage or association with MS in some population [39, 40]. Our research showed a valuable information for the Chinese population that DBP decreased in the MS group analysed by both 2D-DIGE and UPLC/Q- TOF MS.
Conclusion
Proteomic studies in MS have been shown to identify new processes contributing to disease pathology and also biomarkers for the early diagnosis and monitoring of MS patients [41]. In our study, 2D-DIGE and UPLC/Q-TOF MS were both relatively accurate quantitative technologies, with an additional internal standard at the stage of separation from intact proteins to peptides, for the study of the differential proteomic expression in MS CSF. The data showed a better overlap, in which the abundance change of proteins had the same tendency. The protein separation methods described very significantly the coverage of MS CSF proteome. Furthermore, using the combination of 2D-DIGE and UPLC-Q/TOF MS system, we were capable of identifying proteins unobserved by previous study with traditional ways. Identified by the combination of the two methods, the differential expression of proteins which are specifically up- or down-regulated in patients with MS may provide as disease-related protein to aid in both the diagnosis and the treatment of MS.
Acknowledgments
This work was sponsored by grants from Affiliated Qilu Hospital Shandong University, Jinan. We thank Affiliated Qilu Hospital for collecting CSF samples. We also acknowledge Waters Corporation for its instruments. We acknowledge Ms. Jiesheng Mo for critical review and editing of the manuscript. Finally we also acknowledge GeneGo for providing access to the MetaCore software suite and John Metz for technical assistance in using the software.
Supporting Information
Additional Supporting Information may be found in the online version of this article:
Fig. S1. Statistical check of data quality. (A)Retention time reproducibility. (B) Mass precision.(C) Replication level. (D) Ion intensityreproducibility. The relative standard deviation (RSD) (error) ofsample 1 was 3.0%, while that of sample 2 was2.7%.
This material is available as part of the online article from: http://www.blackwell-synergy.com/doi/abs/10.1111/j.1582-4934.2009.00850.x (This link will take you to the article abstract).
Please note: Wiley-Blackwell are not responsible for the content or functionality of any supporting information supplied by the authors. Any queries (other than missing material) should be directed to the corresponding author for the article.
References
- 1.Hafler DA. Multiple sclerosis. J Clin Invest. 2004;113:788–94. doi: 10.1172/JCI21357. [DOI] [PMC free article] [PubMed] [Google Scholar]
- 2.Noseworthy JH, Lucchinetti C, Rodriguez M, Weinshenker BG. Multiple sclerosis. N EnglJMed. 2000;343:938–52. doi: 10.1056/NEJM200009283431307. [DOI] [PubMed] [Google Scholar]
- 3.Polman CH, Reingold SC, Edan G, et al. Diagnostic criteria for multiple sclerosis: revisions to the “McDonald Criteria”. Ann Neurol. 2005;58:840–6. doi: 10.1002/ana.20703. [DOI] [PubMed] [Google Scholar]
- 4.Spielman RS, Nathanson N. The genetics of susceptibility to multiple sclerosis. Epidemiol Rev. 1982;4:45–65. doi: 10.1093/oxfordjournals.epirev.a036251. [DOI] [PubMed] [Google Scholar]
- 5.Gilden DH, Devlin ME, Burgoon MR, Owens GP. The search for virus in multiple sclerosis brain. Mult Scler. 1996;2:179–83. doi: 10.1177/135245859600200403. [DOI] [PubMed] [Google Scholar]
- 6.Hammack BN, Fung KY, Hunsucker SW, et al. Proteomic analysis of multiple sclerosis cerebrospinal fluid. Mult Scler. 2004;10:245–60. doi: 10.1191/1352458504ms1023oa. [DOI] [PubMed] [Google Scholar]
- 7.Gorg A, Weiss W, Dunn M. Current two-dimensional electrophoresis technology for proteomics. J Proteomics. 2004;4:3665–85. doi: 10.1002/pmic.200401031. [DOI] [PubMed] [Google Scholar]
- 8.Beerelli S. Proteomics strategy based on liquid-phase IEF and 2D-DIGE: application to bone marrow mesenchymal progenitor cells. Proteomics. 2007;7:1984–99. doi: 10.1002/pmic.200600868. [DOI] [PubMed] [Google Scholar]
- 9.Karp NA, Lilley KS. Maximizing sensitivity for detecting changes in protein expression: experimental design using minimal CyDyes. Proteomics. 2005;5:3105–15. doi: 10.1002/pmic.200500083. [DOI] [PubMed] [Google Scholar]
- 10.Unlu M, Morgan ME, Minden JS. Difference gel electrophoresis: a single gel method for detecting changes in protein extracts. Electrophoresis. 1997;18:2071–7. doi: 10.1002/elps.1150181133. [DOI] [PubMed] [Google Scholar]
- 11.Alban A, David SO, Bjorkesten L, Andersson C. A novel experimental design for comparative two-dimensional gel analysis: two-dimensional difference gel electrophoresis incorporating a pooled internal standard. Proteomics. 2003;3:36–44. doi: 10.1002/pmic.200390006. [DOI] [PubMed] [Google Scholar]
- 12.Yin P, Zhao X, Li Q, Wang J, Li J, Xu G. Metabonomics study of intestinal fistulas based on ultraperformance liquid chro-matography coupled with Q-TOF mass spectrometry (UPLC/Q-TOF MS) JProteome Res. 2006;5:2135–43. doi: 10.1021/pr060256p. [DOI] [PubMed] [Google Scholar]
- 13.McDonald Wl, Compston A, Edan G, et al. Recommended diagnostic criteria for multiple sclerosis: guidelines from the International Panel on the Diagnosis of Multiple Sclerosis. Ann Neurol. 2001;50:121–7. doi: 10.1002/ana.1032. [DOI] [PubMed] [Google Scholar]
- 14.Yuan X, Russell T, Wood G, Desiderio DM. Analysis of the human lumbar cerebrospinal fluid proteome. Electrophoresis. 2002;23:1185–96. doi: 10.1002/1522-2683(200204)23:7/8<1185::AID-ELPS1185>3.0.CO;2-G. [DOI] [PubMed] [Google Scholar]
- 15.Neuhoff V, Arold N, Taube D, Ehrhardt W. Improved staining of proteins in polyacrylamide including isoelectric focusing gels with clear background at nanogram sensitivity using Coomassie brilliant blue G-250 and R-250. Electrophoresis. 1988;9:255–62. doi: 10.1002/elps.1150090603. [DOI] [PubMed] [Google Scholar]
- 16.Yu YQ, Gilar M, Lee PJ, et al. Enzyme-friendly, mass spectrometry-compatible surfactant for in-solution enzymatic digestion of protein. Anal Chem. 2003;75:6023–8. doi: 10.1021/ac0346196. [DOI] [PubMed] [Google Scholar]
- 17.Vissers JP, Langridge Jl, Aerts JM. Analysis and quantification of diagnostic serum markers and protein signatures for Gaucher disease. Mol Cell Proteomics. 2007;6:755–66. doi: 10.1074/mcp.M600303-MCP200. [DOI] [PubMed] [Google Scholar]
- 18.You JS, Gelfanova V, Knierman MD, et al. The impact of blood contamination on the proteome of cerebrospinal fluid. J Proteomics. 2005;5:290–6. doi: 10.1002/pmic.200400889. [DOI] [PubMed] [Google Scholar]
- 19.Silva JC, Denny R, Dorschel CA, et al. Quantitative proteomic analysis by accurate mass retention time pairs. Anal Chem. 2005;77:2187–200. doi: 10.1021/ac048455k. [DOI] [PubMed] [Google Scholar]
- 20.McDonald T, Sheng S, Stanley B, et al. Expanding the subproteome of the inner mitochondria using protein separation technologies: one- and two-dimensional liquid chromatography and two-dimensional gel electrophoresis. Mol Cell Proteomics. 2006;5:2392–411. doi: 10.1074/mcp.T500036-MCP200. [DOI] [PubMed] [Google Scholar]
- 21.Wiener MC, Sachs JR, Deyanova EG, Yates NA. Differential mass spectrometry: a label-free LC-MS method for finding significant differences in complex peptide and protein mixtures. Anal Chem. 2004;76:6085–96. doi: 10.1021/ac0493875. [DOI] [PubMed] [Google Scholar]
- 22.Van Den Bergh G, Arckens L. Recent advances in 2D electrophoresis: an array of possibilities. Expert Rev Proteomics. 2005;2:243–52. doi: 10.1586/14789450.2.2.243. [DOI] [PubMed] [Google Scholar]
- 23.Lehmensiek V, Siissmuth SD, Tauscher G, et al. Cerebrospinal fluid proteome profile in multiple sclerosis. Mult Scler. 2007;13:840–9. doi: 10.1177/1352458507076406. [DOI] [PubMed] [Google Scholar]
- 24.Griebenow M, Casalis P, Woiciechowsky C, et al. Ubiquitin reduces contusion volume after controlled cortical impact injury in rats. JNeurotrauma. 2007;24:1529–35. doi: 10.1089/neu.2007.0306. [DOI] [PubMed] [Google Scholar]
- 25.Popat R, Joel S, Oakervee H, Cavenagh J. Bortezomib for multiple myeloma. Expert Opin Pharmacother. 2006;10:1337–46. doi: 10.1517/14656566.7.10.1337. [DOI] [PubMed] [Google Scholar]
- 26.Sanchez JC, Guillaume E, Lescuyer P, et al. Cystatin C as a potential cerebrospinal fluid marker for the diagnosis of Creutzfeldt-Jakob disease. Proteomics. 2004;4:2229–33. doi: 10.1002/pmic.200300799. [DOI] [PubMed] [Google Scholar]
- 27.Grzonka Z, Jankowska E, Kasprzykowski F, et al. Structural studies of cysteine proteases and their inhibitors. Ada Biochim Pol. 2001;48:1–20. [PubMed] [Google Scholar]
- 28.Thornberry NA, Lazebnik Y. Caspases: enemies within. Science. 1998;281:1312–6. doi: 10.1126/science.281.5381.1312. [DOI] [PubMed] [Google Scholar]
- 29.Cid C, Alvarez-Cermeno JC, Regidor I, et al. Caspase inhibitors protect against neuronal apoptosis induced by cerebrospinal fluid from multiple sclerosis patients. Journal of Neuroimmunology. 2003;136:119–24. doi: 10.1016/s0165-5728(02)00467-8. [DOI] [PubMed] [Google Scholar]
- 30.Morley SC, Sung J, Sun GP, et al. Gelsolin overexpression alters actin dynamics and tyrosine phosphorylation of lipid raft-associated proteins in Jurkat T cells. Mol Immunol. 2006;44:2469–80. doi: 10.1016/j.molimm.2006.09.024. [DOI] [PMC free article] [PubMed] [Google Scholar]
- 31.Pender MP. Genetically determined failure of activation-induced apoptosis of autore-active T cells as a cause of multiple sclerosis. Lancet. 1998;351:978–81. doi: 10.1016/S0140-6736(05)60642-3. [DOI] [PubMed] [Google Scholar]
- 32.Ghosh S, May MJ, Kopp EB. NF-kappa B and Rel proteins: evolutionary conserved mediators of immune responses. Annu Rev Immunol. 1998;16:225–60. doi: 10.1146/annurev.immunol.16.1.225. [DOI] [PubMed] [Google Scholar]
- 33.D’Aguanno S, Barassi A, Lupisella S, et al. Differential cerebrospinal fluid proteome investigation of Leber hereditary optic neuropathy (LHON) and multiple sclerosis. J Neuroimmunol. 2008;193:156–60. doi: 10.1016/j.jneuroim.2007.10.004. [DOI] [PubMed] [Google Scholar]
- 34.Fernandez M, Giuliani A, Pirondi S, et al. Thyroid hormone administration enhances remyelination in chronic demyelinating inflammatory disease. Proc Natl Acad Sci USA. 2004;101:16363–8. doi: 10.1073/pnas.0407262101. [DOI] [PMC free article] [PubMed] [Google Scholar]
- 35.Pinholt M, Frederiksen JL, Andersen PS, Christiansen M. ApoE in multiple sclerosis and optic neuritis: the apoE-epsilon4 allele is associated with progression of multiple sclerosis. Mult Scler. 2005;11:511–5. doi: 10.1191/1352458505ms1207oa. [DOI] [PubMed] [Google Scholar]
- 36.D’Aguanno S, Del Boccio P, Bernardini S, et al. Electrophoretic separations of cerebrospinal fluid proteins in clinical investigations. Chem Lab Med. 2007;45:437–49. doi: 10.1515/CCLM.2007.106. [DOI] [PubMed] [Google Scholar]
- 37.Niino M, Kikuchi S, Fukazawa T, et al. No association of vitamin D-binding protein gene polymorphisms in Japanese patients with MS. J Neuroimmunol. 2002;127:177–9. doi: 10.1016/s0165-5728(02)00099-1. [DOI] [PubMed] [Google Scholar]
- 38.Smolders J, Damoiseaux J, Menheere P, Hupperts R. Vitamin D as an immune modulator in multiple sclerosis: a review. J Neuroimmunol. 2008;194:7–17. doi: 10.1016/j.jneuroim.2007.11.014. [DOI] [PubMed] [Google Scholar]
- 39.Steckley JL, Dyment DA, Sadovnick AD, et al. Genetic analysis of vitamin D related genes in Canadian multiple sclerosis patients. Canadian Collaborative Study Group. Neurology. 2000;54:542–4. doi: 10.1212/wnl.54.3.729. [DOI] [PubMed] [Google Scholar]
- 40.Tajouri L, Ovcaric M, Curtain R, et al. Variation in the vitamin D receptor gene is associated with multiple sclerosis in an Australian population. J Neurogenet. 2005;19:25–38. doi: 10.1080/01677060590949692. [DOI] [PubMed] [Google Scholar]
- 41.Quintana FJ, Farez MF, Weiner HL. Systems biology approaches for the study of multiple sclerosis. J Cell Mol Med. 2008;12:1087–93. doi: 10.1111/j.1582-4934.2008.00375.x. [DOI] [PMC free article] [PubMed] [Google Scholar]
Associated Data
This section collects any data citations, data availability statements, or supplementary materials included in this article.