

Abstract
Although apolipoprotein E (ApoE) polymorphism is associated with variable risks of several illnesses, and with mortality, no persuasive relationship has been demonstrated with frailty. Here, the clinical examination cohort (n= 1452 older adults, aged 70+ years at baseline) of the Canadian Study of Health and Aging was evaluated, with 5-year follow-up data. Frailty was defined using both the phenotypic definition from the Cardiovascular Health Study (Frailty-CHS) and the ‘Frailty Index’, from which age-specific trajectories of deficit accumulation can be estimated. In age-sex adjusted analyses, people with ApoE 4 allele had a higher risk of death (hazard ratio [HR]= 1.20; 95% confidence interval: 1.01–1.45), but this relationship was not significant when adjusted for cognitive impairment (1.06; 95% confidence interval: 0.88–1.27). There was no association between frailty and ApoE polymorphism, defined in age-sex adjusted models either as Frailty-CHS (ApoE4 HR 1.17; 95% confidence interval: 0.98–1.40, frailty HR 1.37; 95% confidence interval: 1.28–1.46) or by the Frailty Index (ApoE4 HR 1.07; 95% confidence interval: 0.90–1.29, frailty HR 35.3; 95% confidence interval: 20.4–61.1). The data do not support an association between ApoE polymorphism and frailty. This result did not depend on how frailty was defined.
Keywords: ApoE polymorphism, aging, mortality, frailty
Introduction
Apolipoprotein E (ApoE) is a 299 amino acid plasma glycoprotein that plays a major role in lipoprotein metabolism. The ApoE gene, found on chromosome 19, has three common alleles, e2, e3, e4. ApoE allelic variation is implicated in many common illnesses. These notably include variable risks for Alzheimer's disease [1], general cognitive decline [2], coronary heart disease [3–4] and possibly other chronic conditions [5]. These illnesses, in turn, are each associated with an increasing risk of death. While the results of individual studies show some variation, a recent systematic review suggests that e4/4 is generally associated with a moderately high relative risk of death, and that even one copy of the e4 allele is associated with an increased mortality risk in some populations [6].
If ApoE polymorphism is associated with common, often disabling illnesses, and with mortality, we considered that it might also be linked to frailty. This possibility has received little investigation. Although ApoE 4 has been described as a ‘frailty gene’ not a ‘longevity gene’[7], frailty in that study was defined in relation to an observed (but otherwise unexplained) variability in the hazard rate. Our inquiry is also motivated by the desire to understand how frailty might be defined. For now, there are two somewhat different approaches to defining frailty [8]. Each definition sees frailty as a state of low reserves (of energy, physical ability and health) that jointly give rise to vulnerability [9, 10]. The so-called ‘phenotypic’ definition of frailty used in the Cardiovascular Health Study (Frailty-CHS) [11] defines a syndrome according to the presence of three of more specified characteristics, as detailed below. By contrast, the Frailty Index [12] counts the proportion of a much larger number of characteristics that are present in an individual without privileging some features over others. Typically, about 40 items are measured, but the range is from about 20 to more than 100 [13]. Elsewhere, we have compared the Frailty-CHS definition with a 70-item Frailty Index (14). Briefly, we showed that the definitions were moderately well correlated with each other (R= 0.65) and that each showed higher mortality with greater frailty, but that they were not strictly comparable. In short, analyses of frailty should consider just how the definition of frailty might influence the results. Here, we aim to contribute to the understanding of how ApoE variation influences health in late life. Our objectives were to determine: (1) if frailty varies by ApoE allele status, and (2) if the relationship between frailty and ApoE varies by how frailty is defined. Given that individual samples show some variability in the relationship between ApoE and mortality, we first investigated whether mortality varied by ApoE allele status in this sample.
Materials and methods
Study setting, population and design
The data come from the clinical examination cohort of people in the second wave of the Canadian Study of Health and Aging (CSHA-2) [9, 14, 15]. The participants in the inception cohort (CSHA-1) were a representative sample of community-dwelling (n= 9008) and institutionalized (n= 1255) older Canadians aged 65 and older. Those individuals who had screened positive for cognitive impairment at CSHA-1 (n= 350) or CSHA-2 (n= 987) were eligible for a clinical examination at CSHA-2. A score ≤ 77 on the Modified Mini-Mental State Examination (3MS) [16] was considered positive for cognitive impairment and people with such scores were invited to a clinical examination. Through a multi-stage process (standardized history by a nurse, clinical and neuropsychological evaluations and a case conference [17]), participants were diagnosed as having either dementia, according to DSM-III-R criteria [18]‘cognitive impairment, no dementia’–CIND [19] or no cognitive impairment (NCI). Additionally, a sample of those who screened negative on the 3MS was examined as a comparison group. While 2305 people had clinical examinations, sufficient data to reconstruct both frailty definitions, together with ApoE information, was available for only 1452.
Calculation of the Frailty Index
The Frailty Index assumes that the more deficits that individuals accumulate, the more likely they are to be frail [13] so that instead of considering specific deficits individually, the index measures their total number [12]. Specifically, the Frailty Index is calculated as the proportion of deficits present in an individual. Its value is defined as the fraction x/n, where x is the number of deficits for a given individual, and n is the total number of variables. Each variable can be dichotomized as either ‘1’ if the deficit is present or ‘0’ if it is absent. The average Frailty Index for a given age is found by calculating the arithmetic mean of the individual values at that age. This approach has been cross-validated by our group in multiple samples [20], and by others [21, 22]. Here the Frailty Index was calculated from all available dichotomized variables (n = 70) [http://myweb.dal.ca/amitnits/CSHAclinical-variables.gif][Appendix]. The items can be self-reported, or come from variables form the clinical examination, or formal tests performed with standardized scales. Note that several deficits tallied here relate to cognition.
The Frailty-CHS definition
Elsewhere [14, 23], we have used the CSHA-2 clinical sample to compare mortality outcomes between the Frailty-CHS definition [11] and the Frailty Index [12], using all CSHA-2 clinical examination participants (and not just those for whom ApoE allele status is known). As detailed in those reports – and as is the case here – operationalization of the Frailty-CHS definition used variables close to those employed in other phenotypic definition studies [24, 25]. Weight loss was defined as loss of either ≥ 10 pounds or ≥ 5% of body-weight in the past year. Exhaustion (poor endurance and energy) was based on self-report of feeling ‘tired all the time’. Low physical activity level was operationalized as needing assistance with walking or being unable to walk. Slowness was defined as ≥ 19 sec. on the timed up and go (TUG) test [26]. Weakness was equated with clinically detected abnormal strength on physical examination. People were said to be ‘robust’ when none of the five items was present, ‘frail’ if three or more were present and ‘pre-frail’ otherwise.
Analysis of apolipoprotein E genotypes
ApoE genotypes were identified as described elsewhere [27] using standard laboratory two methods [28, 29]. Confirmation of the results of the first analysis was done using the second method.
Statistical analysis
After describing the sample, we analyzed differences in mortality and frailty by both ApoE gene variation and by ApoE gene dose (i.e. 0, 1 or 2 alleles). To determine if mortality varies by ApoE allele status (Preliminary Objective), survival curves were constructed, using Cox regression after verifying the proportionality assumption, from which hazard ratios were calculated. In this way, we evaluated the influence of age, sex and ApoE status on survival. Cox models included ApoE4 gene dose, adjusted for age and sex, with further (separate) adjustment for cognitive status. To evaluate the impact of ApoE status on frailty (Objective 1), we compared ApoE status by frailty status and further stratified by cognitive status. To see whether the result depended on how frailty was defined (Objective 2), we tested each definition separately. Specifically, the Frailty Index values were graphed against age in relation to the ApoE. The significance of differences in the Frailty Index values by ApoE genotype were estimated using ANOVA, and in distributions of the frailty index by ApoE genotype using Kolmogorov-Smirnov test. Chi-square analyses were conducted for group differences by the Frailty-CHS definition.
Ethics
The CSHA protocol was approved by the research Ethics Committee of each participating institution. All participants gave written, informed consent, with additional consent for genetic testing. The proposal for secondary analyses was approved by the research Ethics Committee of the Capital District Health Authority.
Results
Baseline characteristics
Of the 1452 people with ApoE genotype data, 863 (59%) were women. Over the 5 years of follow-up, 558 people died (38%) and 153 were institutionalized (11%). Themean age of the sample was 85.5 (6.9) years (women) and 83.0 (6.5) (men); most people (910; 63%) had the ApoE ε3/ε3 genotype. The ApoE ε3/ε4 genotype was present in 303 people (21%), and 4/4 in 16 (1%). ApoE ε2 alleles were least common: ε2/ε2 was observed in 13 people, ε2/ε3 in 177 and ε2/ε4 in 33, together comprising 15% of participants. (With respect to the ApoE ε4 allele dose, 1100 [76%] had no ε4 allele, 336 [23%] had 1ε4 allele and 16 [1%] had 2ε4 alleles.) At baseline, the age and sex of people with and without an ApoE ε4 allele varied little. Women made up 58% of the ApoE4 carriers and 64% of those who were not ApoE ε4 carriers. The mean age for those with ApoE ε4 was 84.6 (7.4) years (women) and 82.9 (6.2) (men). At all ages, most people had the ApoE ε3/ε3 genotype, with little variation in the prevalence of the various ApoE alleles by age (Fig. 1A).
Fig. 1.
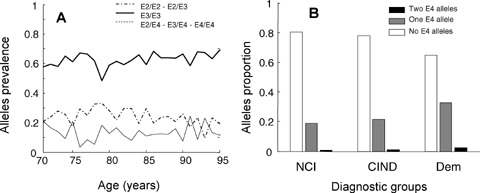
Characteristics of the sample. Panel A: age-specific prevalence of ApoE alleles. The solid line corresponds to ε3/ε3 (n= 435), the dashed line to ApoE4 (ε2/ε4, ε3/ε4, ε4/ε4, n= 127) and the dot-dashed line to ApoE2 (ε2/ε2 and ε2/ε3, n= 89). Panel B: Relationship between the number of ApoE ε4 alleles (0,1,2) and cognitive diagnoses – No Cognitive Impairment (NCI, n= 651), Cognitive Impairment, No Dementia (CIND, n= 447) and dementia (n= 354).
Variation in ApoE alleles was most evident with respect to cognitive diagnoses. Of the 1452, 651 had NCI (45%), 447 were diagnosed with CIND (38%) and 354 with dementia (24%). Proportionately more cognitive impairment (either CIND or dementia) had at least one ApoE ε4 allele, although most people with cognitive impairment did not carry the ApoE ε4 allele (Fig. 1B).
ApoE and mortality
For each genotype, people with cognitive impairment had significantly worse survival than those who did not (data not shown).
Across genotypes, people with NCI survived longest, those with dementia survived least and those with CIND had survival profiles in between the other two. In Cox regression analyses age (HR = 1.08; 95% confidence interval: 1.06–1.09) female sex (HR = 0.63; 95% confidence interval: 0.52–0.74) and cognitive impairment (HR = 1.53; 95% confidence interval: 1.36–1.69), each significantly affected survival. ApoE4 status was associated with worse survival in an age-sex adjusted Cox model (HR = 1.20; 95% confidence interval: 1.01–1.45) (Fig. 2A), but this relationship was not significant when cognitive status was included in the model (HR = 1.06; 95% confidence interval: 0.88–1.27) (Fig. 2B).
Fig. 2.
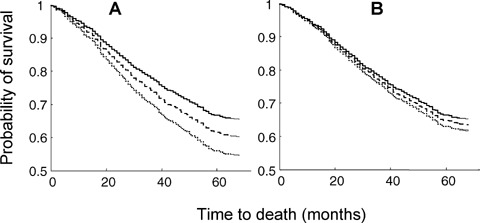
Survival in relation to the number of copies of the ApoE ε4 allele. In both Panels, the solid line corresponds to 0 ApoE ε4 alleles, the dashed line to 1 ApoE ε4 allele and the dotted line to 2 ApoE ε4 alleles. Panel A: adjusted for age and sex, the hazard ratios are significantly different from each other (P= 0.03). Panel B: adjusted for age, sex and cognitive impairment, the differences are no longer statistically significant (P= 0.45).
ApoE, frailty and its definition
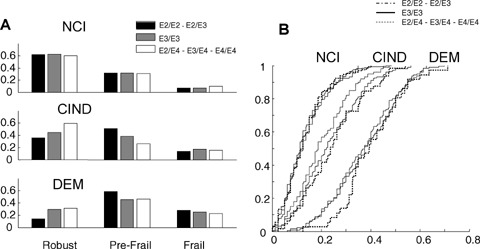
We discerned no relationship between frailty, however defined, and ApoE status (Fig. 3). Within the three Frailty-CHS groups, the differences in allelic proportions were neither significant nor was there an evident trend (Fig. 3A). Similarly, the cumulative distributions of the Frailty Index did not vary by ApoE status (Fig. 3B).
Fig. 3.
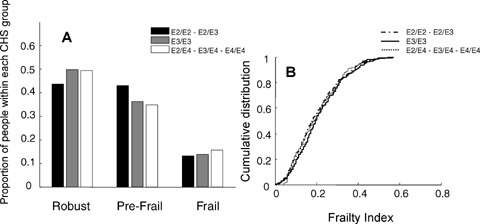
The relationship between ApoE alleles and frailty, according to the Frailty-CHS definition (Panel A) and the Frailty Index (Panel B).
Evaluating ApoE status and frailty in relation to age also revealed no relationship (Fig. 4). By the Frailty-CHS definition, the proportions of ApoE ε4 carriers and non-carriers within each group were similar for both younger (ages 70–79; Fig. 4A) and older (ages 80+, Fig. 4B) participants. Similarly, although the mean value of the Frailty Index increased with age, there was no difference inthe change with age by ApoE status (Fig. 4C).
Fig. 4.
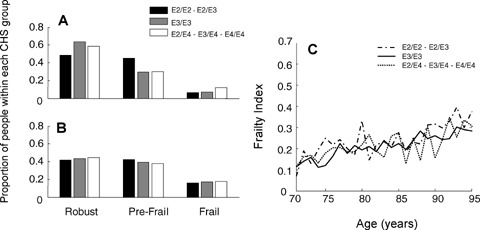
The relationship between ApoE alleles, frailty and age, according to the Frailty-CHS definition (Panel A, for people age 70–79; Panel B, for people aged 80) and the Frailty Index (Panel B).
Given the relationship between age, sex, ApoE and mortality in relation to cognition, the relationship between genotype, frailty and cognitive impairment is of interest. For each ApoE genotype, increasing cognitive impairment was significantly associated with worse frailty, defined either by the Frailty-CHS approach (Fig. 5A) or the Frailty Index (Fig. 5B).
Fig. 5.
Frailty in relation to ApoE allele and the degree of cognitive impairment. Panel A shows the sample divided by cognitive status (upper third, No Cognitive Impairment, middle third, Cognitive Impairment no Dementia (CIND), and lower third dementia) according to the Frailty-CHS groupings of robust, pre-frail and frail. Panel B shows the cumulative distributions of the Frailty Index values in relation to the degree of cognitive impairment and ApoE genotype.
In general, the absence of a relationship between frailty and ApoE genotype was not a result of how frailty is defined (Fig. 6). People defined as robust by the CHS definition had the lowest mean frailty index scores, and those defined as frail by the CHS definition had the highest frailty index scores, but there was no significant within-frailty group difference in the distribution of the ApoE alleles.
Fig. 6.
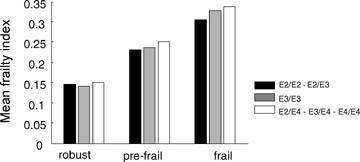
ApoE genotype in relation to mean frailty index values, cross-classified by the CHS frailty definition groups.
Discussion
We found no association between ApoE polymorphism and frailty, whether the latter was defined according to the Frailty-CHS definition [11] or to the Frailty Index [12]. Our findings offer some support for claims of a relationship between ApoE ε4 and death [6]. Even so, the lack of significance once cognition has been taken into account makes this suspect, so that our report accords more with recent investigations of survival in relation to ApoE polymorphism and the expression of cognitive impairment [30, 31].
Still, given the considerable degree of evidence that has supported a relation between the ApoE ε4 allele and mortality [6], no single study can be seen as definitive. Many factors impinge on the relationship between ApoE and mortality. For example, the failure to fully replicate the ApoE ε4-mortality association might reflect the study having been performed with people who were significantly older than those in some of the other samples, which found mortality differences between ApoE genotypes [6, 7]. On the other hand, the findings here are not too different from the lack of a statistically significant association was observed in a report in nonagenarians [32] or in the Nun study, in which the mean age was 84 [31]. In The Cache County Study, adjustment for AD reduced the risk of death for ApoE ε3/4 (HR = 1.13, 95% confidence interval = 0.99–1.30) and for ApoE ε4/4, although the latter remained significant (HR = 1.59, 95% confidence interval: 1.15–2.14) [33]. Still, it might be that some unspecified survivor effect swamps the influence of the deleterious effect of ApoE ε4 on mortality; evidence of a mortality crossover, which is not seen here, would support that. Such an effect, however, would have to be present for many years earlier to the mean age of 85 here, given that there was no association with deficit accumulation over any of the ages observed here. Equally, if an unspecified survivor effect were to obtain, the putative survival mechanism would appear to have to operate without regard to deficit accumulation, an intriguing possibility, but one that would go against late-life survival of the fittest [34]. Another reason to interpret our data with caution is that this population-based sample was taken from participants of the CSHA. The CSHA was designed to study dementia, so that people with dementia are relatively over-represented, making up 516 of the 1452 participants. As expected, their Frailty Index values were slightly higher (mean FI = 0.25 [0.13]versus mean FI = 0.21 [0.12] for the 936 without dementia [t = 5.76, P < 0.0001]). While further adjustment for both cognitive status and Frailty Index scores did not change the lack of association, adjusting for a factor that lies on the causal pathway might represent over-adjustment, another consideration in support of being cautious in interpretation. Similarly, while the focus here on all-cause ill health and mortality is indifferent to why people did not enjoy full health, a more mechanistic account would need to consider such effects. A more homogenous sample than ours might also allow the effects of specific phenotypes on specific disabilities, such as the ApoE e2 allele being present in men, but not women with instrumental activities of daily living dependency [35], or the link between ApoE4 and mobility impairment to be replicated [36]. Further considering the unrepresentativeness of the cohort, response bias must be considered. People who took part in genotyping tended to be healthier than those who were not genotyped (mean frailty index was 0.22 [0.12] for those 1452 who were genotyped, and 0.24 [0.13] for those who did not). If genotype gives rise to systematic differences in participation, this would bias the results. Finally, as this is a secondary analysis, the study does not have all potentially relevant variables. For example, there were no measurements of cholesterol, for which low levels have been associated with mortality in non-demented elderly people, and even proposed as a surrogate marker of frailty [37]. These results are of interest in relation to a report that evaluated the association of ApoE genotype on baseline cognitive functioning, cognitive decline and 5-year survival in a cohort of nonagenarians. They found no significant survival differences between ApoE genotypes [32], with perhaps the exception of people ‘whose functioning was relatively well preserved’ in whom the HR for e4 was 1.11 (95% confidence interval: 0.99–1.25). Similarly, a Greek study found that healthy active individuals aged 80 years and older were significantly less likely to have the ApoE4 genotype than were controls (Greek adults, median age 43; 3.1%versus 8.6%, P= 0.02) [38]. Here, however, the Frailty Index distributions did not show a difference at lower values of the FI (i.e. for healthier people) suggesting that such an effect is not present in this sample.
This study perhaps best contributes to understanding how to define frailty. Here, two markedly different approaches to defining frailty can be compared. One defines frailty specifically [11], the other emphasizes vulnerability arising from multiple problems [12]. Notably different between the two is how they handle cognition. The Frailty-CHS definition specifically excludes cognitive impairment (although whether ‘exhaustion’ has a cognitive component is debatable). The Frailty Index does not exclude cognitive variables. Even so, neither approach found an increased risk of frailty in patients with an ApoE ε4 allele, which suggests that it is not a ‘frailty gene’ in this population. This is intriguing; there are worse things than genetic effects, which increase mortality but not frailty. Such a result requires further replication before any conclusion can be drawn, and may be particularly relevant only for older, not younger samples.
How likely is it that a single gene would give rise to a state of non-specific vulnerability? It is clear both that single-gene disorders can have many manifestations and that various ApoE mutations can have pleiotropic effects [1–7]. More plausible than a single gene giving rise to frailty, however, is that explaining additional variance in late-life health status is likely to require a polygenic approach [39]. For example, in late-onset coronary heart disease, the role of ApoE ε4 appears to be played out in association with other genetic variants, such as peroxizome proliferators activated receptor γ2 Pro12 allele and endothelial nitric oxide synthase T-786C mutation [40]. For now, while these data suggest some relationship between the ApoE ε4 allele and mortality, there is no evident relationship between frailty and ApoE polymorphism.
Acknowledgments
These analyses were supported by the Canadian Institutes for Health Research (CIHR) operating grants MOP62823 and MOP64169. Kenneth Rockwood is supported by the CIHR through an investigator award and by the Dalhousie Medical Research Foundation (DMRF) as Kathryn Allen Weldon Professor of Alzheimer Research. Neither sponsor had any role in the design, methods, participants’ recruitment, data collections, analysis and preparation of paper. Each co-author asserts no proprietary interest in the result and no financial conflict of interest.
Appendix: List of variables used by the Canadian Study of Health and Aging to construct the 70-item CSHA Frailty Index from the Clinical Examination
| Changes in everyday activities | Mood problems | Seizures, partial complex |
|---|---|---|
| Head and neck problems | Feeling sad, blue, depressed | Seizures, generalized |
| Poor muscle tone in neck | History of depressed mood | Syncope or blackouts |
| Bradykinesia, facial | Bradykinesia, limbs | Headache |
| Problems getting dressed | Depression (clinical impression) | Cerebrovascular problems |
| Problems with bathing | Sleeping changes | History of stroke |
| Problems carrying out personal grooming | Restlessness | History of diabetes mellitus |
| Urinary incontinence | Memory changes | Arterial hypertension |
| Toileting problems | Short-term memory impairment | Peripheral pulses |
| Poor muscle bulk | Long-term memory impairment | Myocardial infraction |
| Rectal problems | Changes in general mental functioning | Arrhythmia |
| Gastrointestinal problems | Onset of cognitive symptoms | Congestive heart failure |
| Problems cooking | Clouding or delirium | Lung problems |
| History of Parkinson's disease | Paranoid features | Respiratory problems |
| Problems going out alone | History relevant to cognitive impairment or loss | History of thyroid disease |
| Impaired mobility | Family history relevant to cognitive impairment or loss | Thyroid problems |
| Musculoskeletal problems | Impaired vibration | Malignant disease |
| Tired all the time | Tremor at rest | Breast problems |
| Abnormal muscle tone in limbs | Postural tremor | Abdominal problems |
| Impaired limb coordination | Intention tremor | Presence of snout reflex |
| Impaired coordination, trunk | Suck reflex | Palmomental reflex |
| Poor standing posture | Family history of neurodegenerative disease | Other medical history |
| Irregular gait pattern | Falls | Cardiac problems |
| Skin problems | ||
References
- 1.Mahley RW, Weisgraber KH, Huang Y. Apolipoprotein E4: a causative factor and therapeutic target in neuropathology, including Alzheimer's disease. Proc Natl Acad Sci USA. 2006;103:5644–51. doi: 10.1073/pnas.0600549103. [DOI] [PMC free article] [PubMed] [Google Scholar]
- 2.Hsiung G-YR, Sadovnick AD, Feldman H. Apolipoprotein E-e4 genotype as a risk factor for cognitive decline and dementia: data from the Canadian Study of Health and Aging. CMAJ. 2004;17:863–7. doi: 10.1503/cmaj.1031789. [DOI] [PMC free article] [PubMed] [Google Scholar]
- 3.Song Y, Stampfer MJ, Liu S. Meta-analysis: apolipoprotein E genotypes and risk for coronary heart disease. Ann Intern Med. 2004;141:137–47. doi: 10.7326/0003-4819-141-2-200407200-00013. [DOI] [PubMed] [Google Scholar]
- 4.Licastro F, Chiappelli M, Caldarera CM, Tampieri C, Nanni S, Gallina M, Branzi A. The concomitant presence of polymorphic alleles of interleukin-1beta, interleukin-6 and apolipoprotein E is associated with an increased risk of myocardial infarction in elderly men. Results from a pilot study. Mech Ageing Dev. 2004;5:575–9. doi: 10.1016/j.mad.2004.06.008. [DOI] [PubMed] [Google Scholar]
- 5.Sudlow C, Martinez Gonzalez NA, Kim J, Clark C. Does apolipoprotein E genotype influence the risk of ischemic stroke, intracerebral hemorrhage, or subarachnoid hemorrhage? Systematic review and meta-analyses of 31 studies among 5961 cases and 17,965 controls. Stroke. 2006;37:364–70. doi: 10.1161/01.STR.0000199065.12908.62. [DOI] [PMC free article] [PubMed] [Google Scholar]
- 6.Ewbank DC. Differences in the association between apolipoprotein E genotype and mortality across populations. J Gerontol A Biol Sci Med Sci. 2007;62:899–907. doi: 10.1093/gerona/62.8.899. [DOI] [PubMed] [Google Scholar]
- 7.Gerdes LU, Jeune B, Ranberg KA, Nybo H, Vaupel JW. Estimation of Apolipoprotein E genotype-specific relative mortality risks from the distribution of genotypes in centenarians and middle aged men: apolipoprotein E gene is a “frailty gene,” not a “longevity gene.”. Genet Epidemiol. 2000;19:202–10. doi: 10.1002/1098-2272(200010)19:3<202::AID-GEPI2>3.0.CO;2-Q. [DOI] [PubMed] [Google Scholar]
- 8.Bergman H, Ferrucci L, Guralnik J, Hogan DB, Hummel S, Karunananthan S, Wolfson C. Frailty: an emerging research and clinical paradigm issues and controversies. J Gerontol A Biol Sci Med Sci. 2007;62:731–7. doi: 10.1093/gerona/62.7.731. [DOI] [PMC free article] [PubMed] [Google Scholar]
- 9.Rockwood K, Song X, MacKnight C, Bergman H, Hogan DB, McDowell I, Mitnitski A. A global clinical measure of fitness and frailty in elderly people. CMAJ. 2005;174:489–95. doi: 10.1503/cmaj.050051. [DOI] [PMC free article] [PubMed] [Google Scholar]
- 10.Walston J, Hadley EC, Ferrucci L, Guralnik JM, Newman AB, Studenski SA, Ershler WB, Harris T, Fried LP. Research agenda for frailty in older adults: toward a better understanding of physiology and etiology: summary from the American Geriatrics Society/National Institute on Aging Research Conference on Frailty in Older Adults. J Am Geriatr Soc. 2006;54:991–1001. doi: 10.1111/j.1532-5415.2006.00745.x. [DOI] [PubMed] [Google Scholar]
- 11.Fried LP, Tangen CM, Walston J, Newman AB, Hirsch C, Gottdiener J, Seeman T, Tracy R, Kop WJ, Burke G, McBurnie MA Cardiovascular Health Study Collaborative Research Group. Cardiovascular Health Study Collaborative Research Group. Frailty in older adults: evidence for a phenotype. J Gerontol A Biol Sci Med Sci. 2001;56:M146–56. doi: 10.1093/gerona/56.3.m146. [DOI] [PubMed] [Google Scholar]
- 12.Mitnitski AB, Mogilner AJ, Rockwood K. Accumulation of deficits as a proxy measure of aging. Sci World J. 2001;1:323–36. doi: 10.1100/tsw.2001.58. [DOI] [PMC free article] [PubMed] [Google Scholar]
- 13.Rockwood K, Mitnitski A. Frailty in relation to the accumulation of deficits. J Gerontol A Biol Sci Med Sci. 2007;62:722–7. doi: 10.1093/gerona/62.7.722. [DOI] [PubMed] [Google Scholar]
- 14.Rockwood K, Andrew MK, Mitnitski A. A comparison of two approaches to measuring frailty in elderly people. J Gerontol A Biol Sci Med Sci. 2007;62:738–43. doi: 10.1093/gerona/62.7.738. [DOI] [PubMed] [Google Scholar]
- 15.Canadian Study of Health and Aging. study methods and prevalence of dementia, 1994. CMAJ. 1994;150:899–913. [PMC free article] [PubMed] [Google Scholar]
- 16.Teng EL, Chui HC. The Modified Mini-Mental State (3MS) examination. J Clin Psychiatry. 1987;48:314–8. [PubMed] [Google Scholar]
- 17.Graham JE, Rockwood K, Beattie BL, McDowell I, Eastwood R, Gauthier S. Standardization of the diagnosis of dementia in the Canadian Study of Health and Aging. Neuroepidemiology. 1996;15:246–56. doi: 10.1159/000109914. [DOI] [PubMed] [Google Scholar]
- 18.American Psychiatric Association. Diagnostic and statistical manual. 3rd ed. Washington: APA Press; 1987. rev. [Google Scholar]
- 19.Ebly EM, Hogan DB, Parhad IM. Cognitive impairment in the nondemented elderly. Results from the Canadian Study of Health and Aging. Arch Neurol. 1995;52:612–9. doi: 10.1001/archneur.1995.00540300086018. [DOI] [PubMed] [Google Scholar]
- 20.Mitnitski AB, Song X, Skoog I, Broe GA, Cox JL, Grunfeld E, Rockwood K. Relative fitness and frailty of elderly men and women in developed countries and their relationship with mortality. J Am Geriatr Soc. 2005;53:2184–9. doi: 10.1111/j.1532-5415.2005.00506.x. [DOI] [PubMed] [Google Scholar]
- 21.Goggins WB, Woo J, Sham A, Ho SC. Frailty index as a measure of personal biological age in a Chinese population. J Gerontol A Biol Sci Med Sc. 2005;60:1046–51. doi: 10.1093/gerona/60.8.1046. [DOI] [PubMed] [Google Scholar]
- 22.Kulminski AM, Ukraintseva SV, Akushevich IV, Arbeev KG, Yashin AI. Cumulative index of health deficiencies as a characteristic of long life. J Am Geriatr Soc. 2007;55:935–40. doi: 10.1111/j.1532-5415.2007.01155.x. [DOI] [PMC free article] [PubMed] [Google Scholar]
- 23.Rockwood K, Abeysundera M, Mitnitski A. How should we grade frailty in nursing home patients? J Am Med Dir Assoc. 2007;8:595–603. doi: 10.1016/j.jamda.2007.07.012. [DOI] [PubMed] [Google Scholar]
- 24.Gill TM, Gahbauer EA, Allore HG, Han L. Transitions between frailty states among community-living older persons. Arch Intern Med. 2006;166:418–23. doi: 10.1001/archinte.166.4.418. [DOI] [PubMed] [Google Scholar]
- 25.Bandeen-Roche K, Xue QL, Ferrucci L, Walston J, Guralnik JM, Chaves P, Zeger SL, Fried LP. Phenotype of frailty: characterization in the women's health and aging studies. J Gerontol A Biol Sci Med Sci. 2006;61:262–6. doi: 10.1093/gerona/61.3.262. [DOI] [PubMed] [Google Scholar]
- 26.Podsiadlo D, Richardson S. The timed “Up & Go”: a test of basic functional mobility for frail elderly persons. J Am Geriatr Soc. 1991;39:142–8. doi: 10.1111/j.1532-5415.1991.tb01616.x. [DOI] [PubMed] [Google Scholar]
- 27.Lindsay J, Laurin D, Verreault R. Risk factors for Alzheimer's disease: a prospective study from the Canadian Study of Health and Aging. Am J Epidemiol. 2002;156:445–53. doi: 10.1093/aje/kwf074. [DOI] [PubMed] [Google Scholar]
- 28.McLeod DA, Arnott B, Gaudereault N, Boudreau S, Sevigny P. A comparison of two methods for routine, accurate determination of apolipoprotein E genotypes. Alzheimer's Rep. 1998;1:211–5. [Google Scholar]
- 29.Zivelin A, Rosenberg N, Peretz H, Amit Y, Kornbrot N, Seligsohn U. Improved method for genotyping apolipoprotein E polymorphisms by a PCR-based assay simultaneously utilizing two distinct restriction enzymes. Clin Chem. 1997;43:1657–9. [PubMed] [Google Scholar]
- 30.Kryscio RJ, Schmitt FA, Salazar JC, Mendiondo MS, Markesbery WR. Risk factors for transitions from normal to mild cognitive impairment and dementia. Neurology. 2006;66:828–32. doi: 10.1212/01.wnl.0000203264.71880.45. [DOI] [PubMed] [Google Scholar]
- 31.Tyas SL, Salazar JC, Snowdon DA, Desrosiers MF, Riley KP, Mendiondo MS, Kryscio RJ. Transitions to mild cognitive impairments, dementia, and death: findings from the Nun Study. Am J Epidemiol. 2007;165:1231–8. doi: 10.1093/aje/kwm085. [DOI] [PMC free article] [PubMed] [Google Scholar]
- 32.Bathum L, Christiansen L, Jeune B, Vaupel J, McGue M, Christensen K. Apolipoprotein E genotypes: relationship to cognitive functioning, cognitive decline, and survival in nonagenarians. J Am Ger Soc. 2006;54:654–8. doi: 10.1111/j.1532-5415.2005.53554.x. [DOI] [PubMed] [Google Scholar]
- 33.Hayden KM, Zandi PP, Lyketsos CG, Tschanz JT, Norton MC, Khachaturian AS, Pieper CF, Welsh-Bohmer KA, Breitner JC Cache County Investigators. Apolipoprotein E genotype and mortality: findings from the Cache County Study. J Am Geriatr Soc. 2005;53:935–42. doi: 10.1111/j.1532-5415.2005.53301.x. [DOI] [PubMed] [Google Scholar]
- 34.Yashin AI, Ukraintseva SV, De Benedictis G, Anisimov VN, Butov AA, Arbeev K, Jdanov DA, Boiko SI, Begun AS, Bonafe M, Franceschi C. Have the oldest old adults ever been frail in the past? A hypothesis that explains modern trends in survival. J. Gerontol. A Biol Sci Med Sci. 2001;56:B432–42. doi: 10.1093/gerona/56.10.b432. [DOI] [PubMed] [Google Scholar]
- 35.Kulminski AM, Ukraintseva SV, Yashin AI. The apolipoprotein E epsilon2 allele and aging-associated health deterioration in older males. J Am Geriatr Soc. 2007;55:1479–80. doi: 10.1111/j.1532-5415.2007.01311.x. [DOI] [PubMed] [Google Scholar]
- 36.Melzer D, Dik MG, van Kamp GJ, Jonker C, Deeg DJ. The Apolipoprotein E e4 polymorphism is strongly associated with poor mobility performance test results but not self-reported limitation in older people. J Gerontol A Biol Sci Med Sci. 2005;60:1319–23. doi: 10.1093/gerona/60.10.1319. [DOI] [PMC free article] [PubMed] [Google Scholar]
- 37.Panza F, D’Introno A, Colacicco, Capurso C, Capurso S, Kehoe PG, Capurso A, Solfrizzi V. Vascular genetic factors and human longevity. Mech Ageing Dev. 2004;125:169–78. doi: 10.1016/j.mad.2003.12.005. [DOI] [PubMed] [Google Scholar]
- 38.Stakias N, Liakos P, Tsiapali E, Goutou M, Koukoulis GN. Lower prevalence of epsilon 4 allele of apolipoprotein E gene in healthy, longer-lived individuals of Hellenic origin. J Gerontol A Biol Sci Med Sci. 2006;61:1228–31. doi: 10.1093/gerona/61.12.1228. [DOI] [PubMed] [Google Scholar]
- 39.Stessman J, Maaravi Y, Hammerman-Rozenberg R, Cohen A, Nemanov L, Gritsenko I, Gruberman N, Ebstein RP. Candidate genes associated with ageing and life expectancy in the Jerusalem longitudinal study. Mech Ageing Dev. 2005;126:333–9. doi: 10.1016/j.mad.2004.08.025. [DOI] [PubMed] [Google Scholar]
- 40.Nassar BA, Rockwood K, Kikrland SA, Ransom TP, Darvesh S, MacPherson K, Johnstone DE, O’Neill BJ, Bata IR, Andreou P, Jeffery JS, Cox JL, Title LM. Improved prediction of early-onset coronary artery disease using APOE ε4, BChE-K, PPARγ2 Pro12 and ENOS T-786C in a polygenic model. Clin Biochem. 2006;39:109–14. doi: 10.1016/j.clinbiochem.2005.10.002. [DOI] [PubMed] [Google Scholar]