

Abstract
An increasing number of epilepsy patients are afflicted with drug-resistant temporal lobe epilepsy (TLE) and require alternative therapeutic approaches. High-affinity glycine receptors (haGlyRs) are functionally adapted to tonic inhibition due to their response to hippocampal ambient glycine, and their synthesis is activity-dependent. Therefore, in our study, we scanned TLE hippocampectomies for expression of haGlyRs and characterized the effects mediated by these receptors using primary hippocampal neurons. Increased haGlyR expression occurred in TLE hippocampi obtained from patients with a severe course of disease. Furthermore, in TLE patients, haGlyR and potassium chloride cotransporter 2 (KCC2) expressions were inversely regulated. To examine this potential causal relationship with respect to TLE histopathology, we established a hippocampal cell culture system utilising tonic inhibition mediated by haGlyRs in response to hippocam-pal ambient glycine and in the context of a high Cl equilibrium potential, as is the case in TLE hippocampal neurons. We showed that hypoactive neurons increase their ratio between glutamatergic and GABAergic synapses, reduce their dendrite length and finally undergo excitotoxicity. Pharmacological dissection of the underlying processes revealed ionotropic glutamate and TrkB receptors as critical mediators between neuronal hypoactivity and the emergence of these TLE-characteristic histopathological signs. Moreover, our results indicate a beneficial role for KCC2, because decreasing the Cl− equilibrium potential by KCC2 expression also rescued hypoactive hippocampal neurons. Thus, our data support a causal relationship between increased haGlyR expression and the emergence of histopathological TLE-characteristic signs, and they establish a pathophysiological role for neuronal hypoactivity in the context of a high Cl− equilibrium potential.
Keywords: hippocampus, epilepsy, glycine receptor, RNA editing, inhibition, E-I balance, tonic inhibition, KCC2, excitotoxicity, synapse elimination
Introduction
Information transfer in the brain requires a homeostatic control of neuron excitability. A deregulation of the homeostatically balanced ratio between glutamatergic and GABAergic synapses (Glu/GABA ratio) is considered to elicit hyperexcitability, as is the case with temporal lobe epilepsy (TLE) [1, 2]. Therefore in TLE, plasticity of GABAergic inhibitory signalling attracted much attention, and previous research identified several anticonvulsive substances that enhance tonic GABAergic inhibition to compensate for increased Glu/GABA ratios of synaptic input (for review see [3]).
Glycine receptors (GlyRs) are homologous to GABAA receptors (GABAARs), and transgenic mice expressing β-galactosidase instead of GlyR α3 (strain: B6.129P2-Glra3tm1Dgen/J, stock: 005816, The Jackson Laboratory, JAX® Mice and Services, ME, USA) were found to require lower doses of the GABAAR antagonist metrazol to develop various types of epilepsies, suggesting an anticonvulsive potential of GlyRs. Indeed, recent evidence has accentuated their contribution to tonic hippocampal inhibition in response to hippocampal ambient glycine [4–10], and glycine and taurine as well as glycine uptake inhibitors were found to be anticonvulsive [7, 11, 12].
However, classical GlyRs have a rather low affinity for glycine [13, 14], while the hippocampal ambient glycine concentration is in the submicromolar range [15, 16]. A priori, this discrepancy argues against a role for GlyRs in hippocampal tonic inhibition, but a clarifying possibility is that activity-dependent up-regulation of RNA-edited high-affinity GlyRs (haGlyRs) [17] occurs and thereby approximates the responsiveness of hippocampal GlyRs to the level of hippocampal ambient glycine.
To investigate this possibility, we scanned human TLE hippocampi for haGlyR expression. Up-regulation of α2- and α3-haGlyR expression indeed occurred in TLE hippocampi obtained from patients with a severe course of disease. Furthermore, an in vitro cell culture system was developed for characterization of the potential consequences of haGlyR-mediated tonic inhibition. Because down-regulation of the potassium chloride cotransporter 2 (KCC2) is a hallmark of TLE hippocampi [18–20], primary rat hippocampal neurons were investigated at a time-point when the Cl− equilibrium potential was still high. Tonic activation of haGlyRs rendered these hippocampal neurons hypoactive and elicited histopathological characteristics of TLE hip-pocampi, in terms of elevated Glu/GABA ratios of synaptic input, abnormal dendrite length growth and a pronounced susceptibility of neurons to excitotoxic degeneration. Decreasing the Cl− equilibrium potential by KCC2 expression restored hippocampal neurons. On the basis of these results we propose that up-regulation of haGlyRs enhances tonic inhibition of hippocampal neurons and contributes to the pathogenesis of TLE, provided that the neuronal Cl− equilibrium potential is high.
Materials and methods
Detection of haGlyRs in hippocampi from TLE patients
Analysis of resected human hippocampi was performed according to the rules laid down by the Ethics Commission (Charité, EA1/142/05), and informed consent was received from all patients. The relative amounts of haGlyRs α2192L and α3185L were determined in hippocampal specimen of patients suffering from pharmacoresistant TLE. The degree of hippocam-pal cell loss was categorized according to the Wyler classification [21]. Tissue samples from TLE patients obtained by removal of the rostral part of the hippocampus were stored in liquid nitrogen immediately after resection. Total RNA was then isolated using TRIzol Reagent (Invitrogen Life Technologies, Carlsbad, CA, USA). cDNA was obtained by reverse transcription (Superscript II, Invitrogen) of 2 g RNA with equimolar mixtures of 3 -anchored poly-T oligonucleotides (T18V, T15V, T13V). The haGlyR detection assay was performed as previously described [17], except that BspEI was used instead of HindIII. Due to mispriming of the oligonucleotides, polymerase chain reaction (PCR) amplification was set up as a touch-up protocol (annealing: 5 52 C, 30 56 C for GlyR 2, and 5 54 C, 35 58 C for GlyR 3). Regions spanning exon 5 were amplified using oligonucleotides 5′-GGAAGGATCCACGGCTGGCG-3′ and 5′-GTTC-CTTCTCTTCTTTCAAAATAATCCGG-3′ (GlyR 2), and 5′-GAGACGACCATG-GATCCCAGAGTG-3′ and 5′-CGTAAATCTTTTTCTTCTTTCAACAGTATCCGG-3′ (GlyR 3). Note that in cases of 554T and 575T, the 3′-ends of the respective oligonucleotides (TCCGG) are elongated according to a full BspEI site. The respective sense oligonucleotides introduced BamHI restriction sites. For subsequent cloning BamHI and BspEI (New England Biolabs, Hertfordshire, UK) were used. Positive (α2575T and 3554T) and negative (α2575C and 3554C) control clones were always processed simultaneously. Amplified control clones were digested with 10 units each of BamHI and BspEI for 2 hrs at 37 C, and for amplified cDNA of TLE patients the amount of restriction enzymes was adjusted proportionally to rule out any relaxed enzyme activity. Equimolar amounts of double-digested cloning vector (modified pBluescript SK II vector, into which a BspEI site was introduced) and of samples were ligated using the Rapid DNA Ligation Kit (Fermentas GmbH, St. Leon-Rot, Germany). Following transformation of JM109 competent bacteria (Promega, Madison, WI, USA), the number of true positive colony forming units (cfu) was determined by PCR on cfu. The respective oligonucleotides for PCR on cfu were T7 (5′-GTAATACGACTCAC-TATAGGGC-3′) in combination with 5′-ACCCATCCATGCTAGACTCC-3′ (GlyR α2) or 5′-TCAAGAATTTTCCCATGGATGTA-3′ (GlyR α3). The amount of haGlyRs in human hippocampi was expressed as a percentage fraction of the number of true positive cfu obtained from human samples and the number of true positive cfu obtained from the respective positive control clone. At least three experiments per human hippocampus were performed. For surveillance of the detection procedure a calibration curve (Supplementary Fig. 1B) was obtained by amplifying control clone DNA mixtures containing increasing amounts (%: 1, 2.5, 5, 10, 25, 50, 75) of positive control clones. Again, 0% and 100% of positive control clones served as negative and positive control reactions, respectively.
Detection of human GlyR α2A and α2B transcripts in hippocampi from TLE patients
The relative mRNA levels encoding alternatively spliced human GlyR α2A and α2B subunits were determined by PCR using α2A- and α2B-specific oligonucleotides 5′-ATCAACAGTTTTGGATCAGTCA-3′ (α2A) and 5′-TCAACAGCTTTGGGTCAATAG-3′ (α2B), respectively, in combination with 5′-CCTTCAGCAACTTGCACTGG-3′, which binds downstream of the alternatively spliced exon 3. Annealing was set to 58°C, 30 cycles were run. GlyR α2A- and α2B-specific PCRs had to be performed in separate reactions because α2A- and α2B-specific PCR products were of the same size. Agarose gel-separated PCR products were quantified using ImageQuant software (Molecular Dynamics, Sunnyvale, CA, USA) and expressed as mean pixel intensity. Triplicate experiments were performed, and the ratio between intensities of α2A and α2B products was extracted from each experiment. Average ratios below a value of 0.5 were designated ‘B’, between 0.5 and 1.5 were designated ‘AB’ and above 1.5 were denominated ‘A’ (Fig. 1D).
Fig. 1.

Hippocampal damage and reduction of KCC2 expression are associated with elevated human haGlyR expression in TLE hippocampi. (A, B) Relative amounts of haGlyRs α2575T and α3554T detected in hippocampi from epilepsy patients without (W0–1, cell loss > 10%) and with (W2–4, cell loss 10%) hippocampal cell loss (see Table 1 for anamnesis of TLE patients). The latter includes patients with frequent SGTCS (≥1/month), but without hippocampal damage (three patients). Individual patient scores are shown as open (W0–1, n = 6), filled (W2–4, n 17) and dashed (SGTCS ≥1/month, n = 3) circles. Columns illustrate means S.E.M. (C) GlyR 2575T fractions plotted against 3554T fractions. Dashed lines indicate W0–1 mean 2575T and 3554T fractions, respectively. (D) Percentages of patients with suprathreshold (mean of W0–1) α2575T+α3554T (2 + 3), α2575T (2) and 3554T (3) fractions, respectively. Ratios between GlyR 2A and 2B mRNAs were determined. Average ratios below a value of 0.5 were designated ‘B’, between 0.5 and 1.5 were designated ‘AB’ and above 1.5 were denominated ‘A’. Note that prevailing expression of GlyR 2B transcripts (‘B’) is associated with hip-pocampal damage and a high SGTCS frequency in W2–4 patients. (E) Inverse correlation between KCC2 (normalized to -actin) and haGlyR expression levels in hippocampi from TLE patients. Error bars indicate the S.E.M. of the mean values obtained from at least three independent experiments. Significance level is P < 0.05 (*).
Semiquantitative analysis of KCC2 expression in hippocampi from TLE patients
KCC2 and β-actin were always co-amplified in the same PCR reaction tubes using oligonucleotides (10 μM each, 5′-CTGCTGGCTTACCTCTTCC-3′ and 5′-CGTCTCATTTCCTTCCCAAG-3′, KCC2) and (5 μM each, 5′-CGCTCGTTGCCAATAGTGATG-3′ and 5′-TTGTAACAAACTGGGACGAT ATGG-3′, β-actin). Annealing was set to 58°C; 30 cycles were run. PCR products were separated by agarose gel electrophoresis, quantified using ImageQuant software (Molecular Dynamics) and expressed as mean pixel intensity. The relative KCC2 expression level was expressed as the mean pixel intensity of KCC2 divided by the mean pixel intensity of β-actin.
Hippocampal cell culture and transfection
All animals were killed according to the permit (LaGeSo, 0122/07) given by the Office for Health Protection and Technical Safety of the regional government of Berlin and in compliance with regulations laid down in the European Community Council Directive. Hippocampal cultures from E19 Wistar rats were prepared as previously described [6] and maintained in B27- and 1% FCS-supplemented Neurobasal medium [22]. The initial cell density was 68,000/cm2. Transfection was carried out on day(s) in vitro (d.i.v.) 6, as described [17], using plasmids encoding the short (K) splice variants of GlyR α3 [14]. GlyRs α3K185P or 3K185L will henceforth be referred to as α3185P or α3185L. In part of the experiments, KCC2 (generous gifts from Claudio Rivera and Karl Kandler) was cotransfected with GlyRs. The KCC2 expression construct provided by Karl Kandler uses a pMES vector backbone, which was originally produced by Catherine Krull [23]. This allowed the use of enhanced green fluorescent protein (EGFP) as an indicator for KCC2 expression [24]. Caspase-3 sensor was used as an indicator for apoptosis [25]. For transfection, coverslips were transferred to wells containing transfection medium (Neurobasal supplemented with 0.25 mM glutamine) and were incubated with complexes formed with 5 μl of effectene transfection reagent (Qiagen, Hilden, Germany) and 300 ng of DNA. The Qiagen transfection protocol was followed, except that the incubation time was reduced to 1 hr. This protocol ensured moderate expression levels of the transfected proteins within 3 days in ∼1% of hippocampal neurons. The coverslips were then transferred into new dishes containing a culture medium with low glycine content. Glycine-and serum-free minimal essential medium was supplemented with D-glucose (25 mM), HEPES (10–20 mM), Na-pyruvate (230 M), vitamin B12 (0.2 M), L-glutamine (250 μM), -mercaptoethanol (25 μM), B27-supplement and 5 M glycine, which corresponds to the EC50 of GlyR 3185L. The concentration of 5 M glycine was maintained throughout all experiments, also during electrophysiological recordings.
Whole-cell and perforated patch clamp recording of hippocampal neurons in culture
Whole-cell and perforated patch clamp recordings were made from neurons expressing α3185P or α3185L GlyRs together with the EGFP, which allowed selection of transfected cells by fluorescence microscopy. Access resistance was monitored throughout the experiments. Serial resistance compensation was not applied. Measurements were not corrected for liquid junction potentials. Electrophysiological signals were acquired using an EPC-7 amplifier (List, Darmstadt, Germany), a 16-bit AD/DA board (ITC-16, HEKA Elektronik, Lambrecht, Germany), and TIDA 4.11 software (HEKA Elektronik). The signals were filtered at 3 kHz and sampled at a rate of 10 kHz.
Whole-cell recordings were performed in the standard salt solution (SSS). The intrapipette solution contained (in mM): potassium gluconate (100), KCl (50), NaCl (5), CaCl2 (0.5), EGTA (5) and HEPES (25); pH was set to 7.2 with KOH. Pipette resistance was 3–5 MΩ when filled with the above saline. Access resistance was monitored by applying hyperpolarizing pulses of 10 mV. Cell capacitance (Cm) and access resistance values were obtained by fitting a monoexponential function to the capacitance artefacts. Only recordings with a series resistance below 40 MΩ were accepted. Cells exhibiting more than 20% changes in the access resistance during an experiment were discarded. Miniature postsynaptic currents (PSCs) were recorded in the presence of 1 μM tetrodotoxine at the holding potential of 70 mV. Action potentials (APs) were recorded in the current clamp mode. Current injection was used to hold cells at about −70 mV. Firing patterns were elicited by 500 ms, suprathreshold depolarizing pulses. AP threshold was determined as the point where the first derivative started to increase. AP duration was measured at the level of AP threshold.
Perforated patch clamp experiments were performed in the SSS supplemented with 1 μM tetrodotoxin to block AP generation. SSS containing glycine (100 μM) was applied locally via a glass pipette positioned in the vicinity (about 100 μm) of a cell of interest. Recording electrodes (3–5 MΩ) were filled with gramicidin (25–50 g/ml) and Fura-2-K5 (0.3 mM) in a solution containing (in mM): potassium gluconate (100), KCl (50), NaCl (5), CaCl2 (0.5), EGTA (5) and HEPES (25); pH was set to 7.2 with KOH. Fura fluorescence was monitored at an excitation wavelength of 360 nm to confirm that the perforated patch configuration was maintained. The access resistance was monitored throughout experiments. After 30–40 min it stabilized at 40–50 MΩ. Cells exhibiting more than 20% changes in the access resistance during an experiment were discarded.
Ca2+ Imaging of hippocampal neurons in culture
For Ca2+ imaging, cultures were placed into a recording chamber (∼0.4 ml volume) on the microscope stage (Axioscope FS, Zeiss, Oberkochen, Germany) equipped with phase contrast optics. Cultures were submerged with a constant flow of SSS (pH 7.4) containing (in mM): NaCl (140), KCl (3), MgCl2 (1), CaCl2 (2), HEPES-NaOH (20) and glucose (30). Flow rate was set to 0.5 ml/min using a gravity-driven, manually operated superfu-sion system. A 40 × water immersion objective (Zeiss) was used in all experiments. Experiments were performed at room temperature (23–25 C). Measurements of cytoplasmic Ca2+ transients were performed using a Ca2+-sensitive fluorescent dye, Fura-2 (Molecular Probes, Eugene, OR, USA). Cells were loaded through incubation in the SSS supplemented with Fura-2 acetomethylester (Fura-2/AM, 5 μM) and Pluronic F-127 (0.02%) for 20 min at 36 C. Subsequently, cultures were incubated for 30 min in the SSS at room temperature to ensure Fura-2/AM deesterification. Excitation wavelength was controlled by a fast monochromator system, and fluorescence signals were recorded by a CCD camera (TILL Photonics, Munich, Germany). For cell selection, EGFP was excited using 490 nm light. Fura-2 was excited alternatively at 360 and 380 nm. Excitation and emission light were separated by a 510-nm dichroic mirror. The emitted light was filtered using a 530-nm longpass filter. All measurements were performed at 4 4 binning. Exposure time was set to 200 ms. Acquisition rate for [Ca2+] measurement was set to one pair of images per 1 sec. The background fluorescence was calculated from a region in the immediate vicinity of the cell of interest and subtracted. Fluorescence signals were expressed as the ratio of fluorescence recorded at 360 and 380 nm excitation wavelengths (F360/F380).
Antibodies
GlyRs were recognized by the monoclonal antibody mAb4a [26] (1:200, Synaptic Systems GmbH, Göttingen, Germany). The vesicular GABA transporter (VGAT) and vesicular glutamate transporters (VGluT) were visualized with polyclonal antibodies from rabbit [27] (1:200, Synaptic Systems GmbH) and guinea pig [28] (1:500, Chemicon, Temecula, CA, USA), respectively. Endogenous KCC2 was visualized with a rabbit polyclonal antibody [29] (Upstate, Charlottesville, VA, USA). EGFP indicated the presence of KCC2 [23] in GlyR/KCC2 co-expression experiments. After methanol/glacial acetic acid fixation, which cuts off YFP fluorescence, EYFP protein as part of the caspase-3 sensor was detected with a polyclonal anti-GFP antibody (Invitrogen Life Technologies) and a secondary fluorescein isothiocyanate (FITC)-coupled antibody. For multiple labelling experiments, monoclonal and polyclonal antibodies were combined. Secondary antibodies were coupled to carboxymethyl-indocyanine (Cy3, Cy5), FITC or Alexa350 and purchased from Jackson ImmunoResearch Laboratories (West Grove, PA, USA) or Molecular Probes, respectively. Coverslips were mounted in Vectashield medium (Vector Laboratories, Burlingame, CA, USA).
Immunofluorescence
Cells were immersed into a mixture (95/5) of methanol and glacial acetic acid for 10 min at −20°C. Appropriate filters (XF22, XF32, XF110–2, XF136–2; Omega Optical Inc., Brattleboro, VT, USA) allowed the detection and separation of fluorescence signals. To ensure that labelling was specifically due to the primary antibodies, we replaced the latter with similarly diluted normal serum from the same species. Our methods for evaluation of presynaptic terminal number and dendrite morphology in dissociated hippocampal cultures were previously described [30, 31]. Briefly, labelled neurons were visualized by standard epifluorescence under a plan-neoflu-ar 40× oil objective with a numerical aperture of 1.3 (Zeiss). Images were acquired using a 14-bit cooled CCD camera (Spot PURSUIT, Visitron Systems GmbH, Puchheim, Germany) and software Metamorph (Universal Imaging Corp., Downingtown, PA, USA). Terminal counts and analysis of dendrite morphology were performed manually. A circular region of interest (ROI) with a diameter of 100 m was projected onto GlyR-expressing neurons, its centre roughly coinciding with the centre of the soma. Suitable viewfields were photographed from triple-stained (VGluT, VGAT, GlyR) preparations, and Glu/GABA ratios were extracted from each transfected neuron. To avoid false positives in synaptic terminal counts, we applied a size criterion. Assuming a round shape of the contact, a synaptic terminal was requested to have a suprathreshold intensity over an area with a diameter between 0.5 and 2× m, the threshold intensity being equal to the average intensity of the ROI plus three times its standard deviation. Dendritic length was characterized as the number of dendrites that exceeded the limit of the ROI (abbreviated as ‘dendrites > 50 m’). The fraction of apoptotic and degenerated neurons, which expressed 3185P or 3185L was evaluated using caspase-3 sensor co-expression and morphological criteria, the latter according to the presence of dendritic swellings and varicosities [32].
Statistics
Numerical data are reported as mean ± standard error of means (S.E.M.). In hippocampal cell culture experiments, neurons were sampled from at least three different cultures, each including at least 20 viewfields from two different coverslips. Molecular biology experiments conducted on TLE patients were performed in triplicate. If not stated otherwise, statistical analysis (unpaired Student's t-test, anova and Mann-Whitney) was performed using the software Origin (Microcal, Northampton, MA, USA). Significance levels are indicated in the figures as *P 0.05, **P 0.01, ***P 0.001.
Reagents
In part of the experiments the medium was supplemented with iGluR antagonists DNQX (6,7-dinitroquinoxaline-2,3(1H,4H)-dione, 20 M) and/or MK801 (dizocilpine, 1 M, both from Tocris, Bristol, UK) and/or the tyrosine kinase inhibitor K252a (200 nM, Sigma-Aldrich, Deisenhofen, Germany). The culture medium was supplemented with these drugs during GlyR expression, i.e. from d.i.v. 6 to d.i.v. 9.
Results
Elevated haGlyR expression occurs in hippocampi from TLE patients with a severe course of disease
Human TLE hippocampi resected for therapeutic reasons were screened for elevated expression of haGlyRs. According to the severity of their course of disease, TLE patients were divided in two groups (Table 1, ‘internal grading’). Patients without remarkable hippocampal cell loss (Wyler 0–1, cell loss 10%) and a low frequency (1/month) of secondarily generalized bilateral tonic–clonic seizures (SGTCS) were designated W0–1 (Table 1). Patients with remarkable hippocampal cell loss (Wyler 2–4, cell loss 10%) or a high SGTCS frequency (1/month) were termed W2–4 (Table 1). The experimental strategy [17] for detection of haGlyRs was adapted to human cDNA sequences and validated by calibration (Supplementary Fig. 1A and B).
Table 1.
Anamnesis of TLE patients
| Patient no. | Gender | Age | Seizure types | Seizure frequency | Seizures since (y) | Hippo- campus | Wyler grade | Previous medication | Medication at operation | Internal grading |
|---|---|---|---|---|---|---|---|---|---|---|
| 2.1.3 | F | 29 | CPS SGTCS | 1–4/m 1/y | 26 | Left | 0 | CBZ | OXC, Frisium | W0–1 |
| 2.22.5 | F | 32 | CPS | 1/m | 4 | Right | 0 (DNT WHO grade I) | CBZ | LEV | W0–1 |
| 2.26.4 | M | 43 | CPS | 3–5/m | 12 | Left | 0 (FCD) | CBZ CBZ, LTG, PHT, OXC, | LEV, GBT | W0–1 |
| 2.34.4 | F | 47 | CPS | 2–3/m | 32 | Left | 1 | TPX, VPA, LEV | LTG, Frisium | W0–1 |
| 2.50.3 | M | 38 | CPS | 4/m | 1 | Left | 0 | CBZ, OXC | OXC | W0–1 |
| 6.25.5 | F | 24 | CPS | 4–6/m | 7 | Left | 0 (FCD) | CBZ | TPX, OXC | W0–1 |
| 2.49.4 | F | 45 | SGTCS | 2–3/m | 22 | Left | 0 | CBZ, LTG, PHT, OXC, TPX, VPA, LEV | GBT | W2–4 |
| 6.25.6 | F | 37 | CPS SGTCS | 2–3/m 2/m | 10 | Right | 0–1 | CBZ | LEV, TPX | W2–4 |
| 6.25.7 | F | 51 | CPS SGTCS | 2–7/m 1–2/m | 11 | Right | 1 | CBZ | LTG | W2–4 |
| 2.47.5 | F | 39 | CPS | 4–10/m | 39 | Left | 2 | CBZ, LTG, PHT, OXC, TPX, VPA, LEV | LTG, LEV | W2–4 |
| 2.58.9 | F | 48 | CPS | 12–16/m | 20 | Left | 2 | CBZ | LTG | W2–4 |
| 2.115.7 | F | 48 | CPS | 2/m | 45 | Right | 2 | CBZ | CBZ | W2–4 |
| 2.58.3 | F | 24 | CPS SGTCS | 4/m 1/m | 7 | Right | 2–3 | CBZ, LTG | LTG | W2–4 |
| 2.74.3 | M | 34 | CPS | 4–5/m | 17 | Right | 2–3 | CBZ, OXC | LEV | W2–4 |
| 2.84.4 | M | 42 | CPS | 30/m | 38 | Left | 2–3 | CBZ | LEV, LTG | W2–4 |
| 2.88.4 | F | 34 | SPS | 8/m | 31 | Right | 3 (SWD) | CBZ | LTG | W2–4 |
| 6.50.3 | F | 48 | SPS SGTCS | 2/m 1/m | 18 | Right | 3 | CBZ | CBZ, LTG | W2–4 |
| 6.50.4 | M | 15 | CPS | 1–3/m | 6 | Left | 3 | CBZ | CBZ, LTG | W2–4 |
| 2.25.5 | F | 53 | CPS | 4/m | 38 | Left | 4 | CBZ | OXC | W2–4 |
| 2.58.11 | M | 36 | CPS | 4–5/m | 6 | Left | 4 | CBZ | LTG | W2–4 |
| 2.92.4 | F | 49 | SPS | 3–6/m | 22 | Left | 4 | CBZ | LTG | W2–4 |
| 2.115.5 | F | 48 | CPS | 4–12/m | 44 | Left | 4 | CBZ | LTG | W2–4 |
| 6.25.8 | M | 58 | CPS | 4/m | 23 | Right | 4 | CBZ, VPA | OXC, LEV | W2–4 |
Abbreviations: m: month(s); y: year(s); SPS: simple partial seizures, CPS: complex partial seizures, SGTCS: secondarily generalized bilateral tonic–clonic seizures, OXC: oxcarbazepine, LEV:
levetiracetam, GBT: gabapentin, CBZ: carbamazepine, LTG: lamotrigine, PHT: phenytoin, TPX: topiramate, VPA: valproic acid, SWD: Sturge–Weber disease, FCD: focal cortical dysplasia and
DNT: dysembryoplastic neuroepithelial tumour.
In human TLE hippocampi haGlyR α2192L (575T, Supplementary Fig. 1A) and α3185L (554T) were detected (Fig. 1A and B). Compared with W0–1 TLE patients α2575T and 3554T haGlyR mRNA fractions of α2 and α3 transcripts were elevated in W2–4 patients (W0–1 [%]: 2 575T: 5.5 ± 1.2; 3554T: 0.9 ± 0.3, n 6 patients; W2–4 [%]: 2575T: 12.8 ± 2.5; 3554T: 4.1 1.2, n 17, thereof 14 Wyler 2–4 patients and 3 Wyler 0–1 patients with a high SGTCS frequency). Seven Wyler 2–4 patients and two Wyler 0–1 patients with frequent SGTCS were characterized by congruent incidences of haGlyRs α2575T and α3554T, exceeding the respective W0–1 mean values (Fig. 1C and D; 9/17 ∼ 53%). Twelve per cent (2/17) of Wyler 2–4 patients expressed increased levels of haGlyR α2575T only, and suprathreshold expression of haGlyR α3554T only was found in one Wyler 2–4 patient and one Wyler 0–1 patient with frequent SGTCS (2/17 ∼ 12%). Twenty-three per cent (4/17) of W2–4 patients did not differ from W0–1 patients with respect to 2575T and 3554T mRNA levels. In total, compared with W0–1 patients, 77% (13/17) of W2–4 patients were characterized by increased expression of at least one type of haGlyRs. The fact that increased expression of both GlyR α2575T and 3554T was detected in two out of three Wyler 0–1 cases with frequent SGTCS emphasizes the activity dependency of haGlyR expression [17] and accentuates their potential involvement in TLE.
Elevated haGlyR expression accompanies elevated GlyR _2B expression and inversely correlates with KCC2 expression in hippocampi from TLE patients
GlyR α2 mRNA is alternatively spliced by insertion of either exon3A or exon3B, and GlyR α2B was shown to be more sensitive to glycine than GlyR α2A [13]. This differential agonist sensitivity is conserved in the case of P192L amino acid substitution, which renders GlyR α2B192L a highly sensitive receptor variant (Supplementary Fig. 1D; EC50Gly [M]: 2A192L: 10.6; 2B192L: 3.4). Notably, still ∼15% of the maximal current amplitude produced by 2B192L was obtained with submicromolar (0.1 μM) glycine. We therefore quantified the amount of alternatively spliced Glra2 transcripts in TLE hippocampi. Prevailing expression of GlyR 2B transcripts was found in W2–4 patients (Fig. 1D; 41%, 7/17). Among these cases, 5/17 W2–4 patients expressed W0–1 suprathreshold amounts of both GlyR α2575T and 3554T (thereof two Wyler 0–1 patients with frequent SGTCS). One Wyler 2–4 patient with prevailing GlyR α2B expression was characterized by elevated expression of GlyR α3554T only, and another Wyler 2–4 patient did not show elevated haGlyR expression. Thus, prevailing GlyR α2B expression accompanies elevated expression of haGlyRs α2575T and α3554T in W2–4 patients.
Several studies have accentuated KCC2 down-regulation as a critical step towards the pathophysiology of TLE [18–20, 33, 34]. We therefore analyzed KCC2 expression in hippocampi from W0–1 and W2–4 patients, related it to haGlyR mRNA fractions of GlyR α2 and α3 transcripts and found an inverse correlation between KCC2 and haGlyR expression (Fig. 1E).
Tonic inhibition by haGlyRs suppresses spontaneous Ca2+ transients and AP firing in hippocampal neurons with a high Cl− equilibrium potential
To investigate potential effects of inverse regulation of KCC2 and haGlyR expression at a cellular, neuronal level, we developed an in vitro cell culture system utilizing selective activation of haGlyRs in hippocampal neurons with a high Cl− equilibrium potential. Therefore, hippocampal neurons were chosen for investigation at d.i.v. 9, when the Cl− equilibrium potential was still high (Fig. 2A, B, D and E). Neurons were transfected with DNAs encoding either haGlyR α3185L or low-affinity GlyR 3185P; the latter served as a control throughout all experiments. The micrograph of Fig. 2C illustrates the uniform distribution of GlyR 3185L within the plasma membrane of a transfected neuron at d.i.v. 9. From the intensity of the immunolabel we estimated α3185L expression to roughly correspond to that of endogenous GlyRs, visible as clusters in the vicinity of the transfected neuron (arrows). During GlyR 3185L expression, neurons were kept in the presence of 5μM glycine, which corresponds to the formerly determined EC50 of haGlyR3185L[17] and which approximates hippocampal ambient glycine in TLE patients [16].
Fig. 2.

Determination of the Cl equilibrium potential in primary rat hippocampal neurons. (A, B) Hippocampal neurons at d.i.v. 9 have reduced endogenous KCC2 expression, compared with mature neurons (B) at d.i.v. 21. (C) Uniform distribution of haGlyR 3185L over the somatodendritic compartment of a hippocampal neuron at d.i.v. 9. (D) Sample traces elicited with 100 μM glycine at different holding potentials, recorded in the perforated patch clamp configuration from a hippocampal neuron expressing haGlyR α3185L. (E, F) Cl equilibrium potentials (E) and resting membrane potentials (F) in neurons expressing α3185P or α3185L. Note the high and similar Cl equilibrium potentials in neurons expressing GlyR α3185P or α3185L, which is in agreement with reduced endogenous KCC2 expression. Scale bars: 10 μm, and 5 μm in high power views.
Gramicidin-perforated patch clamp recordings were performed to estimate the driving force for Cl ions in these hippocampal neurons (Fig. 2D and E). Neurons expressing α3185P or α3185L exhibited equal Cl− reversal potentials (ECl[mV]: 3185P: 46.4 ± 0.8; 3185L: 46.3 1.2; Fig. 2E). In both cases, the difference between ECl and the resting membrane potential (Vm) measured in the presence of 5 μM glycine amounted to 7–8 mV (Vm [mV]: α3185P: 53.6 ± 1.3; α3185L: 54.5 ± 3.1, Fig. 2F).
Furthermore, control and haGlyR α3185L-expressing neurons were comparable with regard to Ca2+ levels at rest, measured in the presence of 5 μM glycine (F360/F380: α3185P: 0.272 ± 0.004; α3185L: 0.278 ± 0.005, P= 0.3).
To find out how glycine and GABA would affect spontaneous activity of the transfected neurons, spontaneous Ca2+ transients were recorded (Fig. 3A and C). This approach ensured preservation of the internal cellular milieu. Control neurons expressing low-affinity GlyR 3185P were found to be spontaneously active in the presence of 5 μM glycine. They displayed no change associated with strychnine application, but were inhibited by 5 μM bicuculline methiodide (Ca2+ transients [per minute], α3185P: 0.87 ± 0.13; 3185P strychnine and bicuculline: 0.17 ± 0.08, P 0.001,paired Student's t-test; Fig. 3A and B). These results suggest that the controls lacked tonic glycinergic inhibition and responded to GABA with depolarization. In contrast, neurons expressing haGlyR α3185L were not spontaneously active in the presence of 5 μM glycine and responded to strychnine application with disinhibition (Ca2+ transients [per minute], 3185L: 0.05 ± 0.05; α3185L strychnine: 0.65 ± 0.17, P= 0.01, paired Student's t-test; Fig. 3C and D). Bicuculline was shown to inhibit spontaneous activity, but, naturally in haGlyR 3185L-expressing neurons, this suppressive effect could only be seen against the background of strychnine-induced disinhibition (Ca2+ transients [per minute], α3185L strychnine: 0.65 ± 0.17; 3185L strychnine and bicuculline: 0.25 ± 0.11, P > 0.05, paired Student's t-test; Fig. 3C and D). Therefore, although both glycine and GABA open Cl− channels, their effect on network activity is different, with GABAARs eliciting spontaneous Ca2+ transients and haGlyRs inhibiting their appearance. Accordingly, whole-cell patch clamp recordings revealed that haGlyR-expressing neurons fired 1–2 APs upon suprathreshold depolarization, while control neurons answered adequate depolarization with a train of APs (Fig. 3E and F, Table 2). Thus, tonic activation of haGlyR by low glycine (in the range of hippocampal ambient glycine) strongly attenuates neuronal activity, even in hippocampal neurons with depolarizing GABAergic currents.
Fig. 3.
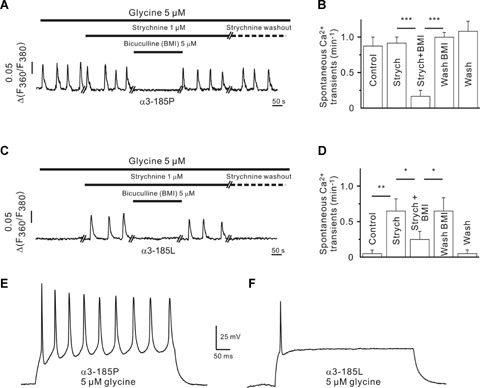
haGlyRs and GABAARs differentially modulate spontaneous activity of neurons with a high Cl equilibrium potential. (A–D) Effect of 5 M glycine on spontaneous Ca2+ transients in neurons expressing α3185P (A, B) or 3185L (C, D). Bicuculline methiodide (BMI) was used to block GABAARs. Note the strychnine-mediated reversible relief of α3185L-positive neurons from suppression of spontaneous Ca2+ transients. (E, F) In current clamp experiments, neurons expressing 3185P (E) generate AP trains upon suprathreshold depolarization, while neurons with 3185L (F) fire 1–2 APs only (see Table 2 for values). Error bars indicate the S.E.M. of the mean values obtained from at least three independent experiments. Significance levels are P < 0.05 (*), P < 0.01 (**) and P < 0.001 (***).
Table 2.
AP characteristics in control and activity-deprived neurons
| α3-185P (n-12) | α3-185L (n-9) | P | |
|---|---|---|---|
| Amplitude (mV) | 66.8 ± 1.6 | 54.6 ± 5.8 | 0.05 |
| Threshold (mV) | 40.1 ± 1.4 | 39.3 ± 1.3 | 0.7 |
| Duration (ms) | 4.6 ± 0.2 | 6.1 ± 0.5 | 0.01 |
| APs (n/500 ms) | 8.7 ± 0.7 | 1.8 ± 0.4 | 0.00001 |
haGlyR activation shunts excitatory inputs
To elucidate the mechanisms underlying the differential effects of GABA and glycine on spontaneous neuronal activity, membrane resistance (Rm) and Cm were measured in the whole-cell configuration. Inhibited hippocampal neurons indeed displayed a decreased Rm in the presence of 5 M glycine, while Cm was similar in both control and haGlyR α3185L-expressing neurons (Rm [MΩ]: α3185P: 493 ± 79; α3185L: 180 ± 25, P < 0.01; Cm [pF]: α3185P: 49 ± 6; α3185L: 44 ± 5, P 0.56). In the whole-cell mode the resting potential of haGlyR α3185L-expressing neurons registered 10 min after break-through was significantly more positive (Vm [mV]: −35 ± 2 mV) than that of α3185P-expressing cells (Vm [mV]: 52 ± 1 mV, P < 0.001, unpaired Student's t-test). Because the intrapipette solution contained 50 mM Cl−, which sets the Nernst equilibrium potential for Cl− at about 20 mV, haGlyR activation by 5 μM glycine may underlie the observed shift of the resting potential. Indeed, application of strychnine shifted the resting potential in haGlyR 3185L-expressing cells to more negative values (Vm [mV]: −49 ± 3) but failed to affect 3185P-expressing cells (Vm [mV]: −53 ± 3). Therefore, given that hippocampal GABAARs are clustered at synaptic sites [35] and that hippocampal GlyRs are apparently not involved in synaptic transmission [5, 6, 8], one can attribute the contrasting actions of GABA and glycine to synaptic GABAAR-mediated excitation and tonic haGlyR-mediated shunt inhibition.
haGlyR-mediated tonic inhibition increases the Glu/GABA ratio of synaptic input through activation of iGluRs and TrkB receptors
As the frequency of spontaneous Ca2+ transients was slightly decreased in disinhibited haGlyR α3185L-positive neurons (Ca2+ transients [per minute], α3185P strychnine: 0.92 ± 0.08; α3185L strychnine: 0.65 ± 0.17, P 0.17, Fig. 3B and D), while a slight increase in the frequency of spontaneous Ca2+ transients in haGlyR 3185L-expressing neurons could be observed in case both GABAARs and GlyRs were blocked (Ca2+ transients in the presence of bicuculline and strychnine [per minute], α3185P: 0.17 ± 0.08; α3185L: 0.25 ± 11, P= 0.55; Fig. 3B and D), the synaptic connectivity pattern of haGlyR α3185L-expressing neurons may have changed in response to activity deprivation. To investigate this possibility, control and haGlyR α3185L-expressing neurons were immunolabelled with presynaptic markers for glutamatergic and GABAergic synapses.
The haGlyR 3185L-positive neurons were indeed found to receive more glutamatergic (VGluT+ terminals, α3185P: 147 ± 6; α3185L: 201 ± 7) and less GABAergic terminals (VGAT+ terminals, 3185P: 83 3; 3185L: 52 2), quantified within a circular ROI (diameter: 100 m) projected on the somatodendritic compartment (Fig. 4A–D). The number of glutamatergic and GABAergic terminals was correlated (Fig. 4E), suggesting that the Glu/GABA ratio is kept within a narrow range [36] irrespective of the total number of presynaptic terminals a single neuron receives. However, Glu/GABA ratios extracted from activity-deprived, haGlyR α3185L-expressing neurons were increased (Figs 4E, F and 5A).
Fig. 4.
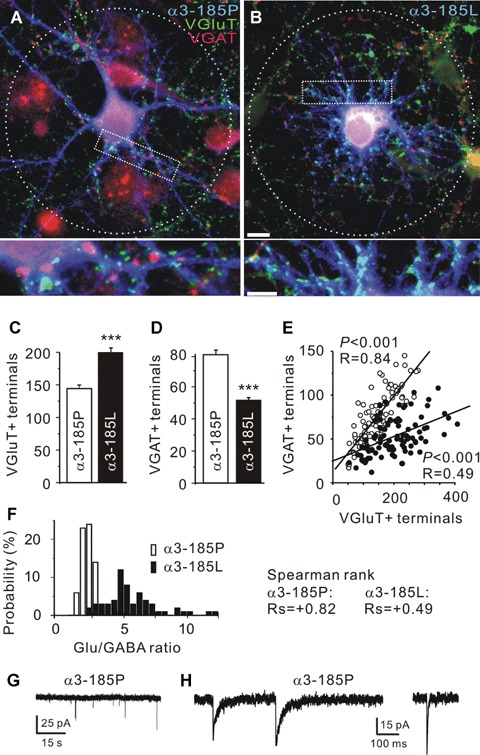
Tonic GlyR α3185L activation by 5 μM glycine increases the Glu/GABA ratio of synaptic input to hippocampal neurons with a high Cl equilibrium potential. (A, B) Representative images of hippocampal neurons expressing either α3185P or α3185L (blue). VGAT and VGluT immunoreactivities are represented in red and green colours, respectively. (C, D) Quantification of the number of VGluT and VGAT immunoreactive (+) terminals in contact with neurons expressing α3185P or α3185L. (E) The number of VGluT+ and VGAT+ terminals in contact with neurons expressing α3185P (open circles) or α3185L (filled circles) are correlated. (F) Histogram illustrating Glu/GABA ratio distributions in neurons expressing α3185P or α3185L. (G, H) Miniature glutamatergic and GABAergic postsynaptic currents recorded from a neuron expressing α3185P. Error bars indicate the S.E.M. of the mean values obtained from at least three independent experiments. Significance level is P < 0.001 (***). Scale bar: 10 μm, high power views: 5 μm.
Fig. 5.
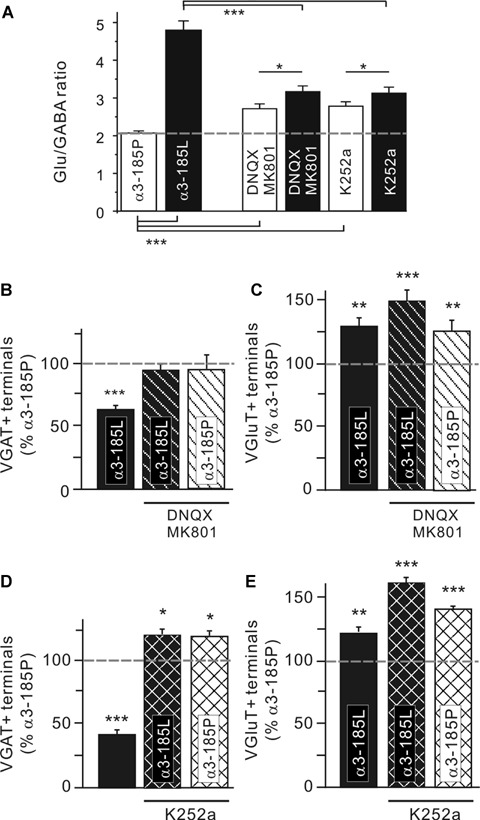
Activity-dependent regulation of GABAergic synapses in hippocampal neurons with a high Cl equilibrium potential. (A) Glu/GABA ratios obtained from neurons treated with iGluR or TrkB receptor antagonists during α3185P or α3185L receptor expression. See Table 3 for values. Blockade of iGluRs (B, C) or TrkB receptors (D, E) rescues α3185L-expressing neurons from down-regulation of the number of VGAT+ terminals. Note that the TrkB receptor antagonist K252a increases the number of VGAT+ terminals beyond control levels. Also note that the number of VGluT+ terminals was up-regulated in case of iGluR and TrkB receptor blockade, irrespective of the receptor variant expressed. Error bars indicate the S.E.M. of the mean values obtained from at least three independent experiments. Significance levels are P < 0.05 (*), P < 0.01 (**) and P < 0.001 (***).
To substantiate this morphological data, miniature postsynaptic currents were recorded (Fig. 4G and H). As described previously [30], glutamatergic and GABAergic miniature postsynaptic currents (mEPSC, mIPSC) were distinguished by their decay kinetics. Both, mEPSC and mIPSC were detected in all control neurons (n 12). Based on their frequencies, the Glu/GABA ratio of synaptic input was determined for each recorded cell (mEPSC/mIPSC, α3185P: 0.75 ± 0.21). The discrepancy between the Glu/GABA ratios obtained from morphological and electrophysiological analysis suggests the presence of a fraction of morphologically but not yet functionally established synapses, which is characteristic for a developing network [37]. In contrast, only a few (three of nine) haGlyR α3185L-positive neurons displayed mIPSCs, which occurred at one out of three of the frequency of control neurons. However, not any mEPSC could be extracted from these recordings, most likely because neuronal membranes containing activated haGlyR α3185L channels filter out all fast mEPSCs.
We know from previous studies that activation of ionotropic glutamate receptors (iGluRs) and tyrosine kinase B (TrkB) receptors contribute to the regulation of Glu/GABA ratios of synaptic input [30]. Moreover, it was shown that brain-derived neurotrophic factor (BDNF) expression increases in epileptic hippocampi [34] and causes down-regulation of KCC2 [18–20, 34]. Therefore, we applied DNQX/MK801 and K252a to block iGluRs and TrkB receptors, respectively, during haGlyR α3185L expression in neurons with a high Cl− equilibrium potential. Indeed, Glu/GABA ratios were rescued in the presence of iGluR and TrkB receptor antagonists (Fig. 5A, see Table 3 for values). When iGluR activation was prohibited with DNQX and MK801 (Fig. 5B and C), haGlyR 3185L-expressing neurons were still contacted by more glutamatergic terminals (VGluT+ terminals [% of α3185P]: 149 ± 7), but loss of GABAergic terminals was entirely prevented (VGAT+ terminals [% of α3185P]: 95 ± 5). In control neurons, iGluR blockade had no effect on GABAergic terminals (VGAT+ terminals [% of α3185P]: 96 9) but, in agreement with the concept of homeostatic regulation [38],increased the number of glutamatergic synapses (VGluT+ terminals [% of 3185P]: 125 ± 8).
Table 3.
Effects of iGluR and TrkB receptor antagonists on Glu/GABA ratios of synaptic input to neurons expressing α3185P or α3185L
| — | DNQX / MK801 | K252a | |
|---|---|---|---|
| α3185P | 2.08 ± 0.05 | 2.72 ± 0.12 | 2.79 ± 0.11 |
| α3185L | 4.81 ± 0.24 | 3.17 ± 0.15 | 3.13 ± 0.15 |
In line with previous data [30], TrkBreceptor blockade (Fig. 5D and E) was not only capable of rescuing GABAergic synapses in contact with 3185L-positive neurons but increased their number beyond the control level (VGAT+ terminals [% of α3185P]: 120 ± 4). Gain in GABAergic terminals was also evident in α3185P-expressing control neurons (VGAT+ terminals [% of α3185P]: 118 ± 4). As for the experiments with DNQX/MK801, K252a up-regulated the number of glutamatergic terminals in both α3185L-expressing (VGluT+ terminals [% of 3185P]: 163 3) and control neurons (VGluT+ terminals [% of α3185P]: 143 ± 2). Therefore, Glu/GABA ratios of synaptic input to K252a-treated neurons were similar to those extracted from DNQX/MK801-supplemented cultures (Fig. 5A, Table 3).
In conclusion, we propose that down-regulation of GABAergic terminals in contact with inhibited, haGlyR α3185L-positive hippocampal neurons occurs secondarily to up-regulation of gluta-matergic terminals and is mediated by iGluRs and TrkB receptors.
iGluR and TrkB receptor activation reduces dendrite length of inhibited hippocampal neurons
Quantification of the number of dendrites exceeding 50 m (Fig. 6A) revealed reduced dendrite length of neurons with haGlyR α3185L (dendrites >50 μm, α3185P: 10.2 ± 0.4; α3185L: 7.0 ± 0.6). Because previous studies showed that dendrite elongation is negatively regulated by glutamatergic input [30, 39], and considering our observation of increased Glu/GABA ratios of synaptic input to haGlyR α3185L-expressing hippocampal neurons, increased glutamatergic signalling may have been responsible for reduction of dendrite length. The fact that we found the number of glutamatergic terminals and the number of dendrites exceeding 50 μm length to be inversely correlated (Fig. 6B) further argues in favour of this possibility. Furthermore, as it is known that TrkB receptor activation is capable of reducing dendrite length [30], we analyzed the ability of both iGluR and TrkB receptor blockades to reverse α3185L-associated reduction of dendrite length (Fig. 6C and D). Both iGluR and TrkB receptor antagonists were indeed effective in preventing reduction of dendrite length (dendrites >50 μm [% of α3185P]: α3185L: 45 ± 4, α3185L+ DNQX/MK801: 105 ± 5; α3185L: 29 ± 3, α3185L+ K252a: 108 ± 5). Actually, iGluR antagonists further increased the number of dendrites exceeding 50 m beyond the control level (dendrites > 50 μm [% of α3185P]: α3185P+ DNQX/MK801: 117 ± 6; α3185P+ K252a: 104 ± 3), presumably revealing a steady control of dendrite length by iGluR activation in these cultures. Therefore, reduced dendrite length in neurons with haGlyR 3185L is interpreted to occur as a consequence of elevated glutamatergic signalling.
Fig. 6.
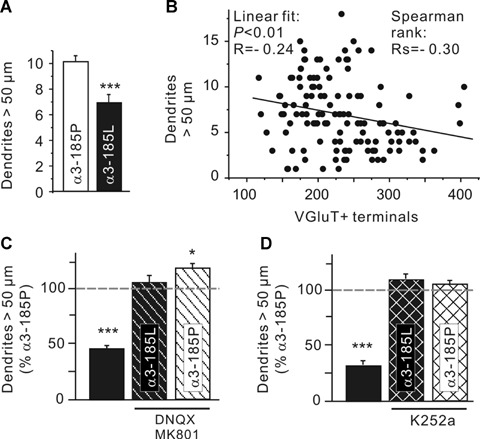
Activity-dependent regulation of dendrite length of hippocampal neurons with a high Cl− equilibrium potential. (A) The number of dendrites longer than 50 m is shown for control and GlyR α3185L-expressing hippocampal neurons. (B) Inverse correlation between the number of VGluT+ terminals and the number of dendrites longer than 50 m. (C, D) Effects of iGluR and TrkB receptor antagonists on dendrite length. Note that dendrite length is restored upon blockade of iGluRs or TrkB receptors. Also note that iGluR blockade increased the number of dendrites exceeding 50 m beyond the control level. Error bars indicate the S.E.M. of the mean values obtained from at least three independent experiments. Significance levels are P < 0.05 (*) and P < 0.001 (***).
haGlyR-mediated tonic inhibition increases neuronal susceptibility to excitotoxicity
The fact that haGlyR α3185L-expressing hippocampal neurons shifted their Glu/GABA ratios in favour of glutamatergic terminals and that elevated glutamatergic signalling was involved in reduction of dendrite length suggested that these neurons were more susceptible to cell death. To systematically investigate this possibility, we first analysed caspase-3 activation in both control (α3185P) and haGlyR α3185L-positive neurons. Neurons were cotransfected with GlyRs and the reporter construct caspase-3 sensor, which utilizes the activated caspase-3 consensus cleavage site DEVD for secession of a nuclear exclusion sequence (NES) [25, 40]. Upon NES cleavage by activated caspase-3, the reporter protein EYFP is translocated into the nucleus (Fig. 7A) with the aid of the remaining nuclear localization sequence. Accordingly, nuclear exclusion of the EYFP reporter protein indicates reduced or absent caspase-3 activation (Fig. 7B). Using this reporter construct, we found that both control and α3185L-positive neurons exhibited similar caspase-3 activation, expressed as percentages of GlyR-expressing neurons with nuclear caspase-3 sensor (Fig. 7C, days after transfection: dpt). Furthermore, in both control and 3185L-positive neurons nuclear enrichment with caspase-3 sensor delineated a similar time course after transfection (neurons with nuclear caspase-3 sensor [%], 3185P: dpt 1: 5 ± 1, dpt 2: 12 ± 6, dpt 3: 37 ± 2; α3185L: dpt 1: 7 ± 3, dpt 2: 9 ± 3, dpt 3: 28 ± 10; Fig. 7C). Because the percentages of neurons with activated caspase-3 were similar in both control and haGlyR 3185L-positive neurons, we conclude that caspase-3 activation occurred as a result of the transfection procedure.
Fig. 7.

Inhibited hippocampal neurons with a high Cl equilibrium potential undergo excitotoxicity. (A, B) Images show apoptotic (A, nuclear caspase-3 sensor enrichment) and non-apoptotic (B, nuclear caspase-3 sensor exclusion) control neurons. (C) Quantification of the percentages of apoptotic neurons at different time-points after transfection (days after transfection, dpt). (D) Quantification of the percentages of morphologically identified degenerated neurons, according to the presence of dendrite fragmentation and dendritic swellings. Note that a significant fraction of degenerated neurons is attributable to haGlyR α3185L expression. (E) Pharmacological profiles of degeneration of neurons expressinghaGlyR α3185L or GlyR α3185P. Note that blockade of iGluRs or KCC2 cotransfection rescues inhibited neurons, while blockade of TrkB receptors is ineffective. D: DNQX, M: MK801. Error bars indicate the S.E.M. of the mean values obtained from at least three independent experiments. Significance levels are P < 0.05 (*), P < 0.01 (**) and P < 0.001 (***). Scale bars: 10 μm.
However, according to the appearance of fragmented dendrites and dendritic swellings, an additional fraction of degenerating neurons was clearly attributable to haGlyR 3185L expression three days after transfection (Fig. 7D; fraction of neurons with dendrite fragmentation and dendritic swellings [%], 3185P: dpt 1: 15 ± 1, dpt 2: 17 ± 1, dpt 3: 31 ± 7; 3185L: dpt 1: 12 ± 1, dpt 2: 18 ± 4, dpt 3: 56 ± 1). Because our results so far point to elevated glutamatergic signalling as an executive mechanism of haGlyR 3185L-mediated activity deprivation, we investigated the potential of iGluR antagonists to rescue hippocampal neurons. Indeed, blockade of iGluRs with DNQX or MK801 rescued inhibited hippocampal neurons from degeneration (fraction of neurons with dendrite fragmentation and dendritic swellings at 3 dpt [% of α3185P]: α3185L+ DNQX: 111 ± 7, α3185L+ MK801: 83 ± 7).
However, a combined blockade of AMPA and NMDA receptors was not additive, neither in haGlyR 3185L-positive nor in control neurons (fraction of neurons with dendrite fragmentation and dendritic swellings at 3 dpt [% of α3185P]: α3185P+ DNQX + MK801: 86 ± 20; α3185L+ DNQX + MK801: 103 ± 18).
As iGluR antagonists also restored GABAergic terminals, it remained to be clarified whether recovery of GABAergic terminals would rescue inhibited neurons. Because of their capacity to restore GABAergic terminals, TrkB receptors were blocked during haGlyR expression. Irrespective of the GlyR variant expressed, K252a had no effect on neuron survival (fraction of neurons with dendrite fragmentation and dendritic swellings at 3 dpt [% of α3185P]: α3185L+ K252a: 154 ± 8, α3185P+ K252a: 102 ± 9).
Therefore, we can rule out the possibility that down-regulation of GABAergic terminals contributed to haGlyR 3185L-elicited neuron degeneration. Altogether, we conclude that the enhanced susceptibility of haGlyR 3185L-expressing neurons to degeneration reflects excitotoxicity mediated by iGluRs.
A decrease of Cl_ equilibrium potential by KCC2 expression rescues hippocampal neurons and Glu/GABA ratios
The results presented so far were obtained from hippocampal neurons with a high Cl− equilibrium potential. Because KCC2 down-regulation is known to cause a high Cl− equilibrium potential in TLE hippocampal neurons [18–20], we examined whether decreasing the Cl− equilibrium potential by KCC2 cotransfection with haGlyRs would restore Glu/GABA ratios of synaptic input, dendrite length and survival. KCC2 expression in cotransfection experiments indeed had the capacity to rescue hippocampal neurons from excitotoxicity (Fig. 7E; fraction of neurons with dendrite fragmentation and dendritic swellings at 3 dpt [% of α3185P]: α3185P+ KCC2: 96 ± 7, α3185L+ KCC2: 106 ± 13).
Decreasing the Cl− equilibrium potential byKCC2 cotransfection also restored GABAergic terminals in contact with haGlyR α3185L-positive neurons (Fig. 8A; VGAT+ terminals: α3185L: 41 ± 3; α3185L+ KCC2: 103 ± 4), even in the context of elevated glu-tamatergic innervation (Fig. 8B; VGluT+ terminals: α3185L: 269 ± 10; 3185L+ KCC2: 251 ± 9). In fact, KCC2 expression increased the number of GABAergic terminals in contact with inhibited neurons beyond the control level. Furthermore and in agreement with previous data [41], even control neurons that were cotransfected with KCC2 received more GABAergic terminals (Fig. 8A; VGAT+ terminals: 3185P+ KCC2: 96 3; 3185L+ KCC2: 103 4 versusα3185P: 84 3). Therefore, decreasing the Cl− equilibrium potential by KCC2 cotransfection was sufficient to also restore Glu/GABA ratios of synaptic input (Fig. 8C; Glu/GABA ratio: 3185L: 8.3 0.8; 3185L+ KCC2: 2.5 0.1 versus 3185P: 2.3 0.08), again even in the context of elevated glutamatergic innervation.
Fig. 8.

Decrease of the Cl equilibrium potential by KCC2 expression restores GABAergic synapses and Glu/GABA ratios. (A, B) VGAT+ and VGluT+ terminal counts obtained from hippocampal neurons expressing α3185P or α3185L, each alone or in combination with KCC2. (C) Resulting Glu/GABA ratios. (D) Number of dendrites exceeding 50 μm. Note that the decrease of the Cl equilibrium potential by KCC2 expression reverses the adverse effects of tonic inhibition of hippocampal neurons, except dendrite length. Also note that KCC2 expression increased the number of VGAT+ terminals beyond control level in both control and haGlyR α3185L-expressing neurons, while the number of VGluT+ terminals remained up-regulated in haGlyR α3185L-expressing neurons. Error bars indicate the S.E.M. of the mean values obtained from at least three independent experiments. Significance levels are P < 0.01 (**) and P 0.001 (***).
In conclusion, a decrease of the Cl− equilibrium potential by KCC2 expression reversed all adverse effects associated with haGlyR α3185L expression except dendrite length (Fig. 8D; dendrites 50 m: 3185L: 4.5 0.4; 3185L+ KCC2: 4.9 0.4), which remained reduced – most likely due to persistently increased glutamatergic innervation (Figs. 6 and 8B).
Discussion
The main findings of this study support the conclusion that suppression of spontaneous activity of hippocampal neurons with reduced KCC2 expression and a high Cl− equilibrium potential elicits TLE histopathological characteristics, in terms of elevated Glu/GABA ratios of synaptic input, reduced dendrite length and elevated susceptibility of hippocampal neurons to excitotoxicity [1, 2, 42, 43]. Accordingly, our study revealed elevated expression of high-affinity type GlyR 2 and 3 in hippocampectomies of TLE patients with a severe course of disease, according to the Wyler classification [21] of hippocampal sclerosis or the frequency of SGTCS. In addition, GlyR 2B [13] expression was found to be elevated in these patients. Finally, in TLE patients, increased haGlyR expression inversely correlated with KCC2 expression. On the basis of these complementary results, obtained from primary hippocampal neurons and from TLE patients, we suggest a scenario that implicates elevated haGlyR expression and consequently neuronal hypoactivity in the patho-physiology of TLE, provided that the neuronal Cl− equilibrium potential is high (Fig. 9).
Fig. 9.
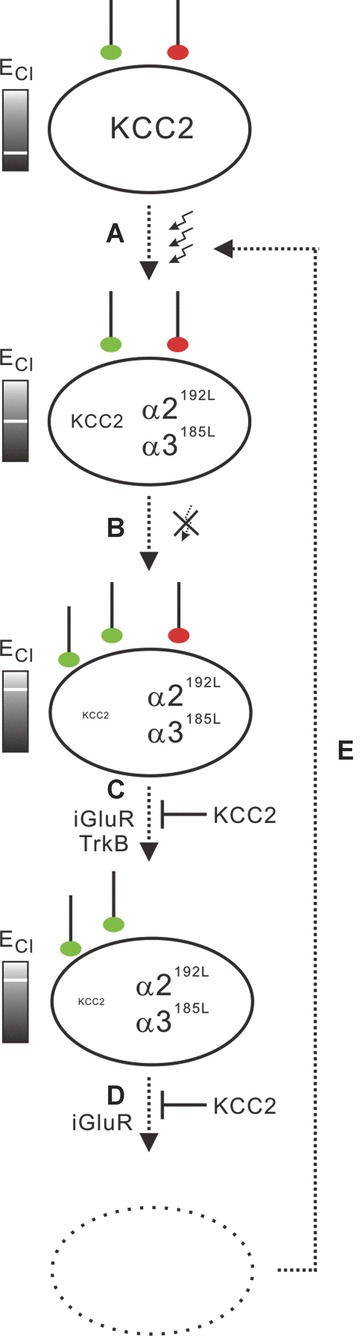
Proposed scenario involving inverse regulation of haGlyR and KCC2 expression in the course of TLE. (A) Neuronal stressors, such as epileptic seizures, provoke activity-dependent down-regulation of KCC2, which raises the Cl− equilibrium potential, and up-regulation of haGlyRs, which are capable of translating hippocampal ambient glycine into tonic inhibition. (B) Inhibited hippocampal neurons scale up their number of glutamatergic terminals (green), which drives down-regulation of KCC2 in a BDNF-dependent way. (C) In these neurons with high Cl− equilibrium potentials, down-regulation of GABAergic contacts (red) involves iGluRs and TrkB receptor signalling. (D) Finally, still in the context of a high Cl equilibrium potential, hippocampal neurons with upscaled glutamatergic and downscaled GABAergic synaptic inputs become vulnerable to excitotoxicity. (E) Neuron degeneration contributes to further decreasing seizure threshold. Importantly, a decrease of the Cl equilibrium potential by KCC2 expression rescued inhibited hippocampal neurons from both iGluR- and TrkB receptor-dependent downscaling of GABAergic terminals and from excitotoxic degeneration.
Human hippocampal neurons have the potential to generate haGlyR variants
We adapted the previously described method for quantification of haGlyR expression [17] to human Glra2 and Glra3 transcript sequences (Supplementary Fig. 1A) and validated this modified approach by calibration (Supplementary Fig. 1B). In addition, sequencing of genomic DNA ruled out the possibility that haGlyR α2575T (examples given in Supplementary Fig. 1C) and haGlyR α3554T (not shown) were of genomic origin. Thus, our results obtained from TLE patients provide evidence that GlyR C-to-U RNA editing is neither subunit nor species specific [17]. The affinities for glycine of RNA-edited α2A192L- and 2B192L-GlyRs are particularly high, allowing these receptors responding to submicromolar glycine levels (Supplementary Fig. 1D). Notably, haGlyR α2B192L responds to 0.1 μM glycine with currents reaching ∼15% of maximal current amplitudes (Supplementary Fig. 1D). Our data identified increased expression of GlyR α2B in W2–4 TLE patients, providing us with evidence to propose that human hippocampal cells have the potential to generate haGlyRs by alternative splicing of GlyR α2 transcripts and by C-to-U editing of all types of hippocampal ligand binding GlyR subunit mRNAs.
The affinity of haGlyRs approximates the level of hippocampal ambient glycine
Our hippocampal cell culture model system uses 5 μM glycine for selective activation of haGlyR α3185L[17]. We have chosen this glycine concentration also because it corresponds to the level of seizure-related hippocampal ambient glycine measured in TLE patients [16]. However, considering the GlyT-1 stoichiometry of substrate/ion cotransport (2 Na+/Cl /glycine) and the bi-directional character of GlyT-1 glycine transport, the level of hippocampal ambient glycine may actually be kept within the sub-micromolar range, which is optimal for functional modulation of NMDA-type glutamate receptors [44]. Nevertheless, given the voltage dependency of GlyT-1 glycine transport, it is conceivable that neuronal activity raises hippocam-pal ambient glycine to supramicromolar levels [15, 45], which may become particularly relevant when considering that neuronal high frequency activity is a precursor of recurrent epileptiform discharges [46]. Therefore, we consider the affinity of haGlyRs well suited for the translation of hippocampal ambient glycine into tonic inhibition, especially under conditions of sustained hip-pocampal network activity.
Thus, haGlyRs are functionally well adjusted for translation of hippocampal ambient glycine into tonic glycinergic inhibition, potentially providing a cellular basis for the recently uncovered hypoactivity of hippocampal neurons in cases of TLE [47, 48]. Although the time course of disease progression was heterogeneous in the TLE patients investigated here (see Table 1), elevated haGlyR expression occurred in a large fraction of patients with a severe course of disease or frequent SGTCS. This suggests that up-regulation of haGlyR expression may occur in response to neu-ronal stressors, such as aberrant high frequency activity [46], and that it persists in TLE patients beyond the initial insult. Altogether, our results suggest that haGlyRs are candidate molecules potentially contributing to the course of TLE by increasing tonic glycinergic inhibition, even in neurons with a high Cl− equilibrium potential.
A hippocampal cell culture system fordetermina-tion of the consequences of neuronal hypoactivity in the context of a high Cl_ equilibrium potential
We established a hippocampal cell culture system to characterize the potential consequences of elevated haGlyR expression in the context of reduced KCC2 expression and a high Cl− equilibrium potential. For this purpose, we used hippocampal neurons at a developmental state when their Cl− equilibrium potential was high, as is the case in TLE patients [20]. Furthermore, the glycine concentration present during GlyR expression approximated hippocampal ambient glycine measured in TLE patients [16] and selectively activated haGlyR α3185L[17]. Importantly, both the suppression of spontaneous Ca2+ transients and AP generation by haGlyR activation renders our system suitable for elucidation of potential consequences of neuronal hypoactivity in the context of a high Cl− equilibrium potential, which is characteristic for TLE [48]. Thereby, haGlyR activation likely shunts excitatory inputs because similar resting membrane potentials were measured in perforated patch clamp recordings, irrespective of the GlyR variant expressed. Furthermore, decreased membrane resistances and more positive membrane potentials were determined in the whole-cell configuration in neurons with activated haGlyRs. Finally, this system allowed us to investigate whether decreasing the Cl− equilibrium potential would be sufficient to reverse the consequences of haGlyR α3185L-elicited neuronal hypoactivity.
Disequilibrated iGluR and TrkB receptor signalling constitute executive mechanisms of haGlyR α3185L-mediated tonic inhibition
The fact that the resting membrane potential and resting Ca2+ levels were not affected by haGlyR α3185L expression indicates that the consequences of increased tonic glycinergic inhibition on hippocampal neurons were indirect. Indeed, all effects associated with haGlyR α3185L activation were reversible upon application of iGluR antagonists. Because increased BDNF expression occurs in epileptic hippocampi [34] and causes down-regulation of KCC2 [18–20, 34], we additionally evaluated the potential of TrkB receptor blockade to rescue hippocampal haGlyR 3185L-expressing neurons, in the context of a high Cl− equilibrium potential. According to these data, we propose that disequilibrated TrkB receptor [18, 34, 49] and iGluR signalling [1] account for the emergence of TLE-characteristic histopathological signs. Although our results do not allow for distinction between presynaptic [50] and postsynaptic [30] BDNF-release from glutamatergic synapses, they lend support to a convergent regulatory signalling pathway within the postsynaptic neuron [51]. However, the fact that TrkB receptor blockade was not sufficient to rescue hip-pocampal neurons from degeneration, and considering that antagonists of iGluRs or KCC2 expression were neuroprotective, accentuates the involvement of excitotoxicity. Because spontaneous neuronal activity was mainly driven by GABAARs in these hippocampal neurons, our results favour the possibility that excitotoxicity relied on activation of extrasynaptic iGluRs [52].
haGlyR α3185L-elicited effects are conditional upon a high Cl_ equilibrium potential
In the mature nervous system neuronal activity-deprivation is compensated for by concomitant up-regulation of glutamatergic and GABAergic synapses [53]. However, reducing neuronal activity within a developing, immature neuronal network is known to cause loss of GABAergic synapses, which potentially reflects failure of synchronization of glutamatergic and GABAergic postsynaptic currents [54]. All the consequences of haGlyR α3185L-mediated tonic inhibition were obvious in neurons with a high Cl− equilibrium potential, which corresponds to an early developmental status of the neuronal network. Because the epileptic neuronal network is characterized by KCC2 down-regulation and, hence, depolarizing GABAergic currents [19], we analysed the potential of KCC2 expression to rescue hippocampal neurons. Decreasing the Cl− equilibrium potential by KCC2 expression indeed rescued Glu/GABA ratios in contact with inhibited neurons and, in addition, exerted neuroprotective effects. Although our data do not permit drawing conclusions on the underlying mechanisms, they highlight the deleterious aspect of enhanced tonic inhibition, which is conditional according to the Cl− equilibrium potential of inhibited neurons.
The fact that dendrite length was not restored upon decreasing the Cl− equilibrium potential by KCC2 expression may reflect persistently increased glutamatergic signalling to inhibited neurons, which is substantiated by the inverse correlation between the number of glutamatergic terminals and dendrite length that we and others [30] observed. In addition, this argumentation is in line with the formerly established concept of negative regulation of dendrite length by glutamatergic signalling [39]. Moreover, the possibility that loss of depolarising GABAergic terminals was responsible for reduced dendrite length was ruled out because KCC2 expression decreased the Cl− equilibrium potential, which did not further reduce dendrite length of inhibited neurons.
Activity-deprivation results in homeostatic but pathophysiological, structural reorganization reminiscent of TLE histopathology
Recently it was shown that activity deprivation leads to seizures in hippocampal slice cultures [55]. Our data are in agreement with this observation because it establishes a coherency between hypoactivity of hippocampal neurons with a high Cl− equilibrium potential and TLE-typical histopathological features. Moreover, we found elevated levels of haGlyR expression to be associated with hippocampal damage and the frequency of SGTCS. Furthermore, we provide evidence for the involvement of homeostatic, but pathophysiological, recruitment of iGluR and TrkB receptor signalling in the emergence of TLE-reminiscent histopathological features. In this regard, we would like to put forward a chain of events implicating inverse regulation of haGlyR and KCC2 expression in the course of TLE. According to the proposed scenario (Fig. 9), seizure activity triggers BDNF- and TrkB receptor-dependent down-regulation of KCC2 [18, 34] together with up-regulation of haGlyR expression (Fig. 9A). haGlyRs respond to hippocampal ambient glycine with tonic inhibition, and inhibited neurons upscale their number of presynaptic glutamatergic terminals (Fig. 9B). In the context of a high Cl− equilibrium potential, down-regulation of the number of GABAergic contacts then develops secondarily from increased glutamate- and BDNF-dependent sig-nalling (Fig. 9C). Neurons with upscaled glutamatergic and down-scaled GABAergic inputs become vulnerable to excitotoxicity (Fig. 9D), which can be prevented by blockade of iGluRs or KCC2 expression. In the course of TLE, hippocampal neurons can therefore embark on the strategy of cellular hypoactivity only if their Cl− equilibrium potential is low.
Acknowledgments
We thank Carola Bernert for excellent technical assistance and Silke Dusatko for assistance with hippocampal cell cultures and immunocyto-chemistry. The caspase-3 sensor expression construct was kindly provided by Heiko Luhmann (University of Mainz, Germany). KCC2 expression constructs were kindly provided by Claudio Rivera (University of Helsinki, Finland) and Karl Kandler (University of Pittsburgh, PA, USA). We thank Catherine Krull (University of Missouri-Columbia, MO, USA) for initial assembly of the pMES expression vector. This work was supported by the DFG (ME2075/3–1 to JCM and Sonderforschungsbereich Grant TR3/B5 to TG and JCM) and Helmholtz Association (VH-NG-246 to JCM).
Supplementary material
The following supplementary material is available for this article:
Fig. S1 GlyRs a2A192L and a2B192Lare high affinity receptors. Supplemental information.Supplemental methods; results; reference; figure legend.
This material is available as part of the online article from: http://www.blackwell-synergy.com/doi/abs/10.1111/j.1582–4934.2007.00357.x (This link will take you to the article abstract).
Please note: Blackwell Publishing are not responsible for the content or functionality of any supplementary materials supplied by the authors. Any queries (other than missing material) should be directed to the corresponding author for the article.
References
- 1.Stief F, Zuschratter W, Hartmann K, Schmitz D, Draguhn A. Enhanced synaptic excitation-inhibition ratio in hippocampal interneurons of rats with temporal lobe epilepsy. Eur J Neurosci. 2007;25:519–28. doi: 10.1111/j.1460-9568.2006.05296.x. [DOI] [PubMed] [Google Scholar]
- 2.Bouilleret V, Loup F, Kiener T, Marescaux C, Fritschy JM. Early loss of interneurons and delayed subunit-specific changes in GABA(A)-receptor expression in a mouse model of mesial temporal lobe epilepsy. Hippocampus. 2000;10:305–24. doi: 10.1002/1098-1063(2000)10:3<305::AID-HIPO11>3.0.CO;2-I. [DOI] [PubMed] [Google Scholar]
- 3.Cossart R, Bernard C, Ben Ari Y. Multiple facets of GABAergic neurons and synapses: multiple fates of GABA signalling in epilepsies. Trends Neurosci. 2005;28:108–15. doi: 10.1016/j.tins.2004.11.011. [DOI] [PubMed] [Google Scholar]
- 4.Wang W, Xu TL. Chloride homeostasis differentially affects GABA(A) receptor- and glycine receptor-mediated effects on spontaneous circuit activity in hippocampal cell culture. Neurosci Lett. 2006;406:11–6. doi: 10.1016/j.neulet.2006.06.064. [DOI] [PubMed] [Google Scholar]
- 5.Bedet C, Bruusgaard JC, Vergo S, Groth-Pedersen L, Eimer S, Triller A, Vannier C. Regulation of gephyrin assembly and glycine receptor synaptic stability. J Biol Chem. 2006;281:30046–56. doi: 10.1074/jbc.M602155200. [DOI] [PubMed] [Google Scholar]
- 6.Meier J, Grantyn R. A gephyrin-related mechanism restraining glycine receptor anchoring at GABAergic synapses. J Neurosci. 2004;24:1398–405. doi: 10.1523/JNEUROSCI.4260-03.2004. [DOI] [PMC free article] [PubMed] [Google Scholar]
- 7.Zhang LH, Gong N, Fei D, Xu L, Xu TL. Glycine uptake regulates hippocampal network activity via glycine receptor-mediated tonic inhibition. Neuropsychopharmacology. 2008;33:701–11. doi: 10.1038/sj.npp.1301449. [DOI] [PubMed] [Google Scholar]
- 8.Song W, Chattipakorn SC, McMahon LL. Glycine-gated chloride channels depress synaptic transmission in rat hippocampus. J Neurophysiol. 2006;95:2366–79. doi: 10.1152/jn.00386.2005. [DOI] [PubMed] [Google Scholar]
- 9.Mori M, Gähwiler BH, Gerber U. Beta-Alanine and taurine as endogenous agonists at glycine receptors in rat hippocampus in vitro. J Physiol. 2002;539:191–200. doi: 10.1113/jphysiol.2001.013147. [DOI] [PMC free article] [PubMed] [Google Scholar]
- 10.Chattipakorn SC, McMahon LL. Strychnine-sensitive glycine receptors depress hyperexcitability in rat dentate gyrus. J Neurophysiol. 2003;89:1339–42. doi: 10.1152/jn.00908.2002. [DOI] [PubMed] [Google Scholar]
- 11.Kirchner A, Breustedt J, Rosche B, Heinemann UF, Schmieden V. Effects of taurine and glycine on epileptiform activity induced by removal of Mg2+ in combined rat entorhinal cortex-hippocampal slices. Epilepsia. 2003;44:1145–52. doi: 10.1046/j.1528-1157.2003.01603.x. [DOI] [PubMed] [Google Scholar]
- 12.El Idrissi A, Messing J, Scalia J, Trenkner E. Prevention of epileptic seizures by taurine. Adv Exp Med Biol. 2003;526:515–25. doi: 10.1007/978-1-4615-0077-3_62. [DOI] [PubMed] [Google Scholar]
- 13.Miller PS, Harvey RJ, Smart TG. Differential agonist sensitivity of glycine receptor alpha2 subunit splice variants. Br J Pharmacol. 2004;143:19–26. doi: 10.1038/sj.bjp.0705875. [DOI] [PMC free article] [PubMed] [Google Scholar]
- 14.Nikolic Z, Laube B, Weber RG, Lichter P, Kioschis P, Poustka A, Mulhardt C, Becker CM. The human glycine receptor subunit alpha3. Glra3 gene structure, chromosomal localization, and functional characterization of alternative transcripts. J Biol Chem. 1998;273:19708–14. doi: 10.1074/jbc.273.31.19708. [DOI] [PubMed] [Google Scholar]
- 15.Roux MJ, Supplisson S. Neuronal and glial glycine transporters have different stoichiometries. Neuron. 2000;25:373–83. doi: 10.1016/s0896-6273(00)80901-0. [DOI] [PubMed] [Google Scholar]
- 16.Wilson CL, Maidment NT, Shomer MH, Behnke EJ, Ackerson L, Fried I, Engel J., Jr Comparison of seizure related amino acid release in human epileptic hippocampus versus a chronic, kainate rat model of hippocampal epilepsy. Epilepsy Res. 1996;26:245–54. doi: 10.1016/s0920-1211(96)00057-5. [DOI] [PubMed] [Google Scholar]
- 17.Meier JC, Henneberger C, Melnick I, Racca C, Harvey RJ, Heinemann U, Schmieden V, Grantyn R. RNA editing produces glycine receptor 3P185L resulting in high agonist potency. Nat Neurosci. 2005;8:736–44. doi: 10.1038/nn1467. [DOI] [PubMed] [Google Scholar]
- 18.Rivera C, Li H, Thomas-Crusells J, Lahtinen H, Viitanen T, Nanobashvili A, Kokaia Z, Airaksinen MS, Voipio J, Kaila K, Saarma M. BDNF-induced TrkB activation down-regulates the K+-Cl- cotrans-porter KCC2 and impairs neuronal Cl-extrusion. J Cell Biol. 2002;159:747–52. doi: 10.1083/jcb.200209011. [DOI] [PMC free article] [PubMed] [Google Scholar]
- 19.Wake H, Watanabe M, Moorhouse AJ, Kanematsu T, Horibe S, Matsukawa N, Asai K, Ojika K, Hirata M, Nabekura J. Early changes in KCC2 phosphorylation in response to neuronal stress result in functional downregulation. J Neurosci. 2007;27:1642–50. doi: 10.1523/JNEUROSCI.3104-06.2007. [DOI] [PMC free article] [PubMed] [Google Scholar]
- 20.Palma E, Amici M, Sobrero F, Spinelli G, Di AS, Ragozzino D, Mascia A, Scoppetta C, Esposito V, Miledi R, Eusebi F. Anomalous levels of Cl- transporters in the hippocampal subiculum from temporal lobe epilepsy patients make GABA excitatory. Proc Natl Acad Sci USA. 2006;103:8465–8. doi: 10.1073/pnas.0602979103. [DOI] [PMC free article] [PubMed] [Google Scholar]
- 21.Davies KG, Hermann BP, Dohan FC, Jr, Foley KT, Bush AJ, Wyler AR. Relationship of hippocampal sclerosis to duration and age of onset of epilepsy, and childhood febrile seizures in temporal lobectomy patients. Epilepsy Res. 1996;24:119–26. doi: 10.1016/0920-1211(96)00008-3. [DOI] [PubMed] [Google Scholar]
- 22.Brewer GJ, Cotman CW. Survival and growth of hippocampal neurons in defined medium at low density: advantages of a sandwich culture technique or low oxygen. Brain Res. 1989;494:65–74. doi: 10.1016/0006-8993(89)90144-3. [DOI] [PubMed] [Google Scholar]
- 23.Swartz ME, Eberhart J, Pasquale EB, Krull CE. EphA4/ephrin-A5 interactions in muscle precursor cell migration in the avian forelimb. Development. 2001;128:4669–80. doi: 10.1242/dev.128.23.4669. [DOI] [PubMed] [Google Scholar]
- 24.Lee H, Chen CX, Liu YJ, Aizenman E, Kandler K. KCC2 expression in immature rat cortical neurons is sufficient to switch the polarity of GABA responses. Eur J Neurosci. 2005;21:2593–9. doi: 10.1111/j.1460-9568.2005.04084.x. [DOI] [PMC free article] [PubMed] [Google Scholar]
- 25.Golbs A, Heck N, Luhmann HJ. A new technique for real-time analysis of caspase-3 dependent neuronal cell death. J Neurosci Methods. 2006;161:234–43. doi: 10.1016/j.jneumeth.2006.11.011. [DOI] [PubMed] [Google Scholar]
- 26.Pfeiffer F, Simler R, Grenningloh G, Betz H. Monoclonal antibodies and peptide mapping reveal structural similarities between the subunits of the glycine receptor of rat spinal cord. Proc Natl Acad Sci USA. 1984;81:7224–7. doi: 10.1073/pnas.81.22.7224. [DOI] [PMC free article] [PubMed] [Google Scholar]
- 27.Dumoulin A, Rostaing P, Bedet C, Levi S, Isambert MF, Henry JP, Triller A, Gasnier B. Presence of the vesicular inhibitory amino acid transporter in GABAergic and glycinergic synaptic terminal boutons. J Cell Sci. 1999;112:811–23. doi: 10.1242/jcs.112.6.811. [DOI] [PubMed] [Google Scholar]
- 28.Herzog E, Bellenchi GC, Gras C, Bernard V, Ravassard P, Bedet C, Gasnier B, Giros B, El Mestikawy S. The existence of a second vesicular glutamate transporter specifies subpopulations of glutamatergic neurons. J Neurosci. 2001;21:RC181. doi: 10.1523/JNEUROSCI.21-22-j0001.2001. [DOI] [PMC free article] [PubMed] [Google Scholar]
- 29.Williams JR, Sharp JW, Kumari VG, Wilson M, Payne JA. The neuron-specific K-Cl cotransporter, KCC2. Antibody development and initial characterization of the protein. J Biol Chem. 1999;274:12656–64. doi: 10.1074/jbc.274.18.12656. [DOI] [PubMed] [Google Scholar]
- 30.Singh B, Henneberger C, Betances D, Arevalo MA, Rodriguez-Tebar A, Meier JC, Grantyn R. Altered balance of gluta-matergic/GABAergic synaptic input and associated changes in dendrite morphology after BDNF expression in BDNF-deficient hippocampal neurons. J Neurosci. 2006;26:7189–200. doi: 10.1523/JNEUROSCI.5474-05.2006. [DOI] [PMC free article] [PubMed] [Google Scholar]
- 31.Salama-Cohen P, Arevalo MA, Meier J, Grantyn R, Rodriguez-Tebar A. NGF controls dendrite development in hippocampal neurons by binding to p75NTR and modulating the cellular targets of notch. Mol Biol Cell. 2005;16:339–47. doi: 10.1091/mbc.E04-05-0438. [DOI] [PMC free article] [PubMed] [Google Scholar]
- 32.Ferrer I. Neurons and their dendrites in frontotemporal dementia. Dement Geriatr Cogn Disord. 1999;10:55–60. doi: 10.1159/000051214. [DOI] [PubMed] [Google Scholar]
- 33.Heinrich C, Nitta N, Flubacher A, Muller M, Fahrner A, Kirsch M, Freiman T, Suzuki F, Depaulis A, Frotscher M, Haas CA. Reelin deficiency and displacement of mature neurons, but not neurogenesis, underlie the formation of granule cell dispersion in the epileptic hippocampus. J Neurosci. 2006;26:4701–13. doi: 10.1523/JNEUROSCI.5516-05.2006. [DOI] [PMC free article] [PubMed] [Google Scholar]
- 34.Rivera C, Voipio J, Thomas-Crusells J, Li H, Emri Z, Sipila S, Payne JA, Minichiello L, Saarma M, Kaila K. Mechanism of activity-dependent down-regulation of the neuron-specific K-Cl cotransporter KCC2. J Neurosci. 2004;24:4683–91. doi: 10.1523/JNEUROSCI.5265-03.2004. [DOI] [PMC free article] [PubMed] [Google Scholar]
- 35.Levi S, Logan SM, Tovar KR, Craig AM. Gephyrin is critical for glycine receptor clustering but not for the formation of functional GABAergic synapses in hippocampal neurons. J Neurosci. 2004;24:207–17. doi: 10.1523/JNEUROSCI.1661-03.2004. [DOI] [PMC free article] [PubMed] [Google Scholar]
- 36.Liu G. Local structural balance and functional interaction of excitatory and inhibitory synapses in hippocampal dendrites. Nat Neurosci. 2004;7:373–9. doi: 10.1038/nn1206. [DOI] [PubMed] [Google Scholar]
- 37.Ben-Ari Y. Developing networks play a similar melody. Trends Neurosci. 2001;24:353–60. doi: 10.1016/s0166-2236(00)01813-0. [DOI] [PubMed] [Google Scholar]
- 38.Turrigiano GG, Nelson SB. Homeostatic plasticity in the developing nervous system. Nat Rev Neurosci. 2004;5:97–107. doi: 10.1038/nrn1327. [DOI] [PubMed] [Google Scholar]
- 39.Lohmann C, Finski A, Bonhoeffer T. Local calcium transients regulate the spontaneous motility of dendritic filopodia. Nat Neurosci. 2005;8:305–12. doi: 10.1038/nn1406. [DOI] [PubMed] [Google Scholar]
- 40.Talanian RV, Quinlan C, Trautz S, Hackett MC, Mankovich JA, Banach D, Ghayur T, Brady KD, Wong WW. Substrate specificities of caspase family proteases. J Biol Chem. 1997;272:9677–82. doi: 10.1074/jbc.272.15.9677. [DOI] [PubMed] [Google Scholar]
- 41.Chudotvorova I, Ivanov A, Rama S, Hubner CA, Pellegrino C, Ben Ari Y, Medina I. Early expression of KCC2 in rat hippocampal cultures augments expression of functional GABA synapses. J Physiol. 2005;566:671–9. doi: 10.1113/jphysiol.2005.089821. [DOI] [PMC free article] [PubMed] [Google Scholar]
- 42.Loup F, Wieser HG, Yonekawa Y, Aguzzi A, Fritschy JM. Selective alterations in GABAA receptor subtypes in human temporal lobe epilepsy. J Neurosci. 2000;20:5401–19. doi: 10.1523/JNEUROSCI.20-14-05401.2000. [DOI] [PMC free article] [PubMed] [Google Scholar]
- 43.Kumar SS, Buckmaster PS. Hyperexcitability, interneurons, and loss of GABAergic synapses in entorhinal cortex in a model of temporal lobe epilepsy. J Neurosci. 2006;26:4613–23. doi: 10.1523/JNEUROSCI.0064-06.2006. [DOI] [PMC free article] [PubMed] [Google Scholar]
- 44.Martina M, Turcotte ME, Halman S, Tsai G, Tiberi M, Coyle JT, Bergeron R. Reduced glycine transporter type 1 expression leads to major changes in glu-tamatergic neurotransmission of CA1 hip-pocampal neurones in mice. J Physiol. 2005;563:777–93. doi: 10.1113/jphysiol.2004.080655. [DOI] [PMC free article] [PubMed] [Google Scholar]
- 45.Supplisson S, Roux MJ. Why glycine transporters have different stoichiometries. FEBS Lett. 2002;529:93–101. doi: 10.1016/s0014-5793(02)03251-9. [DOI] [PubMed] [Google Scholar]
- 46.Behrens CJ, van den Boom LP, Heinemann U. Effects of the GABA(A) receptor antagonists bicuculline and gabazine on stimulus-induced sharp wave-ripple complexes in adult rat hippocampus in vitro. Eur J Neurosci. 2007;25:2170–81. doi: 10.1111/j.1460-9568.2007.05462.x. [DOI] [PubMed] [Google Scholar]
- 47.Harvey BD, Sloviter RS. Hippocampal granule cell activity and c-Fos expression during spontaneous seizures in awake, chronically epileptic, pilocarpine-treated rats: implications for hippocampal epilep-togenesis. J Comp Neurol. 2005;488:442–63. doi: 10.1002/cne.20594. [DOI] [PubMed] [Google Scholar]
- 48.Sloviter RS, Zappone CA, Harvey BD, Frotscher M. Kainic acid-induced recurrent mossy fiber innervation of dentate gyrus inhibitory interneurons: possible anatomical substrate of granule cell hyper-inhibition in chronically epileptic rats. J Comp Neurol. 2006;494:944–60. doi: 10.1002/cne.20850. [DOI] [PMC free article] [PubMed] [Google Scholar]
- 49.He XP, Kotloski R, Nef S, Luikart BW, Parada LF, McNamara JO. Conditional deletion of TrkB but not BDNF prevents epileptogenesis in the kindling model. Neuron. 2004;43:31–42. doi: 10.1016/j.neuron.2004.06.019. [DOI] [PubMed] [Google Scholar]
- 50.Hartmann M, Heumann R, Lessmann V. Synaptic secretion of BDNF after high-frequency stimulation of glutamatergic synapses. EMBO J. 2001;20:5887–97. doi: 10.1093/emboj/20.21.5887. [DOI] [PMC free article] [PubMed] [Google Scholar]
- 51.Suzuki K, Sato M, Morishima Y, Nakanishi S. Neuronal depolarization controls brain-derived neurotrophic factor-induced upregulation of NR2C NMDA receptor via calcineurin signaling. J Neurosci. 2005;25:9535–43. doi: 10.1523/JNEUROSCI.2191-05.2005. [DOI] [PMC free article] [PubMed] [Google Scholar]
- 52.Zhang SJ, Steijaert MN, Lau D, Schutz G, ucinge-Vivier C, Descombes P, Bading H. Decoding NMDA receptor signaling: identification of genomic programs specifying neuronal survival and death. Neuron. 2007;53:549–62. doi: 10.1016/j.neuron.2007.01.025. [DOI] [PubMed] [Google Scholar]
- 53.Burrone J, O’Byrne M, Murthy VN. Multiple forms of synaptic plasticity triggered by selective suppression of activity in individual neurons. Nature. 2002;420:414–8. doi: 10.1038/nature01242. [DOI] [PubMed] [Google Scholar]
- 54.Tao HW, Poo MM. Activity-dependent matching of excitatory and inhibitory inputs during refinement of visual receptive fields. Neuron. 2005;45:829–36. doi: 10.1016/j.neuron.2005.01.046. [DOI] [PubMed] [Google Scholar]
- 55.Trasande CA, Ramirez JM. Activity deprivation leads to seizures in hippocampal slice cultures: is epilepsy the consequence of homeostatic plasticity? J Clin Neurophysiol. 2007;24:154–64. doi: 10.1097/WNP.0b013e318033787f. [DOI] [PubMed] [Google Scholar]
Associated Data
This section collects any data citations, data availability statements, or supplementary materials included in this article.