

Abstract
‘Cancer stem cells’ or ‘tumour initiating cells’ in B-cell non-Hodgkin lymphomas have not been demonstrated, although some studies focused on other cancer types suggest that such populations exist and represent tumour cells resistant to therapy and involved in relapse. These cells may also represent a putative neoplastic ‘cell of origin’ in lymphomas, but there is little substantive data to support this suggestion. Using cell lines derived from a recently established murine IL-14α× c-Myc double transgenic/mantle cell lymphoma-blastoid variant model, heretofore referred to as DTG cell lines, we identified a subset of cells within the side population (SP) with features of ‘tumour-initiating cells’. These features include higher expression of ABCG2 and BCL-2, longer telomere length, greater self-renewal ability and higher in vitro clonogenic and in vivo tumorigenic capacities compared with non-SP. In addition, in vitro viability studies demonstrated that the non-SP lymphoma subpopulation has a limited lifespan in comparison with the SP fraction. Syngenic transplant studies showed that non-SP derived tumours, in comparison to the SP-derived tumours, exhibit greater necrosis/apoptosis and less systemic dissemination capability. In conclusion, our data support the interpretation that the DTG SP fraction contains a cell population highly capable of tumour maintenance and systemic dissemination and lends support to the concept that ‘tumour-initiating cells’ occur in lymphomas.
Keywords: side population, cancer stem cells, tumour initiating cells, lymphoma cell lines
Introduction
‘Cancer stem-cells’ or ‘tumour-initiating cells’ have been defined, by analogy with normal stem-cells, as cells that have the capacity to self-renew, that is to divide and generate more ‘cancer stem-cells’ as well as to differentiate into the variety of neoplastic cells found in tumours [1, 2] The identification and isolation of tumour initiating cells is important because they represent potential candidates responsible for tumour chemoresistance and relapse and could be the cell of origin of tumours.
Several approaches have been explored to identify and isolate cancer stem-cells. One of these methods is side population (SP) analysis. This analysis is based on a technique described by Goodell et al.[3] who observed that when bone marrow-derived cells are incubated with Hoechst 33342, a cell-permeable DNA-specific bisbenzimidazole dye, and then analysed by dual-wavelength flow cytometry, a small population of cells does not accumulate an appreciable amount of dye. This population, identified as the SP cell fraction, is capable of pumping out the vital dye Hoechst 33342. The non-SP cells appear as the Hoechst high fraction because they retain high levels of Hoechst dye staining; they are also referred to as the main population. Later studies attributed the SP phenotype to the expression of ATP-binding cassette (ABC) transporters, which efflux Hoechst dye and chemotherapeutic drugs out of the cells [4]. SP analysis has been commonly used as one of the methods for enriching for ‘tumour-initiating cells’ in cancer cell lines and primary tumour cultures [5–15]. Others have shown in other systems that the SP phenotype correlates with a distinct cell population enriched for primitive and undifferentiated cells [16].
There is evidence that some acute and chronic leukaemia and some solid tumours may contain ‘tumour-initiating cells’ and a cell hierarchy similar of that observed in normal tissues from which a tumour arises [7, 17, 18]. This view, inspired by the unique capacity of the normal haematopoietic stem-cells to restore long-term haematopoiesis in myeloablated mice, postulates that most cells in a tumour lack self-renewal potential and, hence, do not contribute significantly to tumour perpetuation. Although research is rapidly advancing in this field, to our knowledge, there are no published reports examining the presence and/or role of SP cells in non-Hodgkin lymphomas and only rare papers address the issue of tumour initiating cells in lymphomas [19].
Non-Hodgkin lymphomas have been increasing in incidence over the last three decades [20, 21] and are a heterogeneous group of lymphoid tumours, more than 80% of which are of B-cell lineage. One type of B-cell non-Hodgkin lymphoma with a poor prognosis is mantle cell lymphoma (MCL). MCL is distinctive B-cell non-Hodgkin lymphoma characterized by CD5 and cyclin D1 expression and the t(11;14)(q13;q32). In addition to involvement of lymph nodes, the spleen, bone marrow and gastrointestinal tract are commonly involved and approximately 25% of patients have a leukemic phase. There is also a blastoid variant (BV) of MCL, representing 10–20% of cases, that is particularly aggressive clinically and has high-grade histological features.
Recently, Ford et al.[22] have established an IL-14α× c-Myc double transgenic (DTG)/MCL-BV model. The animals, referred to as DTG mice, develop an aggressive, monoclonal B-cell lymphoma, positive for CD5 and cyclin D1 with features consistent with human MCL-BV [22]. Using this model, we found that DTG lymphoma cell lines have a surprisingly large SP fraction (up to 6%) and that this subpopulation is enriched for cells with at least some features of ‘tumour-initiating cells’. Our data support the interpretation that the DTG SP fraction contains a cell population essential for tumour maintenance and systemic dissemination and lends support to the concept that ‘tumour-initiating cells’ occur in lymphomas.
Material and methods
Cell lines
Two permanent DTG lymphoma cell lines (designated as 105340 and 101913) were obtained from IL-14α× c-Myc DTG mice. Detailed methods on the transgenic constructions and production of the single transgenic parenteral strains (IL-14TG and c-MycTG) as well as the transgenic model have been described [22, 23]. The cell lines were maintained at 37°C in RPMI 1640 media (Life Technologies, Grand Island, NY, USA) supplemented with 10% heat inactivated (56°C for 30 min.) foetal bovine serum (FBS, Sigma Chemical, St Louis, MO, USA) in a humidified atmosphere containing 5% CO2.
Side population and cell sorting
The SP and the non-SP fractions of the DTG lymphoma cell lines were identified and isolated using the DNA-binding dye Hoechst 33342 (Sigma) and flow cytometry sorting based on the protocol described by Goodell et al.[3]. A total of 5 × 10⁷cells were stained with the DNA-binding dye Hoechst 33342 in a final concentration of 5 μg/ml (37°C for 1.5 hrs in the dark), either alone or in the presence of 50 or 100 μmol/l verapamil (Sigma). At the end of incubation, cells were spun down in the cold and resuspended in cold HBSS containing 2% FBS and 10 mM Hepes. One microgram per millilitre of propidium iodine (PI) (Sigma) was also added and used for the discrimination of dead cells. As a control for the SP method, we used the HL60-Dox cell line (HL60 cells chronically exposed to a low concentration of doxorubicin; courtesy of Dr M. Andreeff, M.D. Anderson Cancer Center) which is enriched with high numbers of SP cells. SP cells and non-SP cells were sorted directly into RPMI 1640 10% FBS culture medium. Cell sorting was performed with a FACS Vantage (BD Pharmingen, San Jose, CA, USA). Hoechst 33342 was excited with the UV laser at 350 nm and fluorescence emission was measured with 405/BP30 (Hoechst blue) and 570/BP20 (Hoechst red) optical filters. PI labelling was measured through the 625/BP30 filter. For SP analysis and cell sorting the gates were placed using the verapamil control tube. Hence, only cells negative for Hoechst were included in the SP gate. Conversely, the non-SP gate only included cells positive for Hoechst (cells without efflux potential). Importantly, the non-SP gate was shifted to the right and lower side of the histogram to ensure that a population defined as ‘upper-SP’ is not included in the non-SP gate. The ‘upper-SP’ fraction represents cells with high DNA content [24], that, in our experience, disappears after incubation with verapamil indicating that these cells have functional ATP binding cassettes and therefore should be excluded from the non-SP gate. For size analysis of the SP fraction, mean forward scatter values from several experiments were used.
Immunofluorescence labelling of ABCG2 and confocal microscopy
Immunofluorescence labelling was performed following the manufacturer’s recommendations (Molecular Probes Inc. Eugene, OR, USA) as previously described [25]. A total of 5 × 10⁴ SP cells and non-SP cells were plated on cytospin slides. The slides were made immediately after cell sorting and fixed for 10 min. in 3.7% formaldehyde at room temperature. The cells were incubated for 1 hr at room temperature with a rabbit anti-ABCG2 polyclonal antibody (1:50) (Santa Cruz Biotechnology, Santa Cruz, CA, USA). Alexa Fluor 488 (green) goat anti-rabbit IgG conjugate antibody was used as secondary antibody (Molecular Probes). The nuclei were stained with 4′-6-diamidino-2-phenylindole (DAPI). The cells were analysed with an Olympus FV500 confocal laser microscope following the adjustment of background signals from the negative control.
Laser scanning cytometry for quantification of BCL2 expression
Laser scanning cytometry (LSC) analysis was performed as previously described [26]. Cytospin slides from SP and non-SP cells were made immediately after cell sorting, fixed in 1% paraformaldehyde for 15 min. at room temperature and then washed with PBS. The slides were incubated with the FITC conjugated anti-BCL2 monoclonal antibody (DAKO). FITC conjugated mouse IgG1 (DAKO) was used as the negative control. The slides were counterstained with PI and FITC and fluorescence was measured. The 488-nm line of the argon laser was used for excitation with a 530-nm bandpass filter. PI fluorescence was excited using the argon 488-nm line and measured by a 625-nm bandpass filter. 800 to 2,000 cells were analysed on each slide.
Flow cytometry immunophenotyping
To reveal the immunophenotypic profile of isolated SP cells and to assess immunophenotypic differences between SP and non-SP cells, both cell populations were immunophenotyped using 16 antibodies that are specific for B-cell antigens, previously described stem-cell markers, or adhesion molecules including CD5, CD19, B220, CD23, CD25, CD34, CD38, CD40, CD79a, CD90 (THY-1), CD117 (c-KIT), CD123 (IL-3Rα), CD133, IgM, IgD and CXCR4 (CD184). The data were acquired on a FACS Vantage (BD) and were analysed using the FlowJo analysis program (TreeStar, San Carlos, CA, USA).
G-banding karyotyping
Sorted DTG SP and non-SP cells were cultured for 24 hrs. Conventional cytogenetic analysis was performed on G-banded metaphase cells using standard techniques. Up to 10 metaphases were analysed from each sample and the results were reported using the International System for Human Cytogenetic Nomenclature.
Telomere length measurements using quantitative fluorescence in situ hybridization (qFISH)
DTG SP and non-SP cell fractions were prepared as described and stained with a Cy-3 labelled T2AG3 PNA probe. qFISH was performed as previously described [27, 28]. Images were dark subtracted and flat fielded prior to quantitative analysis. Depending on the quality of cell spreads, up to 50 interphase nuclei from each sample were analysed. These experiments were done in triplicate.
Cell cycle and cell proliferation assays
Cell cycle analysis was performed with the FITC BrdU Flow Kit (BD). 500,000 DTG SP and non-SP cells were pulse labelled with BrdU for 45 min. following the manufacturer’s protocol. The cells were stored at 4°C until the analysis. Bivariate analysis of the amount of BrdU (FITC) versus the DNA content (PI) was performed with flow cytometry on the FACSCalibur device (BD) as previously described [29]. The proliferation index was calculated using the following formula: proliferation index = (G2M + S) / (G0G1 + S + G2M) to reflect the percentage of proliferating cells. The S-phase cell fraction (SPF) reflected the cell percentage in the S phase and was calculated using the formula SPF = S / (G0G1 + S + G2M).
Serial SP and non-SP cell sorting
To compare in vitro self-renewal capacity, we cultured sorted 8 × 10⁵ SP and non-SP cells separately under the same culture conditions. Both populations were re-stained with Hoechst 33342, serially sorted again at 2, 4, 6 and 8 weeks and the proportion of SP cells was quantified. We also examined and compared cell viability between cultured SP and non-SP cell fractions. For this analysis, after each serial sorting, a total of 5 × 10⁵ SP or non-SP cells were separately cultured under the same culture conditions for up to 3 weeks. Cell viability was analysed by trypan blue exclusion at 1, 2 and 3 weeks after cell sorting.
Methylcellulose clonogenicity assay
Colony formation in methylcellulose (M3434 Stem Cell Technologies, Vancouver, BC, Canada) was performed according to the manufacturer’s instructions. 1000 SP and non-SP sorted cells were initially plated and incubated in 3 ml of methylcellulose for 10 days. After 10 days, wells were stained with p-iodonitrotetrazolium violet and the number of colonies (those larger than 10 cells) was counted using a stereomicroscope. In addition, we compared clonogenic ability between CD34+ and negative SP cells using a methylcellulose colony-forming assay. CD34+ and negative SP cells were sorted from the total SP fraction using double staining with Hoechst 33342 and FITC labelled CD34 antibody. 1000 cells were initially plated and incubated in 300 μL of methylcellulose for 10 days. Colonies were counted, photographed and measured using QCapture Pr Software (QImaging Inc, Surrey, BC, Canada). All these experiments were performed in duplicate.
In vivo tumorigenicity assay
To determine if the SP fraction is enriched with tumour-initiating cells and whether tumorigenicity differs between SP and non-SP cells, in vivo experiments were performed in accord with the institutional guidelines for the use of laboratory animals. After isolation of the SP and non-SP cell fractions, sorted cells were washed twice with PBS and various numbers of cells (1 × 10⁴, 1 × 10³ and 1 × 10²) were resuspended in 0.1 ml of saline, and subsequently injected subcutaneously into non-obese diabetic/severe combined immunodeficiency (NOD/SCID) mice (Jackson Laboratories, Bar Harbor, ME, USA). The mice were maintained in the M.D. Anderson Cancer Center SCID Mouse Core Facility, which consists of a standard barrier vivarium, under sterile pathogen-free conditions suitable for immune-deficient rodents. Subcutaneous tumour growth was monitored every 2 days starting the second week after inoculation. The mice were killed when the subcutaneous tumours reached 1.5 cm in diameter. Tumour tissue and mouse organs were harvested, placed in 10% formalin (Baxter Diagnostics, Issaquah, WA, USA) and embedded in paraffin. Thin histological sections were prepared and stained with haematoxylin and eosin. Unstained sections were also prepared to perform immunohistochemical studies. Fresh tumour tissue was obtained, cell suspensions were generated and lymphoma cells were cultured and re-stained with Hoechst 33342 and reanalysed for SP as described above.
Immunohistochemistry
Immunohistochemical methods were used as previously described [30] to assess protein expression of B220, CD5 and cyclin D1 in formalin fixed, paraffin-embeddded tissue sections. Antimouse monoclonal antibodies to B220, CD5 (BD Pharmingen, Heidelberg, Germany) and cyclin D1 (Santa Cruz Biotechnology) were used.
Immunoglobulin gene rearrangements
Polymerase chain reaction (PCR) methods to assess for immunoglobulin gene rearrangements were performed with DNA extracted from DTG SP, non-SP and total (non-fractionated) DTG cells using the DNeasy Tissue kit (Qiagen, Valencia, CA, USA). The primers used have been previously described [22]. The PCR products were analysed by electrophoresis using 1.2% agarose gels.
Reverse transcriptase-polymerase chain reaction (RT-PCR) and stem cell PCR array
Total RNA from SP, non-SP, total DTG cells and CD34+ and negative SP cells was purified using Trizol, according to the manufacturer’s instructions (Invitrogen, Carlsbad, CA, USA). Expression of c-Myc was determined using RT-PCR as previously described [22]. RT-PCR products were separated on 1% agarose gels and visualized by UV light after incorporation of ethidium bromide. For the stem cell-array, total RNA was isolated using Qiagen RNeasy Mini kit (Qiagen). cDNA was synthesized using RT2 First Strand Kit (C-03) (SA Biosciences, Fredrick, MD, USA) and used to perform a qPCR based assay for a panel of mouse self-renewal genes using RT2 Profiler Stem Cell PCR (PAMM-405) (SA Biosciences) as per manufacturer’s instructions.
Statistical analysis
Clonogenicity capacity was calculated according to the following equation: (colonies per dish/number of SP or non-SP cells per dish) ×100. A two-sample Student’s t test was used where appropriate. P≤ 0.05 was accepted as significant. Statistical calculations were done using StatView (Abacus Concepts, Inc., Berkeley, CA, USA).
Results
DTG cell lines contain a significantly large SP-cell population
We stained two DTG cell lines with Hoechst 33342 dye and identified the SP by its characteristic profile in dual-wave length flow cytometry analysis. Both DTG lymphoma cell lines contained a distinct fraction of SP cells, ranging in different determinations from 0.13% to 6% (median 3.5%). The SP cells markedly diminished or disappeared in the presence of Hoechst 33342 and verapamil, a calcium channel blocker (Fig. 1A). No significant differences in cell size were observed between DTG SP and non-SP cells (average forward scatter of five determinations, SP: 314.3 and non-SP: 340.16; P= 0.3). DTG SP and non-SP cells were sorted separately for further experiments. Using immunofluorescence and confocal microscopy, we assessed for ABCG2 protein expression in the SP and non-SP lymphoma cells. Higher ABCG2 protein levels were detected in SP cells in comparison with non-SP cells (Fig. 1B). These results indicate that the DTG lymphoma cell lines are good models to study the biological and molecular features of the SP cells.
Fig 1.
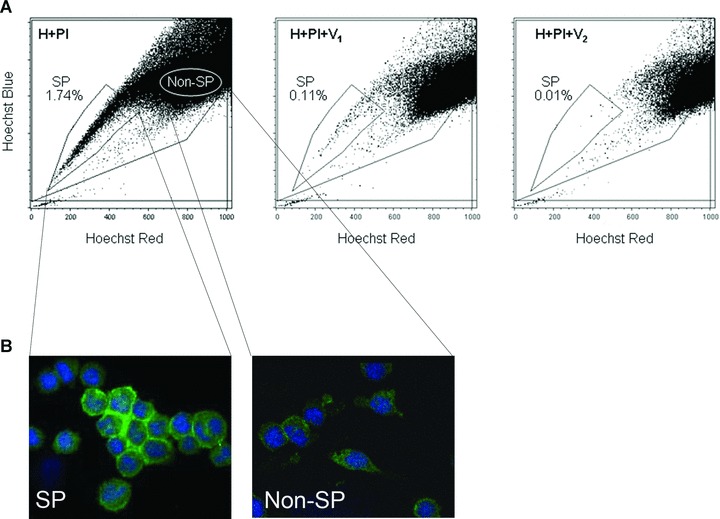
SP cell analysis in DTG cell lines. (A) DTG lymphoma cell lines were enriched with SP cells (in the analysis shown, 1.74% of the total cellularity). The SP proportion was reduced when the cells were incubated with increasing concentrations of verapamil (V1: 50 μg/ml and V2: 100 μg/ml) to block the ATP transporter. The same number of cells was quantified in these experiments. Note that the non-SP gate was shifted to the right and lower side of the non-SP region to ensure that a population defined as ‘upper-SP’ was not included in the sorted non-SP fraction. (B) Higher expression levels of ABCG2 protein, as determined by immunofluorescence, were detected in the SP fraction in comparison with the non-SP. Nuclei were stained with DAPI.
DTG SP cells and non-SP cells are clonal cell populations
IgH gene rearrangement studies performed on DNA obtained from the SP, non-SP and total DTG cell fractions, showed monoclonal gene rearrangements (Fig. S1). The monoclonal bands detected in the three samples had the same size supporting the interpretation that they are clonally related. Expression of c-Myc was also determined in SP and non-SP cells using RT-PCR. High levels of expression of c-Myc were detected in both cell fractions (Fig. S1).
DTG SP cells show higher expression levels of BCL-2 protein than non-SP cells
Using laser scanning microscopy, we quantified the expression levels of BCL-2 in the DTG SP and non-SP cell fractions. Significantly higher levels of BCL-2 protein were detected in the SP in comparison with the non-SP cell fraction (mean 1916837.72 for SP and 1382150.53 for non-SP cells [P < 0.0001]) (Fig. 2A). These results suggest that DTG SP cells may have higher constitutive resistance to apoptosis than non-SP cells.
Fig 2.
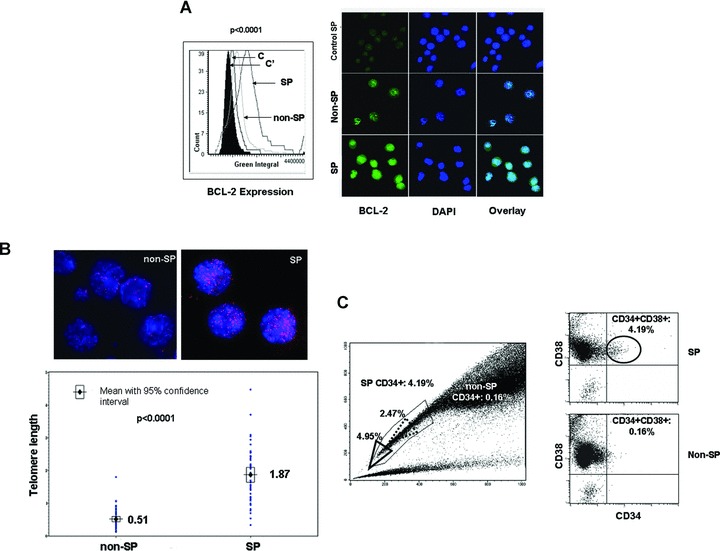
Phenotypic characteristics of DTG SP cells. (A) Laser scanning cytometry revealed higher levels of BCL-2 protein in the SP fraction of DTG cell lines compared to the non-SP fraction (P < 0.0001). IgG controls were used for SP and non-SP cells and indicated as C and C′. The histogram and representative immunofluorescence pictures are shown in the left and right panels, respectively. Nuclei were stained with DAPI. (B) The average telomere length was higher in the SP fraction of DTG lymphoma cell lines than the non-SP fraction. The red dots in the FISH pictures represent the telomeric areas (upper panels). Nuclei were stained with DAPI. Telomere length distribution of up to 50 cells was quantified and the results are shown in the histogram. (C) Most of the DTG SP and non-SP cells were CD38+ but CD34–. A small subset (4.2%) of SP cells was CD34+. The percentage of CD34+ SP cells increased when the gating area was moved close to the tip of the SP region (4.95%) (bold line triangle), and decreased (2.47%) when the gating area was moved far away from the tip of the SP region (dot line triangle). In contrast, only 0.16% of the non-SP cells were CD34+.
DTG SP cells have longer telomere length than non-SP cells
Since telomere length has been associated with cellular lifespan in some stem cells, we evaluated this parameter in DTG SP and non-SP tumour populations. qFISH analysis revealed a significant higher average telomere length in the DTG SP compared with non-SP cell fraction (mean 1.87% for SP and 0.51% for non-SP cells [P < 0.0001]) (Fig. 2B). These results suggest that the SP cells may have longer lifespan than the non-SP cells, and that SP cells may represent a reservoir with longer proliferative potential for generating lymphoma cells.
DTG SP cells demonstrate a higher degree of aneuploidy than in non-SP cells
Chromosomes were G-banded and up to 10 metaphases of DTG SP and non-SP cells were karyotyped. This analysis revealed that SP cells have a higher degree of aneuploidy than their counterpart non-SP cells. The chromosome number in SP cells ranged from 57 to 112 with up to five copies per chromosome. The modal chromosome number was 57. The chromosome number in non-SP cells ranged from 50 to 59, with a modal chromosome number also of 57. No chromosomal translocations were identified. The higher aneuploidy seen in DTG SP cells suggests that this cell fraction, in comparison with the non-SP fraction, has higher genetic instability, higher proliferative potential and asymmetric cell division.
DTG SP cell fraction contains a small population of CD34+ CD38+ cells
To determine immunophenotypic differences between DTG SP and non-SP cells, both cell populations were immunophenotyped using flow cytometry and various antibodies specific for B-cells, stem-cell markers and adhesion molecules. Both SP and non-SP cells expressed CD5, CD19, CD23 (dim), CD38, CD45 and CD184 (CXCR4) (dim) and were negative for CD25, CD40, CD79a, CD90 (Thy1), CD117 (c-Kit), CD123 (IL3Rα), IgM and IgD. A subset (4.2%) of DTG SP cells was positive for CD34 and CD38 (Fig. 2C). In contrast, only 0.16% of the non-SP cells were positive for CD34 and CD38. Interestingly, the percentage of CD34+ SP cells increased when the gating area was moved close to the tip of the SP region (4.95%), which is the area enriched for cells with the highest capacity to exclude Hoechst 33342 (Fig. 2C; bold line triangle). On the contrary, the percentage of CD34+ decreased when the gating area was moved far away from the tip of the SP region (2.47%) (dot line triangle), an area which contains cells with less capacity to exclude the vital dye. A minor population of both SP and non-SP cells was CD34– and CD38–.
To gain additional insights into the nature of the SP cell fraction positive for CD34 we analysed the expression of 84 genes known to be involved in self-renewal and differentiation using a RT2 Profiler Stem Cell PCR (SA Biosciences) comparing first SP with non-SP cells, and subsequently SP cells positive for CD34 with SP cells negative for CD34. In addition, we compared the clonogenic ability of CD34+ and CD34− SP cells using a methylcellulose colony-forming assay. Averaging the results from two independent experiments, 14 self-renewal genes (17% of all genes assessed) differed in their expression levels between SP and non-SP cells establishing a distinctive self-renewal signature for the SP population. Genes expressed at different levels included IGF1 (up-regulated 16 fold), CXCL12 (up-regulated 10 fold), JAG1 (up-regulated 4.4 fold), S100b (up-regulated up to 4.2 fold) and NOTCH2 (up-regulated 2.5 fold). A distinctive self-renewal signature was not found in CD34+ SP-cells when compared with CD34– SP cells. However, the colony assays showed that CD34– SP cells exhibited higher clonogenicity and formed relatively larger colonies than CD34+ cells (mean 174.6 μm for CD34+ and 267.1 μm for CD34–; [P= 0.002]) (Fig. S3).
DTG SP cells can generate both SP and non-SP cells and have longer life span in vitro than non-SP cells
To examine whether DTG SP cells can generate both SP and non-SP cells, SP and non-SP cells were cultured in vitro, restained with Hoechst 33342, reanalysed by flow cytometry and serially sorted at 2, 4 and 8 weeks. In each continuous sort, SP cells were able to repopulate both SP and non-SP cells, with an increased ratio of SP cells to non-SP cells (up to 13.53% SP cells at 8 weeks) (Fig. 3A). However, each successive sort of non-SP cells demonstrated predominantly non-SP cells with a progressively decreased ratio of SP cells to non-SP cells (0.73% SP cells at 8 weeks) (Fig. 3A). These findings suggest that the DTG non-SP cell fraction is less effective in regenerating SP cells than the SP cell fraction. In addition, it is possible that few SP cells ‘contaminate’ the non-SP fraction in each sorting; this may explain the decreased ratio of SP cells to non-SP cells seen in each successive sort of non-SP cells.
Fig 3.
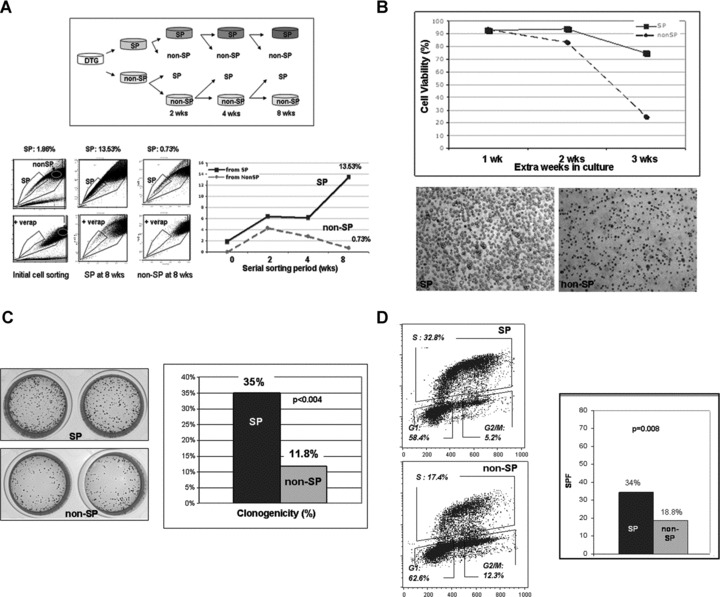
Self renewal, clonogenic ability and cell cycle properties of DTG SP cells. (A) To compare in vitro self-renewal capacity, sorted DTG SP and non-SP cells were cultured separately. Both subpopulations were re-stained with Hoechst 33342, and serially sorted again at 2, 4, 6 and 8 weeks and the proportion of SP cells quantified at the times as shown in the schematic diagram (upper panel). In each sorting, DTG SP cells were able to repopulate both SP and non-SP cells with an increased ratio of SP to non-SP (up to 13.53% SP cells at 8 weeks). Each successive sort of non-SP cells demonstrated predominantly non-SP cells with a progressively decreased ratio of SP to non-SP (0.73% SP cells at 8 weeks). (B) To compare cell viability between the DTG SP and non-SP fractions in culture, SP and non-SP cells were separately cultured under the same culture conditions up to three extra weeks after each serial sorting at 2, 4, 6 and 8 weeks. Cell viability was analysed by tryphan blue exclusion in duplicate at 1, 2 and 3 weeks. Cell viability data of the DTG SP and non-SP fractions sorted at 4 weeks and maintained in culture up to 3 extra weeks is shown. At the end of the 3rd week, SP cells show a viability of 75% whereas the non-SP cells show a viability of 25%. Representative pictures of the DTG SP and non-SP cultures at the end of the 3rd week in culture are shown in the lower panel. Similar results were obtained with the SP and non-SP cells sorted at 2, 6 and 8 weeks. (C) Differences in clonogenic ability between DTG SP and non-SP cells was assessed using an in vitro methylcellulose colony-forming assay. A total of 1 × 10³ sorted SP and non SP-cells were cultured in methylcellulose for 10 days. The DTG SP cell fraction was more clonogenic than the non-SP fraction, 35% for SP cells and 11.8% for non-SP cells, [P < 0.004]. SP cells formed more colonies than the non-SP cells at 10 days. The methylcellulose cultures stained with p-iodonitrotetrazolium violet are shown (left panel). (D) Sorted DTG SP and non-SP cells as well as non-sorted DTG cells were pulse labelled with BrdU for 45 min. The percentage of cells in each cell cycle phase is shown in the right panels. DTG SP cells had a higher S phase fraction than the non SP-cells; average of two determinations: 34% in the SP and 18.8% in the non-SP cells (P= 0.008).
In addition, we examined differences in cell viability between serially-sorted DTG SP and non-SP cells. To examine cell viability differences, equal numbers of SP and non-SP cells were cultured up to three extra weeks after each serial cell sorting at 2, 4 and 8 weeks. Cell viability was analysed by trypan blue exclusion at 1, 2 and 3 weeks after each sorting. In all these experiments, the non-SP cell fraction demonstrated a progressive and substantial decrease in cell viability over time, in comparison with the SP fraction (Fig. 3B).
To determine if the differences seen in cell viability were, at least in part, due to Hoechst 33342 toxicity, we stained 10 × 106 DTG cells with Hoechst 33342 at a final concentration of 5 μg/ml (37°C for 1.5 hrs), performed the SP analysis procedure but without cell sorting (mock analysis), and cultured the cells for 10 days. As a control, the same number of DTG cells were incubated with 5 μg/ml of sterile PBS, SP analysis was performed (without sorting) and cells were cultured for 10 days. Initially, a decrease in the cell numbers is seen in both samples (Fig. S2). Although an initial larger decrease in the total number of viable cells was seen in the sample exposed to Hoechst 33342 compared with control, a significant recovery in cell growth was seen in both samples after day 5 and no differences in cell numbers were seen at day 8 (Fig. S1). These results indicate that although Hoechst 33342 is toxic, the cells fully recover from the effects of the dye and from SP analysis after 7 days in culture. Therefore, Hoechst 33342 toxicity cannot explain the differences in cell viability observed between DTG SP and non-SP cells when cultured for more than 1 week.
DTG SP cells have more clonogenic ability than non-SP cells
To investigate differences in clonogenicity ability between DTG SP and non-SP cells, we assessed colony formation ability using an in vitro methylcellulose colony-forming assay. A total of 1 × 10³ sorted DTG SP and non SP-cells were cultured in methylcellulose for 10 days. DTG SP cells formed a greater number of colonies than the non-SP cells (35% for SP cells and 11.8% for non-SP cells, [P < 0.004]) at 10 days in culture (Fig. 3C) indicating that the SP cell fraction is more clonogenic than non-SP.
DTG SP cells are enriched with cells in S phase of the cell cycle
To reveal cell cycle differences between DTG SP versus non SP cells, sorted DTG SP and non-SP cells as well as non-sorted DTG cells were pulse-labelled with BrdU for 45 min. A total of 5 × 10⁵ SP and non-SP cells were analysed at days 1 and 3 after cell sorting. These experiments revealed similar results, showing that SP cells had a higher S phase fraction (SPF) than the non SP cells (average of two determinations: 34% in the SP and 18.8% in the non-SP cells; P= 0.008) (Fig. 3D). No differences in the distribution of cells in various phases of the cell cycle were seen between non-SP cells and the non-sorted DTG cells.
DTG SP cells are more tumorigenic than the non-SP cells
We explored the in vivo tumorigenic ability of DTG SP and non-SP cells using 1 × 10⁴, 1 × 10³ or 1 × 10² viable DTG SP and non-SP cells sorted separately and subcutaneously injected into NOD/SCID mice. Initially, we injected 1 × 10⁴ viable cells, five mice with SP and five with non-SP cells. All five mice injected with SP cells developed subcutaneous tumours at least 1.5 cm in size at 3 weeks (Table 1 and Fig. 4A). Only one mouse injected with 1 × 10⁴ non-SP cells developed a 1.5 cm subcutaneous tumour at 3 weeks. Two additional mice developed ∼1.5 cm subcutaneous tumours, at 4 weeks. The other two mice injected with non-SP cells never developed tumours (3 months of follow-up). Subsequently, 1 × 10³ and 1 × 10² DTG SP and non-SP cells were subcutaneously injected into NOD/SCID mice (Table 1), three with SP and three with non-SP cells. All mice injected with 1 × 10³ SP cells developed palpable subcutaneous tumours within the 3 weeks (Fig. 4C). Two of three mice injected with 1 × 10³ non-SP cells also developed palpable tumours; however, tumour latency was longer, 4 weeks. Mice injected with 1 × 10² SP cells developed palpable tumours in 4 weeks. By contrast, all three mice injected with 1 × 10² non-SP cells did not develop subcutaneous tumours at 6 weeks after the injection. No peripheral blood involvement was detected in mice injected with 1 × 10² non-SP cells and necropsies confirmed the absence of systemic lymphoma (Fig. 4D).
Table 1.
DTG SP cells are more tumorigenic and induce more lymphoma dissemination than the non-SP cells
| Number of cells | Tumour incidence | Tumour latency | PB involvement | Liver involvement | Spleen involvement | BM involvement | |
|---|---|---|---|---|---|---|---|
| SP | 10,000 | 5/5 | 2 wks | ND | 5/5 | 3/5 | 5/5 |
| Non-SP | 10,000 | 3/5* | 2–3 wks | ND | 2/3 | 2/3 | 0/3 |
| SP | 1,000 | 3/3 | 3 wks | 3/3 | 3/3 | 3/3 | 1/3 |
| Non-SP | 1,000 | 2/3 | 4 wks | 3/3 | 2/3 | 2/3 | 0/3 |
| SP | 100 | 3/3 | 4 wks | 3/3 | 3/3 | 2/3 | 1/3 |
| Non-SP | 100 | 0/3+ | 0/3 | 0/3 | 0/3 | 0/3 |
Abbreviations: PB, peripheral blood, BM, bone marrow; wks, weeks; ND, not determined.
Latency refers to the time from tumour cell injection to the appearance of a palpable tumour.
Two mice injected with 10,000 non-SP cells did not develop subcutaneous tumours (follow-up 12 weeks).
No tumours were found in the autopsy. +Three mice injected with 100 non-SP cells did not develop subcutaneous tumours (follow-up 6 weeks). No tumours were found in the autopsy and no peripheral blood involvement was found by morphology and flow cytometry immunophenotyping.
Fig 4.
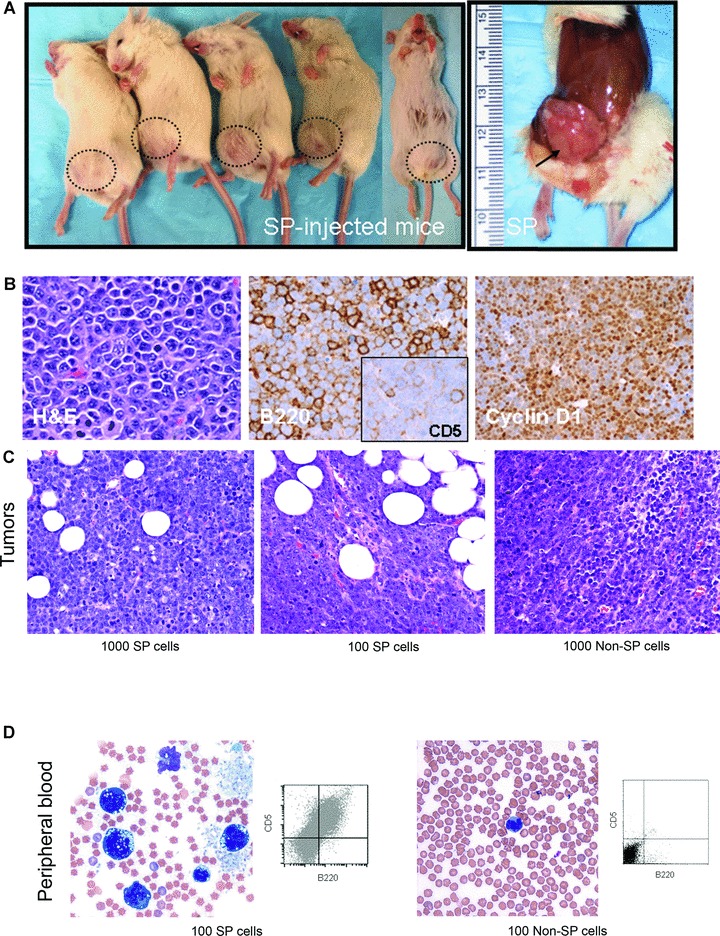
In vivo Tumorigenicity of DTG SP cells as compared with non-SP cells. (A) DTG SP cells were more tumorigenic than non-SP cells. All five mice inoculated with 1 × 10⁴ SP cells formed subcutaneous tumours reaching 1.5 cm at 3 weeks. (B) The DTG SP-derived lymphomas reproduced the morphologic and immunophenotypic characteristics of the primary tumours including the blastoid appearance and positivity for B220, CD5 and cyclin D1. (C) Subcutaneous tumours were also found in mice inoculated with 1 × 10³ and 1 × 10² SP cells and with 1 × 10³ non-SP cells but not in those injected with 1 × 10² non-SP. (D) Peripheral blood (PB) involvement was detected in mice injected with 1 × 10² SP cells but not in those injected with the same number of non-SP by morphology and by flow cytometry immunophenotyping. PB of mice injected with 1 × 10² non-SP cells showed few mature appearing monocytes and occasional granulocytes.
Morphological evaluation of the DTG SP derived and non-SP derived lymphomas showed that both reproduced the blastoid histological appearance and the immunophenotypic characteristics of the primary lymphomas, being positive for B220, CD5 and cyclin D1 (Fig. 4B) [22]. However, some differences between DTG SP and non-SP lymphomas were noted. Clusters of neoplastic cells were seen in several organs including, liver (intrasinusoidal and portal spaces), pancreas (perivascular), spleen (red pulp) and bone marrow in mice injected with the SP fraction (Fig. 5). By contrast, there was much less systemic dissemination in mice injected with non-SP cells. For example, although liver involvement was observed in some mice injected with non-SP cells involvement was usually minimal in the form of scattered single cells within sinusoids unlike the large cell clusters and/or portal involvement observed in mice injected with SP cells. Another histological difference was that non-SP derived lymphomas demonstrated more extensive tumour necrosis (estimated ∼30–40%) compared with SP-derived lymphomas (∼5%) (Fig. 5). SP re-analysis of lymphoma cell suspensions obtained from the DTG SP- and non-SP-derived tumours showed that the SP-derived tumours contained more than two-fold higher number of SP cells than non-SP-derived tumours.
Fig 5.
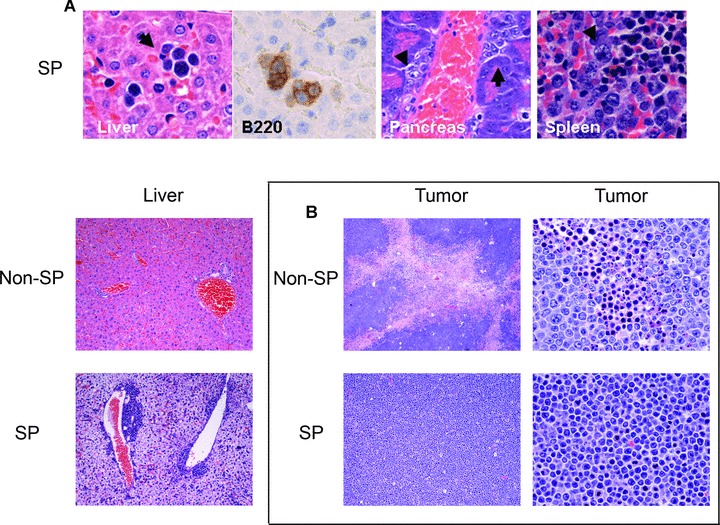
In vivo systemic dissemination of DTG SP cells. (A) Mice injected with DTG SP cells showed lymphoma systemic dissemination with numerous clusters of lymphoma cells (arrows) in the liver (intrasinusoidal), pancreas (perivascular) and spleen (red pulp) (upper panels). These lymphoma clusters were highlighted by the B220 immunostain. Clusters of lymphoma cells were also seen in the portal areas in the livers of mice injected with SP cells but not in those injected with non-SP cells. Rare single tumour cells inside of the sinusoids were seen in two mice injected with 1 × 10⁴ non-SP and with 1 × 10³ non-SP cells. (B) The non-SP derived lymphomas (middle and right upper panels) showed extensive areas of coagulation necrosis and apoptosis that were much less evident in the SP-derived tumours (middle and right lower panels) (haematoxylin and eosin, ×40 and ×400).
These data suggest that the DTG SP fraction is more tumorigenic resulting in a greater tumour burden than the non-SP fraction in mice. The presence of extensive tumour necrosis in mouse tumours derived from non-SP cells suggests that the non-SP fraction is incapable of sustaining tumour growth for a prolonged period of time. In aggregate, these results suggest that the DTG SP population contains a subset of cells more capable of tumour maintenance and systemic dissemination.
Discussion
Since its initial application in the analysis of bone marrow haematopoietic stem-cells, the SP technique has been adapted to identify putative stem-cells in multiple tissues [31–35]. It also has been used recently to isolate and characterize ‘tumour-initiating cells’ from several types of cultured cancer cell lines [5, 6, 12–15]. In this work, using a recently described IL-14α× c-Myc DTG/MCL-BV murine model, that closely simulates human MCL [22], we found that DTG lymphoma cell lines have a surprisingly large SP fraction (up to 6%). The explanation for why DTG cell lines have a higher SP percentage than other lymphoma cell lines that we have examined is not clear to us at this time (Fig. S3). However, we think that, at least in part, the higher SP percentage may be related to the fact that these DTG lymphomas are highly aggressive and rapidly fatal and that the DTG cell lines also have a very high proliferation rate with a duplication time of 16–18 hrs. Because of their high percentage of SP cells, we used DTG cell lines to characterize the biological and molecular features of the SP cells and to address whether these cells have features of ‘tumour-initiating cells’.
Here, we present evidence that the DTG SP fraction, in comparison with the non-SP fraction, possesses cells with several intrinsic properties of ‘tumour-initiating cells’, such as higher expression of BCL-2, higher self-renewal ability, longer telomeres, expression of the stem cell marker CD34 in a small subset of the SP cells, and a higher clonogenic and tumorigenic ability in vitro and in vivo.
Our data suggest that DTG SP cells have higher constitutive resistance to apoptosis than non-SP cells. Consistent with previous studies that show that ABCG2 (BCRP) is one of the molecular determinants of the SP phenotype [4], we found higher expression of ABCG2 protein in SP than non-SP cells. ABCG2 was initially identified in drug-selected MCF7 breast cancer cells and later found to efflux multiple chemotherapy drugs [36]. The strongest evidence linking ABCG2 and the SP phenotype comes from the nearly complete loss of the bone marrow SP phenotype in abcg−/– mice [36]. We also found higher baseline levels of BCL-2 expression in DTG SP cells than in non-SP cells. Xu et al.[37] compared the mRNA expression level of BCL-2 by quantitative real-time PCR between SP and non-SP fractions in MCF7 breast cancer cells, and consistent with our data, found that BCL-2 mRNA expression levels were 2.5-fold higher in SP than in non-SP cells [37].
DTG SP lymphoma cells also have a significantly higher average telomere length and higher chromosomal aneuploidy than non-SP cells. Telomere shortening is one of the factors that limits cell proliferation [38]. It has been shown that telomerase activity appears to correlate with self-renewal capacity and is reduced as haematopoietic stem cells differentiate to multipotent progenitors [39]. Our data are consistent with other studies that found higher expression of human telomerase reverse transcriptase in SP in comparison with non-SP fractions [6, 40]. The presence of significantly longer telomeres in SP cells, in comparison with non-SP cell chromosomes, suggests that the SP fraction may represent a cell reservoir with endless repopulation potential, continuously generating cancer cells and driving disease progression. We found a higher S-phase fraction in DTG SP compared to non-SP cells. The increased percentage of SP cells in S-phase may relate to longer telomere maintenance since the highest level of telomerase activity has been detected in S-phase cells of several human cancer cell lines [41].
If the SP cells represent a reservoir for the immortalized growth fraction of DTG lymphoma cells it would not be surprising to discover that this cell population exhibits higher chromosomal aneuploidy than the rest of the tumour cells. Using G banding techniques and conventional karyotyping, we found that the DTG SP fraction, does indeed contain cells with more chromosomal aneuplody that the non-SP fraction. These data support the interpretation that at least a subset of the DTG SP cells has more genomic instability than non-SP cells, and may be the result of a longer lifespan in this cellular fraction in comparison with the rest of the lymphoma cells. In addition, the higher degree of aneuploidy seen in a subset of the SP cells in comparison with the non-SP fraction suggests that the SP cells divide asymmetrically and this can be a source of clonal evolution.
Our data also indicate that DTG SP cells have longer replicative potential and a longer lifespan than the non-SP cells, and that they self-renew, generating both SP and non-SP cells in vitro and in vivo. DTG non-SP cells revealed a substantial decrease in the ratio of SP to non-SP cells after serial cell sorting and in their lifespan over time in culture. Self-renewal and differentiation are hallmark properties of stem-cells in general and, by analogy, of ‘tumour-initiating cells’. These properties allow ‘tumour-initiating cells’ to generate additional ‘tumour-initiating cells’ and diverse cancer cells with limited proliferative potential. Previous studies, in other cellular systems, have shown that SP cells can generate SP and non-SP cells in vivo and in vitro[12–15, 42, 43].
It has been claimed that some of these observed differences are attributable to Hoechst 33342 toxicity [44]. In our tumour cell model these differences did not appear to reflect toxic effects of the Hoechst dye. Specifically, cell viability of SP and non-SP fractions was similar before each serial sorting (higher than 90%). Also, to further assess the toxicity of Hoechst 33342 in DTG lymphoma cells, the cells were incubated with and without Hoechst 33342 for 1.5 hrs, submitted to the mock manipulations of the SP assay, and cultured without sorting for 10 days. In the first few days after the SP procedure, DTG lymphoma cells incubated with Hoechst 33342 showed a higher decrease in the total cell number in comparison with the control. However, they started to recover after the fifth day and they fully recovered by the seventh day of culture. No differences in the total cell number between DTG lymphoma cells incubated with or without Hoechst 33342 were seen by day 7 in culture.
Previous studies have shown that the SP cell fraction contains a heterogeneous cell population [45–47], and this is supported by our data. We also found that there is a small subset of DTG SP cells with a more primitive progenitor phenotype, expressing both CD34 and CD38, among cells that are CD34–CD38+[48]. Interestingly, the proportion of CD34+/CD38+ SP cells was higher in the tip of the SP region, which is the area enriched with cells with the highest capacity to exclude Hoechst 33342 dye, suggesting that the most primitive cells are those with highly functional ATP binding cassettes. Consistent with this interpretation, using array microarray methods, we found that CD34 mRNA expression levels were 10.9-fold higher in DTG SP than in non-SP cells (data not shown). Although, we found differences in the expression of genes involved in self-renewal and differentiation between SP and non-SP cells, a distinctive self-renewal signature was not found in CD34+ SP cells when compared with CD34– SP cells.
If all the cells in the SP fraction represent ‘tumour-initiating cells’, then it would be expected that they might proliferate more slowly than non-SP cells. However, others have shown [5, 12, 13, 43, 49], in agreement with our data, that the SP fraction has higher clonogenity capacity, higher proliferation rate in vitro, and when injected in mice also forms tumours more quickly than the non-SP fraction. It is plausible that only a small subset of the SP fraction represents true ‘tumour-initiating cells’, and that these cells divide asymmetrically to produce progenitor-like cells or so-called transient amplifying cells, that might be the rapidly cycling cell subset. This hypothesis, if confirmed, would explain the high cell proliferation rate and the fast tumour growth of the SP fraction and the higher proliferation rate of the CD34– CD38+ SP fraction (putative progenitor-like cells and predominant subset of the SP fraction) in comparison to the CD34+ SP fraction.
Several additional differences were also noted between SP and non-SP derived lymphomas. Non-SP derived lymphomas demonstrated more extensive areas of tumour necrosis and apoptosis compared with SP-derived lymphomas. Extensive lymphoma dissemination was generally seen in mice injected with SP cells, and to a lesser degree in those injected with non-SP cells. It was particularly interesting that we found small clusters of lymphoma cells in a perivascular distribution in several organs in mice injected with SP cells but not in those injected with non-SP. Normal stem-cells reside in tissue-specific niches that anchor them to the appropriate tissue microenvironment for regulation of fundamental stem-cell properties. There is an intriguing association of normal stem-cells or progenitor cells with the vascular niche with data supporting the role of the vascular niche in initiating cancer metastasis [50–53]. Our present study also suggests the importance of the vascular niche in lymphoma dissemination, by demonstrating a perivascular distribution of disseminated lymphoma cells in mice injected with SP cells. However, we cannot exclude the possibility that perivascular distribution of lymphoma cells that we have observed represents an early stage of lymphoma dissemination.
This study has prompted us to screen for SP-cells in human lymphoma cell lines. Our results reveal that some of the most widely used human lymphoma cell lines contain a small, but distinct SP fraction, ranging from 0.01 to 0.32% (Fig. S4). These percentages are similar to the reported SP percentages in non-neoplastic stem-cells or progenitor cells as well as in most cancer cell lines reported up to date [3, 5, 12–15]. However, in these cell lines the isolation of an adequate number of SP cells for further experiments is difficult and not always possible.
In conclusion, our data suggest that the DTG SP fraction contains a cell population with some of the features attributable to so called ‘tumour-initiating cells’, and that they may represent the cell reservoir responsible for lymphoma maintenance and dissemination. Methods to enrich for SP cells in human lymphoma cell lines need to be developed to further study this cell fraction in human lymphomas.
Acknowledgments
This study was supported by NIH grant CA133963 (RJF).
Supporting Information
Fig. S1 (Left) PCR methods to assess for IgH generearrangements performed on DNA obtained from the SP, non-SP andtotal DTG cell fractions reveal a monoclonal IgH gene rearrangement. The monoclonal bands detected in the three samples are of similar size supporting the interpretation that they are clonally related. (Right). High levels of expression of c-Myc were confirmed in both cell fractions by RT-PCR.
Fig. S2 Hoechst 33342 toxicity study in DTG cells. Thesame number of DTG were incubated with Hoechst 33342 in a finalconcentration of 5 μg/ml (37°C for 1.5 hrs) and with 5μg/ml of sterile PBS (37°C for 1.5 hrs) as a control. SPprocedure was performed, but without sorting, and after the cellswere cultured for 10 days. An initial decrease of cell number wasobserved in both Hoechst incubated and control. However, asustained increase in the total cell number was seen in bothsamples starting the fifth day and no differences in total cellnumbers were seen after day 7.
Fig. S3 CD34– SP cells form largercolonies (A) and exhibited higher clonogenicity (B)than CD34+ cells. (A) Representativepictures of the cell colonies for CD34+ andnegative SP cells are shown. The pictures were taken at the samemagnification. (B) The CD34+ SP cellfraction was less clonogenic than the CD34– SPcell fraction, 11% for CD34+ SPcells and 36% for CD34– SP-cells. TheCD34+ cell fraction represented up to 5% of the total SP population.
Fig. S4 SP cell analysis in human lymphoma cell lines. Eleven out of 12 human lymphoma cell lines demonstrated a rare, but distinct SP population ranging between 0.01% and 0.32%. L428, a Hodgkin cell line, did not contain a detectable SP cell fraction. The highest percentage is shown in the figure. The results of three determinations and the standard deviation (S.D.) are shown in the table.
Please note: Wiley-Blackwell are not responsible for the content or functionality of any supporting materials supplied by the authors. Any queries (other than missing material) should be directed to the corresponding author for the article.
References
- 1.Wang JC, Dick JE. Cancer stem cells: lessons from leukemia. Trends Cell Biol. 2005;15:494–501. doi: 10.1016/j.tcb.2005.07.004. [DOI] [PubMed] [Google Scholar]
- 2.Clarke MF, Dick JE, Dirks PB, et al. Cancer stem cells–perspectives on current status and future directions: AACR Workshop on cancer stem cells. Cancer Res. 2006;66:9339–44. doi: 10.1158/0008-5472.CAN-06-3126. [DOI] [PubMed] [Google Scholar]
- 3.Goodell MA, Brose K, Paradis G, et al. Isolation and functional properties of murine hematopoietic stem cells that are replicating in vivo. J Exp Med. 1996;183:1797–806. doi: 10.1084/jem.183.4.1797. [DOI] [PMC free article] [PubMed] [Google Scholar]
- 4.Zhou S, Schuetz JD, Bunting KD, et al. The ABC transporter Bcrp1/ABCG2 is expressed in a wide variety of stem cells and is a molecular determinant of the side-population phenotype. Nat Med. 2001;7:1028–34. doi: 10.1038/nm0901-1028. [DOI] [PubMed] [Google Scholar]
- 5.Wang J, Guo LP, Chen LZ, et al. Identification of cancer stem cell-like side population cells in human nasopharyngeal carcinoma cell line. Cancer Res. 2007;67:3716–24. doi: 10.1158/0008-5472.CAN-06-4343. [DOI] [PubMed] [Google Scholar]
- 6.Ho MM, Ng AV, Lam S, et al. Side population in human lung cancer cell lines and tumors is enriched with stem-like cancer cells. Cancer Res. 2007;67:4827–33. doi: 10.1158/0008-5472.CAN-06-3557. [DOI] [PubMed] [Google Scholar]
- 7.Bonnet D, Dick JE. Human acute myeloid leukemia is organized as a hierarchy that originates from a primitive hematopoietic cell. Nat Med. 1997;3:730–7. doi: 10.1038/nm0797-730. [DOI] [PubMed] [Google Scholar]
- 8.Collins AT, Berry PA, Hyde C, et al. Prospective identification of tumorigenic prostate cancer stem cells. Cancer Res. 2005;65:10946–51. doi: 10.1158/0008-5472.CAN-05-2018. [DOI] [PubMed] [Google Scholar]
- 9.Li C, Heidt DG, Dalerba P, et al. Identification of pancreatic cancer stem cells. Cancer Res. 2007;67:1030–7. doi: 10.1158/0008-5472.CAN-06-2030. [DOI] [PubMed] [Google Scholar]
- 10.O’Brien CA, Pollett A, Gallinger S, et al. A human colon cancer cell capable of initiating tumour growth in immunodeficient mice. Nature. 2007;445:106–10. doi: 10.1038/nature05372. [DOI] [PubMed] [Google Scholar]
- 11.Ricci-Vitiani L, Lombardi DG, Pilozzi E, et al. Identification and expansion of human colon-cancer-initiating cells. Nature. 2007;445:111–5. doi: 10.1038/nature05384. [DOI] [PubMed] [Google Scholar]
- 12.Mitsutake N, Iwao A, Nagai K, et al. Characterization of side population in thyroid cancer cell lines: cancer stem-like cells are enriched partly but not exclusively. Endocrinology. 2007;148:1797–803. doi: 10.1210/en.2006-1553. [DOI] [PubMed] [Google Scholar]
- 13.Chiba T, Kita K, Zheng YW, et al. Side population purified from hepatocellular carcinoma cells harbors cancer stem cell-like properties. Hepatology. 2006;44:240–51. doi: 10.1002/hep.21227. [DOI] [PubMed] [Google Scholar]
- 14.Haraguchi N, Utsunomiya T, Inoue H, et al. Characterization of a side population of cancer cells from human gastrointestinal system. Stem Cells. 2006;24:506–13. doi: 10.1634/stemcells.2005-0282. [DOI] [PubMed] [Google Scholar]
- 15.Kondo T, Setoguchi T, Taga T. Persistence of a small subpopulation of cancer stem-like cells in the C6 glioma cell line. Proc Natl Acad Sci USA. 2004;101:781–6. doi: 10.1073/pnas.0307618100. [DOI] [PMC free article] [PubMed] [Google Scholar]
- 16.Larderet G, Fortunel NO, Vaigot P, et al. Human side population keratinocytes exhibit long-term proliferative potential and a specific gene expression profile and can form a pluristratified epidermis. Stem Cells. 2006;24:965–74. doi: 10.1634/stemcells.2005-0196. [DOI] [PubMed] [Google Scholar]
- 17.Al-Hajj M, Wicha MS, Benito-Hernandez A, et al. Prospective identification of tumorigenic breast cancer cells. Proc Natl Acad Sci USA. 2003;100:3983–8. doi: 10.1073/pnas.0530291100. [DOI] [PMC free article] [PubMed] [Google Scholar]
- 18.Singh SK, Hawkins C, Clarke ID, et al. Identification of human brain tumour initiating cells. Nature. 2004;432:396–401. doi: 10.1038/nature03128. [DOI] [PubMed] [Google Scholar]
- 19.Roulland S, Navarro JM, Grenot P, et al. Follicular lymphoma-like B cells in healthy individuals: a novel intermediate step in early lymphomagenesis. J Exp Med. 2006;203:2425–31. doi: 10.1084/jem.20061292. [DOI] [PMC free article] [PubMed] [Google Scholar]
- 20.Fisher SG, Fisher RI. The epidemiology of non-Hodgkin’s lymphoma. Oncogene. 2004;23:6524–34. doi: 10.1038/sj.onc.1207843. [DOI] [PubMed] [Google Scholar]
- 21.Jemal A, Thomas A, Murray T, et al. Cancer statistics, 2002. CA Cancer J Clin. 2002;52:23–47. doi: 10.3322/canjclin.52.1.23. [DOI] [PubMed] [Google Scholar]
- 22.Ford RJ, Shen L, Lin-Lee YC, et al. Development of a murine model for blastoid variant mantle-cell lymphoma. Blood. 2007;109:4899–906. doi: 10.1182/blood-2006-08-038497. [DOI] [PMC free article] [PubMed] [Google Scholar]
- 23.Shen L, Zhang C, Wang T, et al. Development of autoimmunity in IL-14alpha-transgenic mice. J Immunol. 2006;177:5676–86. doi: 10.4049/jimmunol.177.8.5676. [DOI] [PubMed] [Google Scholar]
- 24.Platet N, Mayol JF, Berger F, et al. Fluctuation of the SP/non-SP phenotype in the C6 glioma cell line. FEBS Lett. 2007;581:1435–40. doi: 10.1016/j.febslet.2007.02.071. [DOI] [PubMed] [Google Scholar]
- 25.Cho-Vega JH, Vega F, Schwartz MR, et al. Expression of dicarbonyl/L-xylulose reductase (DCXR) in human skin and melanocytic lesions: morphological studies supporting cell adhesion function of DCXR. J Cutan Pathol. 2007;34:535–42. doi: 10.1111/j.1600-0560.2006.00661.x. [DOI] [PubMed] [Google Scholar]
- 26.Darzynkiewicz Z, Bedner E, Li X, et al. Laser-scanning cytometry: A new instrumentation with many applications. Exp Cell Res. 1999;249:1–12. doi: 10.1006/excr.1999.4477. [DOI] [PubMed] [Google Scholar]
- 27.Baerlocher GM, Lansdorp PM. Telomere length measurements using fluorescence in situ hybridization and flow cytometry. Methods Cell Biol. 2004;75:719–50. doi: 10.1016/s0091-679x(04)75031-1. [DOI] [PubMed] [Google Scholar]
- 28.Laud PR, Multani AS, Bailey SM, et al. Elevated telomere-telomere recombination in WRN-deficient, telomere dysfunctional cells promotes escape from senescence and engagement of the ALT pathway. Genes Dev. 2005;19:2560–70. doi: 10.1101/gad.1321305. [DOI] [PMC free article] [PubMed] [Google Scholar]
- 29.Holm M, Thomsen M, Hoyer M, et al. Optimization of a flow cytometric method for the simultaneous measurement of cell surface antigen, DNA content, and in vitro BrdUrd incorporation into normal and malignant hematopoietic cells. Cytometry. 1998;32:28–36. doi: 10.1002/(sici)1097-0320(19980501)32:1<28::aid-cyto4>3.0.co;2-b. [DOI] [PubMed] [Google Scholar]
- 30.Vega F, Medeiros LJ, Leventaki V, et al. Activation of mammalian target of rapamycin signaling pathway contributes to tumor cell survival in anaplastic lymphoma kinase-positive anaplastic large cell lymphoma. Cancer Res. 2006;66:6589–97. doi: 10.1158/0008-5472.CAN-05-3018. [DOI] [PMC free article] [PubMed] [Google Scholar]
- 31.Storms RW, Goodell MA, Fisher A, et al. Hoechst dye efflux reveals a novel CD7(+)CD34(–) lymphoid progenitor in human umbilical cord blood. Blood. 2000;96:2125–33. [PubMed] [Google Scholar]
- 32.Welm BE, Tepera SB, Venezia T, et al. Sca-1(pos) cells in the mouse mammary gland represent an enriched progenitor cell population. Dev Biol. 2002;245:42–56. doi: 10.1006/dbio.2002.0625. [DOI] [PubMed] [Google Scholar]
- 33.Summer R, Kotton DN, Sun X, et al. Side population cells and Bcrp1 expression in lung. Am J Physiol Lung Cell Mol Physiol. 2003;285:L97–104. doi: 10.1152/ajplung.00009.2003. [DOI] [PubMed] [Google Scholar]
- 34.Terunuma A, Jackson KL, Kapoor V, et al. Side population keratinocytes resembling bone marrow side population stem cells are distinct from label-retaining keratinocyte stem cells. J Invest Dermatol. 2003;121:1095–103. doi: 10.1046/j.1523-1747.2003.12531.x. [DOI] [PubMed] [Google Scholar]
- 35.Bhatt RI, Brown MD, Hart CA, et al. Novel method for the isolation and characterisation of the putative prostatic stem cell. Cytometry A. 2003;54:89–99. doi: 10.1002/cyto.a.10058. [DOI] [PubMed] [Google Scholar]
- 36.Zhou S, Morris JJ, Barnes Y, et al. Bcrp1 gene expression is required for normal numbers of side population stem cells in mice, and confers relative protection to mitoxantrone in hematopoietic cells in vivo. Proc Natl Acad Sci USA. 2002;99:12339–44. doi: 10.1073/pnas.192276999. [DOI] [PMC free article] [PubMed] [Google Scholar]
- 37.Xu JX, Morii E, Liu Y, et al. High tolerance to apoptotic stimuli induced by serum depletion and ceramide in side-population cells: high expression of CD55 as a novel character for side-population. Exp Cell Res. 2007;313:1877–85. doi: 10.1016/j.yexcr.2007.03.006. [DOI] [PubMed] [Google Scholar]
- 38.Bodnar AG, Ouellette M, Frolkis M, et al. Extension of life-span by introduction of telomerase into normal human cells. Science. 1998;279:349–52. doi: 10.1126/science.279.5349.349. [DOI] [PubMed] [Google Scholar]
- 39.Morrison SJ, Prowse KR, Ho P, et al. Telomerase activity in hematopoietic cells is associated with self-renewal potential. Immunity. 1996;5:207–16. doi: 10.1016/s1074-7613(00)80316-7. [DOI] [PubMed] [Google Scholar]
- 40.Alvi AJ, Clayton H, Joshi C, et al. Functional and molecular characterisation of mammary side population cells. Breast Cancer Res. 2003;5:R1–8. doi: 10.1186/bcr547. [DOI] [PMC free article] [PubMed] [Google Scholar]
- 41.Zhu X, Kumar R, Mandal M, et al. Cell cycle-dependent modulation of telomerase activity in tumor cells. Proc Natl Acad Sci USA. 1996;93:6091–5. doi: 10.1073/pnas.93.12.6091. [DOI] [PMC free article] [PubMed] [Google Scholar]
- 42.Hirschmann-Jax C, Foster AE, Wulf GG, et al. A distinct “side population” of cells with high drug efflux capacity in human tumor cells. Proc Natl Acad Sci USA. 2004;101:14228–33. doi: 10.1073/pnas.0400067101. [DOI] [PMC free article] [PubMed] [Google Scholar]
- 43.Patrawala L, Calhoun T, Schneider-Broussard R, et al. Side population is enriched in tumorigenic, stem-like cancer cells, whereas ABCG2+ and ABCG2– cancer cells are similarly tumorigenic. Cancer Res. 2005;65:6207–19. doi: 10.1158/0008-5472.CAN-05-0592. [DOI] [PubMed] [Google Scholar]
- 44.Durand RE, Olive PL. Cytotoxicity, Mutagenicity and DNA damage by Hoechst 33342. J Histochem Cytochem. 1982;30:111–6. doi: 10.1177/30.2.7061816. [DOI] [PubMed] [Google Scholar]
- 45.Montanaro F, Liadaki K, Schienda J, et al. Demystifying SP cell purification: viability, yield, and phenotype are defined by isolation parameters. Exp Cell Res. 2004;298:144–54. doi: 10.1016/j.yexcr.2004.04.010. [DOI] [PubMed] [Google Scholar]
- 46.Nadin BM, Goodell MA, Hirschi KK. Phenotype and hematopoietic potential of side population cells throughout embryonic development. Blood. 2003;102:2436–43. doi: 10.1182/blood-2003-01-0118. [DOI] [PubMed] [Google Scholar]
- 47.Uchida N, Dykstra B, Lyons K, et al. ABC transporter activities of murine hematopoietic stem cells vary according to their developmental and activation status. Blood. 2004;103:4487–95. doi: 10.1182/blood-2003-11-3989. [DOI] [PubMed] [Google Scholar]
- 48.Kondo M, Wagers AJ, Manz MG, et al. Biology of hematopoietic stem cells and progenitors: implications for clinical application. Annu Rev Immunol. 2003;21:759–806. doi: 10.1146/annurev.immunol.21.120601.141007. [DOI] [PubMed] [Google Scholar]
- 49.Shi GM, Xu Y, Fan J, et al. Identification of side population cells in human hepatocellular carcinoma cell lines with stepwise metastatic potentials. J Cancer Res Clin Oncol. 2008;134:1155–63. doi: 10.1007/s00432-008-0407-1. [DOI] [PMC free article] [PubMed] [Google Scholar]
- 50.Gilbertson RJ, Rich JN. Making a tumour’s bed: glioblastoma stem cells and the vascular niche. Nat Rev Cancer. 2007;7:733–6. doi: 10.1038/nrc2246. [DOI] [PubMed] [Google Scholar]
- 51.Palmer TD, Willhoite AR, Gage FH. Vascular niche for adult hippocampal neurogenesis. J Comp Neurol. 2000;425:479–94. doi: 10.1002/1096-9861(20001002)425:4<479::aid-cne2>3.0.co;2-3. [DOI] [PubMed] [Google Scholar]
- 52.Kang H, Watkins G, Douglas-Jones A, et al. The elevated level of CXCR4 is correlated with nodal metastasis of human breast cancer. Breast. 2005;14:360–7. doi: 10.1016/j.breast.2004.12.007. [DOI] [PubMed] [Google Scholar]
- 53.Kaplan RN, Riba RD, Zacharoulis S, et al. VEGFR1-positive haematopoietic bone marrow progenitors initiate the pre-metastatic niche. Nature. 2005;438:820–7. doi: 10.1038/nature04186. [DOI] [PMC free article] [PubMed] [Google Scholar]
Associated Data
This section collects any data citations, data availability statements, or supplementary materials included in this article.
Supplementary Materials
Fig. S1 (Left) PCR methods to assess for IgH generearrangements performed on DNA obtained from the SP, non-SP andtotal DTG cell fractions reveal a monoclonal IgH gene rearrangement. The monoclonal bands detected in the three samples are of similar size supporting the interpretation that they are clonally related. (Right). High levels of expression of c-Myc were confirmed in both cell fractions by RT-PCR.
Fig. S2 Hoechst 33342 toxicity study in DTG cells. Thesame number of DTG were incubated with Hoechst 33342 in a finalconcentration of 5 μg/ml (37°C for 1.5 hrs) and with 5μg/ml of sterile PBS (37°C for 1.5 hrs) as a control. SPprocedure was performed, but without sorting, and after the cellswere cultured for 10 days. An initial decrease of cell number wasobserved in both Hoechst incubated and control. However, asustained increase in the total cell number was seen in bothsamples starting the fifth day and no differences in total cellnumbers were seen after day 7.
Fig. S3 CD34– SP cells form largercolonies (A) and exhibited higher clonogenicity (B)than CD34+ cells. (A) Representativepictures of the cell colonies for CD34+ andnegative SP cells are shown. The pictures were taken at the samemagnification. (B) The CD34+ SP cellfraction was less clonogenic than the CD34– SPcell fraction, 11% for CD34+ SPcells and 36% for CD34– SP-cells. TheCD34+ cell fraction represented up to 5% of the total SP population.
Fig. S4 SP cell analysis in human lymphoma cell lines. Eleven out of 12 human lymphoma cell lines demonstrated a rare, but distinct SP population ranging between 0.01% and 0.32%. L428, a Hodgkin cell line, did not contain a detectable SP cell fraction. The highest percentage is shown in the figure. The results of three determinations and the standard deviation (S.D.) are shown in the table.