

Abstract
The growth of cancer cells as multicellular spheroids has frequently been reported to mimic the in vivo tumour architecture and physiology and has been utilized to study antitumour drugs. In order to determine the distinctive characteristics of the spheroid-derived cells compared to the corresponding monolayer-derived cells, we enriched multicellular spheroid-forming subpopulations of cells from three human breast cancer cell lines (MCF7, MCF10AT and MCF10DCIS.com). These spheroid-derived cells were injected into female athymic nude mice to assess their tumorigenic potential and were profiled for their characteristic miRNA signature. We discovered that the spheroid-derived cells expressed increased levels of osteopontin (OPN), an oncogenic protein that has been clinically correlated with increased tumour burden and adverse prognosis in patients with breast cancer metastasis. Our studies further show that increased OPN levels are brought about in part, by decreased levels of hsa-mir-299–5p in the spheroid-forming population from all three cell lines. Moreover, the spheroid-forming cells can organize into vascular structures in response to nutritional limitation; these structures recapitulate a vascular phenotype by the expression of endothelial markers CD31, Angiopoeitin-1 and Endoglin. In this study, we have validated that hsa-mir-299–5p targets OPN; de novo expression of OPN in turn plays a critical role in enhancing proliferation, tumorigenicity and the ability to display vasculogenic mimicry of the spheroid-forming cells.
Keywords: breast cancer, miRNA, hsa-mir-299–5p, osteopontin, angiogenesis, vasculogenic mimicry
Introduction
Despite advances in treatment modalities, complete eradication of breast cancer metastases has proven to be challenging. Development of resistance to conventional therapy, unpredictable response and relapse remain major challenges in the management of breast cancer patients [1–3]. The culture of cancer cells in the form of multicellular spheroids has been used as a model to evaluate the efficacy of antitumour drugs [4] since this system preserves the architecture of tumour cells in three dimensions [5–7]. In order to assess the characteristics of the multicellular spheroid-derived cells, we enriched a subpopulation of cells from three established breast cancer cell lines by culturing them as spheroids. These cell subpopulations exhibited increased tumorigenic potential when injected into mice. Various changes in molecular expression [8, 9] and even in biological activity [10, 11] have been reported to exist between the three-dimensional and the conventional monolayer cultures.
MicroRNAs (miRNAs) are members of the class of non-coding RNAs that have emerged as regulators of gene expression. They have been reported to regulate gene expression at the level of both, transcription and translation [12]. Their role in cancer pathogenesis has become increasingly evident. Several recent studies have identified miRNAs as obvious novel diagnostic and prognostic indicators and therapeutic targets [13–19]. Recent evidence indicate that miRNAs can function as tumour suppressors or oncogenes [12, 20]. Oncogenic miRNAs (oncomiRs) are the miRNAs with a defined role in cancer [20]. In clinically derived breast cancer specimens the expression of several miRNAs was deregulated in correlation with certain pathologic features [21]. Specifically, miRNAs have been reported to influence processes such as epithelial-to-mesenchymal transition [22] and tumour invasion and metastasis [23–25]. miRNAs have also been implicated in tamoxifen resistance of breast cancer [26, 27] and doxorubicin resistance of breast cancer [28].
Thus, given the fact that miRNAs play a determinative role in imparting chemoresistance and the fact that multicellular spheroid-forming sub-population of cells (SFCs) are predominantly used to in drug-response studies, we profiled the SFCs from three breast cancer cell lines for their characteristic miRNA signature. We found that compared to the monolayer-derived cells, the osteopontin (OPN)-targeting miRNA, hsa-mir-299–5p was commonly downregulated in the SFC subpopulations from all three cell lines. We have previously shown that the expression of an oncogenic protein, OPN is functionally critical to the tumorigenic ability of cancer cells [29]. OPN is an acidic phosphoglycoprotein that can signal via CD44 and several integrins to orchestrate several events in the cell such as invasion, migration, cell survival and proliferation, chemotaxis and adhesion [30–34]. OPN has been clinically correlated with increased tumour burden and adverse prognosis in patients with breast cancer metastasis [30, 35–41]. OPN influences several signalling pathways that play a role in tumour progression and metastasis [31, 42–45]. In agreement with the miRNA findings, the breast cancer-SFC subpopulation secretes OPN de novo. We further find that the elevated OPN is important to the ability of the breast cancer-SFC cells to re-organize into vascular-like structures.
Methods and materials
Cell culture
MCF10AT and MCF10DCIS.com cell lines [46, 47] were grown in DMEM/F-12 (Invitrogen, Carlsbad, CA, USA) supplemented with 5% heat inactivated horse serum (Invitrogen), 100 ng/ml cholera toxin (Calbiochem, San Diego, CA, USA), 10 μg/ml insulin (Sigma, St. Louis, MO, USA), 25 ng/ml epidermal growth factor (EGF; Sigma) and 500 ng/ml hydrocortisone (Sigma). These cell lines were acquired from the Barbara Ann Karmanos Cancer Center (Detroit, MI, USA). The MCF10DCIS.com cell line is locally aggressive and was obtained by serial xenograft passages of the premalignant, tumorigenic MCF10AT cells in SCID mice [46, 48]. The MCF7 cells were grown in DMEM/F-12 (Invitrogen) supplemented with 5% heat inactivated horse serum (Invitrogen) and 10 μg/ml insulin (Sigma). All cells were maintained in a humidified 5% CO2 environment at 37 °C.
The spheroid-forming cell population (SFC) from MCF10AT, MCF7 and MCF10DCIS.com cells was enriched by culturing them under conditions of compromised adherence in low attachment tissue culture plates (Corning, Corning, NY) in DMEM-F12 (Invitrogen) supplemented with 0.4% bovine serum albumin (BSA; Sigma), 25 ng/ml EGF (Sigma) and 10ng/ml basic fibroblast growth factor (bFGF; Sigma) [49]. The effect of OPN on spheroid structure was studied by adding 2 μg/ml blocking/neutralizing anti-OPN antibody (Sigma) or an isotype control into the spheroid culture medium.
The effect of serum-starvation was studied by culturing the spheroids for 16 hrs in serum-free, phenol red-free medium followed by growth in the ambient medium for 48–72 hrs. Photographs were acquired at 10× magnification using a Zeiss Axiocam 200M microscope (Carl Zeiss Microimaging, Gottingen, Germany).
Immunoblotting
Cell lysates (30 μg) were resolved by SDS-PAGE and immunoblotted for CD31 (Millipore, Billerica, MA, USA), Angiopoietin-1 (SantaCruz Biotech, SantaCruz, CA, USA) and Endoglin 1 (Millipore). β-actin (Bio-Rad, Hercules, CA, USA) was monitored as a loading control.
In order to assess the secreted OPN, 2 × 10⁵ cells were seeded in growth medium. The next day, growth medium was replaced with serum-free, phenol-red free, DMEM-F12 (Invitrogen). The conditioned medium was harvested 16 hrs later and immunoblotted for OPN (Assay Designs, CA, USA). Blots were developed with SuperSignal enhanced chemiluminescence substrate (Pierce, Rockford, IL, USA) and exposed using a Fuji LAS3000 imager (Fujifilm Life Science, Stamford, CT, USA).
microRNA analysis
RNA quality was assessed using the Bioanalyser2100 (Agilent, Palo Alto, CA, USA) and RNA measurement on the Nanodrop instrument (Wilmington, DE, USA). The samples were labelled using the miRCURY™ Hy3™/Hy5™ labelling kit and hybridized on the miRCURY™ LNA Array (v.8.1) (Exiqon, Denmark).
Quantitative RT-PCR
For analysis of OPN mRNA levels in cell lines, RNA from various cell lines was subjected to real time quantitative real-time RT-PCR (qRT-PCR). 1 μg of total RNA was used to synthesize cDNA (High Capacity Reverse Transcription kit from Applied Biosystems, Foster City, CA). PCR was performed with 40 ng of cDNA with OPN TaqMan primer probe sets in TaqMan Universal PCR Master Mix (Applied Biosystems) using a BioRad iQ5Real-Time Detection system (Bio-Rad) with the following thermocycling conditions of two initial steps of 50 °C for 2 min., 95 °C for 10 min. followed by 40 cycles of 95 °C for 15 sec. and 60 °C for 1 min. OPN transcript levels were normalized to GAPDH levels (ΔCT), which was used to calculate changes in OPN expression (2−ΔΔCT). The 2−ΔΔCT values of the SFC cells were normalized to their respective monolayer-derived adherent cells.
For analysis of mature miRNA levels by real-time RT-PCR, cDNA was generated using the MicroRNA Reverse Transcription kit (Applied Biosystems). Total RNA (200 ng) was used to synthesize cDNA using primers specific to either U6 (control) or hsa-mir-299–5p. PCR was done using 1.33 μl of cDNA with either U6 or hsa-mir299–5p TaqMan primer probe sets with 1× TaqMan Universal PCR Master Mix, No AmpErase UNG (Applied Biosystems). The following thermocycling conditions were used: an initial step of 95 °C for 10 min. followed by 40 cycles of 95 °C for 15 sec. and 60 °C for 1 min. hsa-mir-299–5p miRNA levels were normalized to U6 (ΔCt = Ct299–5p-CtU6) levels which was used to calculate changes in hsa-mir-299–5p miRNA levels (ΔΔCt). To compare changes in expression between monolayer-derived adherent breast cancer cells and SFC cells, the adherent breast cancer cells were set as calibrator, which were defined as 100% and compared to their respective SFC cells. The levels of hsa-mir-299–5p was determined as 2−ΔΔCt× 100% wherein ΔΔCt =ΔCtbreast cancer–ΔCtNormal Breast or ΔΔCt =ΔCtSFC–ΔCtadherent.
Transfection with anti-mir-299–5p
To inhibit endogenous miRNA, anti-miR™ miRNA Inhibitor (Ambion, Austin, TX, USA) was transfected into MCF10AT and MCF10DCIS.com cells. Anti-miRNA was delivered by reverse transfection into cells with siPORT NeoFX transfection reagent (Ambion). Briefly, transfection complexes were diluted in serum free medium containing 5 μl of siPORT reagent and 40, 60 and 100 nM anti-miRNA. Complexes were added to each well of a six well plate and 2.3 ml (100,000 cells/ml) of cells were overlaid on complexes. Cells were assayed for knockdown 48 hrs post-transfection. The experiments were performed in triplicate and were repeated at least once.
Plasmid constructs
Oligos encompassing the hsa-mir-299 binding site in the 3′ UTR region of OPN mRNA 5′-agctttgtggcttcatggaaactccctgtaaactaaaagcttcagggttatgtcta-3′ and 5′–ctagtagacataaccctgaagcttttagtttacagggagtttccatgaagccacaa-3′[50] were annealed and cloned into the HindIII and SpeI sites of the pMIR-Report vector (Ambion) to generate pMIR-Report-OPN.
The hsa-mir-299 expression construct was generated in pIRES2-EGFP (Clontech) by annealing commercially synthesized oligonucleotides corresponding to the mature miRNA of hsa-mir-299 5′-aattccaagaaatggtttaccgtcccacatacattttgaatatgtatgtgggatggtaaaccgcttcttcgg-3′ and 5′-gatcccgaagaagcggtttaccatcccacatacatattcaaaatgtatgtgggacggtaaaccatttcttgg-3′ followed by cloning into the BamHI and EcoRI sites of pIRES2-EGFP.
Luciferase reporter assay
Cells were transfected using Lipofectamine 2000 (Invitrogen) per manufacturer’s protocol. Briefly cells were plated one day prior to transfection in complete medium. Cells were transfected with 50 ng of pMIR-Report or pMIR-Report-OPN in combination with either 100 ng pIRES2-EGFP vector alone or pIRES2-EGFP-hsa-mir-299 construct. Total protein from the cells was harvested 36 hrs post-transfection and luciferase activity was measured using a Turner 20/20 Luminometer (Turner Biosystems, Sunnyvale, CA, USA). The assays were performed in triplicate and the entire assay was repeated once.
Semi-thin sections
Cells were fixed with 3% glutaraldehyde in cacodylate buffer. Specimens were post-fixed with 1% osmium tetroxide, dehydrated and embedded in PolyBed 812 media (Polysciences Inc., Warrington, PA, USA). One-micron sections were stained with toluidine blue and examined by light microscopy. Sections were examined and photographed using a Nikon E-600 light microscope (Nikon Instruments Inc., Melville, NY, USA) with digital imaging.
Scanning electron microscopy
Cells from culture were placed on a coverslip and spray fixed with Surgipath Cytology Fixative (Surgipath Medical Industries, Inc., Richmond, IL, USA). The cover slips were attached to stubs, and the specimens were coated with gold-palladium in a Denton DSM-5A cold sputter module (Denton Vacuum, Moorestown, NJ, USA). Specimens were viewed and photographed in a Philips XL20 scanning electron microscope (FEI, Hillsboro, OR, USA).
Tumour growth assay
Cells at 70–90% confluence were detached with Trypsin-EDTA (Invitrogen), washed with chilled Calcium and Magnesium-free Dulbecco’s Phosphate Buffered Saline (CMF-DPBS), and re-suspended in ice-cold Hank’s Balanced Salt Solution (Invitrogen) and injected into the third mammary fat pad of 6 week old, female athymic mice (Harlan Sprague Dawley, Indianapolis, IN, USA). The SFC cells were mechanically dissociated, counted and similarly injected into mice. Tumour size was measured weekly and mean tumour diameter calculated by taking the square root of the product of orthogonal measurements. Mice were killed after the mean tumour diameter reached 1.0 cm [29]. In order to monitor the effect of OPN on tumour growth, cells were transfected with OPN shRNA (NM636) or universal scrambled-sequence cloned into pSUPER using Lipofectamine 2000 (Invitrogen). The shRNA targets the following sequence ACGAGUCAGCUGGAUGACC in OPN at position 636 from the start codon per Genbank sequence NM_000582 [29].
Transfected cells were harvested after 48 hrs and injected as detailed above. A parallel transfection was assessed by immunoblotting and confirmed to be knocked down for OPN consistent with previous results [29]. Mice injected with MCF7 cells and the corresponding SFCs received subcutaneous implants with estrogen pellets as previously described by us [51]. For all mice experiments, we used 8 mice per experimental group and the entire experiment was repeated once. Animals were maintained under the guidelines of the National Institute of Health and the University of South Alabama. All protocols were approved and evaluated by Institutional Animal Care and Use Committee. Food and water were provided ad libitum.
Statistical analysis
Statistical differences between groups were assessed using the Mann–Whitney test, t-test or ANOVA, using GraphPad Prism 4 software. Statistical significance was determined if the analysis reached 95% confidence. The precise P-values are listed in the corresponding figure legends. In all figures the error bars represent standard error of the mean (S.E.M.).
Results
The spheroid-forming cells (SFC) are highly tumorigenic
We cultured three breast cancer cell lines, MCF7, MCF10AT and MCF10DCIS.com in the form of multicellular spheroids (Fig. 1A). Notably, the spheroids from the three cell lines displayed differences in their morphology. The spheroids enriched from MCF7 cells appeared to comprise of cells packed more tightly in a compact structure than those from MCF10AT and MCF10DCIS.com.
Fig 1.

The enriched sub-populations of spheroid cells are highly tumorigenic (A) Photomicrographs of spheroids generated from MCF7 (MCF7-SFC), MCF10AT (MCF10AT-SFC) and MCF10DCIS.com (DCIS-SFC) cell lines. (B) The spheroid forming cells enriched from MCF10DCIS.com (DCIS-SFC) are highly tumorigenic when implanted into the mammary fat pad of female athymic nude mice. As few as 50,000 (50 K) cells are able to form a rapidly growing tumour (indicated by *; P= 0.02 for the entire period of tumour growth) compared to the adherent MCF10DCIS.com cells (DCIS; 1million cells injected). The spheroid-forming cells derived from MCF7 cells (MCF7-SFC) display enhanced tumorigenic potential compared to the monolayer-derived adherent cells. As few as 1 × 10⁵ cells (1E5) MCF7-SFC cells are able to form a tumour at the same rate (P= 0.50) as that of the adherent MCF7 cells. Eight mice were injected per experimental group and the entire experiment was repeated once.
We assessed the tumorigenicity of the spheroid-enriched cells following implantation into the mammary fat pad of athymic female nude mice (Fig. 1B). We did not co-inject with Matrigel, as is commonly done. Instead we chose to inject just the cells per se, in order to assess their tumorigenicity without extraneous modifiers. We found that as few as 50,000 spheroid-enriched cells from MCF10DCIS.com (DCIS-SFC) are able to form a fast-growing tumour that attains an average tumour diameter of 10 mm within 4 weeks. Moreover, a mere 25,000 DCIS-SFC cells formed a similar sized tumour at the same rate as 1 million adherent MCF10DCIS.com cells. While the tumour from 50,000 DCIS-SFC cells attained an average size of 10 mm after 26 days, those from adherent MCF10DCIS.com cells achieved this size close to 50 days post-injection. Overall, the rate of tumour formation by the adherent MCF10DCIS.com cells was significantly slower than the DCIS-SFC cells (P= 0.02). Similar behaviour was noted with the spheroid-enriched cells from MCF7. MCF7-SFC cells (1 × 10⁵) were able to form a tumour at the same rate (P= 0.5) as that of one million monolayer-derived adherent MCF7 cells. Thus, injection of 10-fold less MCF7-SFCs generated a tumour of approximately 9 mm after 7 weeks, comparable to 1 million adherent MCF7 cells. Injection of fewer numbers (50,000 and 25,000) of the MCF-SFCs did result in tumours, but after a prolonged period of latency.
Thus, overall, the spheroid-enriched cells display enhanced tumorigenicity compared to the adherent monolayer-derived cells. We would like to emphasize that we did not attempt to titrate the SFC subpopulation in order to determine the lowest injectable cell number necessary to form a tumour (since that has been published by several other labs [49, 52, 53]), but rather verified that our SFC cells are capable of forming tumours with cell numbers much lower than those required for routine tumour formation assays. Thus, the spheroid-forming cells are a functionally distinct population of breast cancer cells that bear enhanced tumorigenic potential.
The enriched SFC subpopulation secretes OPN de novo
We and others have previously shown that the oncoprotein, OPN plays a functionally determinative role in the development and progression of cancer [29, 42, 54, 55]. The monolayer-derived adherent MCF7, MCF10AT and MCF10DCIS.com cell lines do not secrete OPN (below detection limits; results not shown). In order to determine if the SFCs derived from these cells express OPN, we assessed the SFC population for their levels of OPN mRNA by a real-time qRT-PCR. We found that the SFCs express increased levels of OPN messenger RNA (Fig. 2A) when compared to the OPN transcript levels from their respective monolayer-derived adherent cells. OPN is a secreted protein. In order to assess if increased mRNA levels are reflected as secreted OPN, we tested the conditioned culture medium from the SFCs for the presence of OPN. In order to ensure that we rule out the effect of the added media supplements in the growth medium of spheroids, all cells were grown in DMEM-F12 without phenol red or any added supplements for 16–18 hrs. We saw that the SFCs secrete OPN de novo into the culture medium (Fig. 2B) unlike the adherent breast cancer cells from which they were derived.
Fig 2.
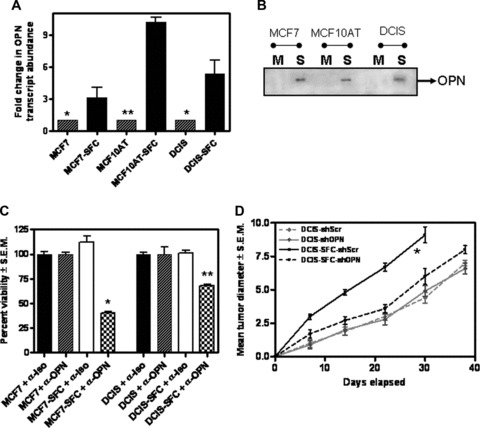
The OPN expressed de novo by the SFCs is vital to their malignant behaviour. The SFC subpopulation of cells derived from MCF7, MCF10AT and MCF10 DCIS.com (DCIS) cell lines expresses (A) An increase in the levels of OPN transcript. RNA from the three adherent cell lines and from the SFC population was assayed by real-time quantitative RT-PCR. Results are expressed relative to the respective adherent cells (*P < 0.05; **P < 0.005) and represent experiments done in triplicate with one repeat. (B) The SFC (S) cells secrete OPN. Conditioned serum-free medium from the cells was harvested and immunoblotted for osteopontin (OPN), while the monolayer-derived adherent (M) cell lines do not. (C) Antibody-mediated neutralization of OPN (α-OPN) negatively impacts the proliferation of the SFC cells derived from MCF7 (P < 0.001) and MCF10DCIS.com (DCIS) (P < 0.005). The adherent cells are not affected. As a control, the cells were treated with an isotype control antibody (α-Iso). All groups were assessed in triplicate. (D) Transfection of the short hairpin RNA to OPN (shOPN) significantly (indicated by *; P= 0.03) retards the tumour growth of the SFC subpopulation enriched from MCF10DCIS.com (DCIS-SFC) compared to the SFC cells treated with Scrambled-shRNA (shScr). The adherent MCF10DCIS.com (DCIS) do not respond notably to the OPN shRNA (P > 0.5 for the entire period of the experiment). Eight mice were injected per experimental group and the entire experiment was repeated once.
OPN functionally contributes to tumorigenicity of the spheroid-forming cells
We previously published that abrogating OPN expression greatly reduced the tumorigenicity of aggressive, metastatic human breast cancer cells [29]. When the secreted OPN was squelched by the addition of a neutralizing anti-OPN antibody, the SFCs proliferated significantly slower compared to the cells with an isotype control antibody added. In the presence of an anti-OPN antibody the proliferation rate of MCF7- SFC and MCF10DCIS- SFC was reduced to 40% (P < 0.001) and 60% (P < 0.005) respectively of the untreated cells. In contrast, the proliferation of the monolayer-derived adherent MCF7 and MCF10DCIS.com cells was not affected by the addition of a neutralizing OPN antibody (Fig. 2C). In order to assess the effectivity of the anti-OPN Ab, we monitored the overall levels of MMP-2 as a surrogate marker since MMP-2 has been reported to be transcriptionally upregulated downstream of OPN signalling [56, 57]. As shown in Fig. S1A, neutralizing the activity of OPN with an antibody decreases the levels of MMP-2 transcript, suggesting that the added antibody blocked OPN-initiated signalling resulting in decreased MMP-2 levels.
In order to determine if the increased expression of OPN contributed towards the growth advantage of the tumour, we injected 50,000 spheroid-enriched cells from MCF10DCIS.com cells (DCIS- SFC) that were transfected with either the shRNA to OPN or a universal scrambled-sequence control (Fig. S1B). The MCF10DCIS- SFC transfected with shRNA to OPN (DCIS- SFC + OPN shRNA) showed significant (P= 0.03) retardation in the tumour growth rate compared to MCF10DCIS- SFC transfected with scrambled-sequence shRNA (DCIS- SFC + Scr shRNA). While the MCF10DCIS- SFC + Scr shRNA group attained an average size of 9 mm in just 30 days, the MCF10DCIS- SFC + OPN shRNA tumours attained 8 mm average size after 38 days (Fig. 2D). Thus, transfecting shRNA to OPN resulted in a ∼30% slower growth rate of the MCF10DCIS- SFC. Transfection of OPN shRNA did not significantly (P > 0.5) impact the tumour growth rate of the monolayer-derived MCF10DCIS.com cells. This is consistent with our observation showing that the adherent MCF10DCIS.com cells do not secrete OPN into the culture medium (Fig. 2B). Thus, our findings imply that OPN functionally contributes to the growth of the SFCs. Moreover, silencing of OPN from malignant breast cancer cells negatively impacted their tumorigenic potential.
The spheroid-forming cells can organize into tubular structures
In vivo, when the tumour cells are stressed, deprived of nutrition, they display phenotypic plasticity in the form of vascular mimicry wherein the tumour cells organize themselves into a vascular phenotype [58]. This allows them to form channels in order to harness a supply of nutrients to sustain the growth of the tumour cells. We assessed the ability of the SFCs to respond to nutrient stress. The MCF7-SFCs were grown under serum-free conditions in an attempt to mimic the in vivo condition of nutrient limitation. Upon restoration of the ambient growth conditions (for spheroids, in presence of serum), as the SFCs recovered from the stress, they organized themselves into vascular-like networks (Fig. 3A and B) as against the spheroids that they normally organize into (Fig. 1A). This indicates that under conditions of stress, the SFCs are capable of changing their morphology and undergoing cellular reorganization. Similar behaviour was seen when MCF10DCIS.com- SFCs were subjected to nutritional stress and recovery (Fig. S2). In contrast, the monolayer-derived adherent cells did not display such cellular re-arrangement in response to nutrient stress (data not shown).
Fig 3.

The SFC cells can organize into tubular structures. (A and B) Shown are two representative pictures of scanning electron microscopy performed on these structures (Please see text for details). Bar corresponds to 200 μm in (A) and 500 μm in (B). (C and D) Depleting OPN results in a disruption of the organization of the coalescing spheroids. Shown is a representative photomicrograph (using phase contrast microscopy) of the MCF7-SFC cells in presence of an (C) isotype control antibody and (D) blocking anti-OPN antibody. Bar corresponds to 100 μm.
OPN is critical to the development of the vascular-like structures
In order to address the role of the secreted OPN in the response to nutrient stress, we tested the effect of a neutralizing anti-OPN antibody and an isotype control under nutrient limiting conditions. While the isotype control did not have any noticeable effects, the addition of an anti-OPN antibody (Fig. 3C and D) completely disrupted the spheroid structure within 48 hrs. The spheroid structure did not re-form even after extended incubation (7 days) in culture despite the presence of non-adherent, viable cells scattered throughout as single cells. This suggests that removal of OPN interfered with the ability of the SFCs to maintain the spheroid structure and to adapt to nutrient limitation.
The vascular-like structures formed by the SFC cells enclose a lumen
In order to visualize if the tubular structure was just a randomly organized mass of cells or whether it gave rise to a central lumen, we stained semi-thin (1 μm) sections with toluidine blue. As shown in Figure 4A (arrows), it appears that there are lumens being created by the clearance of the interior cells. This is more evident from a magnified view of the structure (Fig. 4B and C). The lumen is surrounded by multiple layers of the cancer cells. The average diameter of the lumens formed is 71.2 ± 9.1 μm (from 12 independent measurements). This diameter corresponds to that of a small to medium-sized capillary [59]. Thus, we find that under conditions of nutrient limitation, the spheroids coalesce to form tubular structures that enclose lumens.
Fig 4.

The vascular-like structures formed by the SFC cells enclose a lumen (A) The structures formed in response to nutrient stress bear lumens (indicated by arrows). From 12 independent measurements, using the microbar as a guide, we determined that the average lumen diameter is 71.2 ± 9.1 μm. (B and C) Magnified images of two areas of the tubular structure. Bar corresponds to 100 μm.
The SFC subpopulation is capable of vasculogenic mimicry
Vasculogenic mimicry refers to the plasticity of tumour cells and is the ability of tumour cells to take on the properties of endothelial cells and form mosaic structures that can nourish the tumour with blood supply. In order to address the hypothesis that the SFCs are capable of this vasculogenic mimicry, we immunoblotted the lysates from the SFCs and the respective adherent breast cancer cell lines for endothelial markers [60]. We see that the SFCs display de novo endothelial surface markers, CD31, angiopoietin-1 and (Endoglin) CD105 (Fig. 5A), suggesting that the SFCs are potentially capable of vasculogenic mimicry. We quantitated the intensity of the signals for CD31, Angiopoeitin-1 and Endoglin and have normalized the readings to the respective β-actin signal (Fig. 5 B–D). We see that the SFCs express significantly (P < 0.05) increased levels of CD31, Angiopoietin-1 and Endoglin compared to their respective adherent cells. As seen in Figure S3, the cells comprising the tubular structure formed by MCF7-SFCs express CD31. Staining for CD31 is also strongly seen around the lumen formed in the structure.
Fig 5.

The SFC cell subpopulation is capable of vasculogenic mimicry. (A) The enriched SFC (S) population from MCF7, MCF10AT and MCF10DCIS.com (DCIS) expresses de novo CD31, Angiopoietin-1 and Endoglin compared to the adherent (P) breast cancer cells. (B–D) Densitometric analysis (normalized to their respective β-actin signal) of the differential levels of CD31, Angiopoietin-1 and Endoglin indicate that compared to their respective monolayer-derived adherent cells, the SFCs express significantly (indicated by *) greater levels of the three molecules. The comparisons for Angiopoietin are as follows: MCF-SFC versus MCF7 (P= 0.034), MCF10AT-SFC versus MCF10AT (P= 0.0159) and DCIS-SFC versus DCIS (P= 0.0023). The comparisons for CD31 are as follows: MCF-SFC versus MCF7 (P= 0.0091), MCF10AT-SFC versus MCF10AT (P= 0.0009) and DCIS-SFC versus DCIS (P= 0.0008). The comparisons for Endoglin are as follows: MCF-SFC versus MCF7 (P= 0.0058), MCF10AT-SFC versus MCF10AT (P= 0.0017) and DCIS-SFC versus DCIS (P= 0.0361).
The OPN-targeting microRNA hsa-mir-299–5p is commonly downregulated in the SFC cell subpopulation enriched from all three breast cancer cell lines
In order to understand the role of miRNAs in contributing to the OPN-mediated behaviour of the SFC subpopulation of breast cancer cells, we identified the miRNAs that are commonly de-regulated in the SFC cells enriched from three breast cancer cell lines. Bioinformatic search at the miRBASE Sanger database [50] for putative targets of hsa-mir-299–5p revealed a binding site in the 3′ UTR of the OPN mRNA. Specifically, hsa-mir-299–5p is predicted to bind to the mRNA of OPN from +1083 to +1095 (+1 corresponds to the translation start of OPN). This binding site corresponds to the 3′ untranslated region of OPN mRNA (272 bp downstream of the translation stop site).
Specific qRT-PCR for hsa-mir-299–5p confirmed that the levels of this miRNA are significantly decreased in the SFC population (Fig. 6A) compared to the respective monolayer-derived adherent cells. In order to test if OPN is indeed targeted by this miRNA, we transfected MCF10AT cells and MCF10DCIS.com cells with an anti-miRNA inhibitor specific for hsa-mir-299–5p (that will specifically bind to and inhibit endogenous hsa-mir-299–5p). As is expected of the anti-miRNA inhibitor, transfection of the inhibitor did not alter the levels of hsa-mir-299–5p (data not shown). However, we saw that in MCF10AT cells OPN was upregulated with as low as 40 nM of the anti-miRNA 48 hrs post-treatment and further increased with 60 and 100 nM concentrations of the anti-miRNA (Fig. 6B). Similarly, in MCF10DCIS.com cells, treatment of the cells with 60 and 100 nM of anti-miRNA caused an increase in the OPN levels. These results suggest that with increasing concentrations of the anti-miRNA, the available pool of hsa-miR-299–5p in the cell is inhibited in its ability to act on its messenger RNA targets. This allows for translation of the messenger RNAs and expression of the respective proteins. We have documented an increase in the protein levels of OPN upon treatment of cells with the anti-miRNA inhibitor specific to hsa-mir-299–5p. Thus, these experiments suggest that OPN is a target of hsa-mir-299–5p.
Fig 6.

The levels of the OPN-targeting miRNA, hsa-miR-299–5p are decreased in the SFC subpopulation. (A) The levels of hsa-miR-299–5p are significantly decreased in the SFC subpopulation enriched from three breast cancer cell lines viz. MCF7 (P < 0.02), MCF10AT (P < 0.02) and MCF10DCIS.com (P < 0.02), as measured by qRT-PCR (assessed in triplicate). (B) MCF10AT and MCF10DCIS.com cells transfected with anti-miRNA inhibitor 299–5p show an increase in the levels of OPN. Cells were transfected with the indicated concentrations (nM) of the anti-miRNA and assayed 24 and 48 hrs later. Lysates were analysed for OPN expression by immunoblotting. (C) Cos-7 cells and MCF10AT were transfected with pMIR-Report (empty vector) or pMIR-Report bearing the hsa-miR-299–5p-binding site downstream of a luciferase reporter (pMIR-OPN). Co-transfection with a construct expressing hsa-miR-299–5p (299–5p) results in significant (indicated with an *; P= 0.001) suppression of the reporter. pIRES: empty vector control. (D) Overexpression of hsa-mir-299–5p decreases levels of OPN. SFCs from MCF10AT and MCF10DCIS.com were transfected with either empty vector, pIRES (vec) or with a recombinant construct that constitutively expresses hsa-mir-299–5p. As compared to the controls, cells transfected with hsa-mir-299–5p showed a significant (P < 0.05) decrease in the levels of OPN transcript (assessed by real-time RT-PCR).
Next, we examined the ability of hsa-miR-299–5p to target its putative binding site in the mRNA of OPN in two cell systems, Cos-7 and MCF10A. We cloned the hsa-mir-299–5p-binding site from the OPN mRNA downstream of a luciferase reporter in pMIR-Report to generate pMIR-Report-OPN. In this construct, the activity of luciferase is under regulation of hsa-mir-299–5p. When pMIR-Report-OPN was co-transfected with a construct that overexpresses hsa-mir-299–5p, we saw a ∼42% and 30% reduction (P= 0.001) in the activity of pMIR-Report-OPN (Fig. 6C) in Cos-7 and MCF10AT cells respectively. This suggested that hsa-mir-299–5p overexpressed from the pIRES2-EGFP construct was able to regulate the activity of luciferase via the putative hsa-mir-299–5p-binding site from the OPN mRNA. Moreover, overexpression of hsa-mir-299–5p in MCF7-SFCs and DCIS-SFCs causes a significant (P < 0.05) decrease in the levels of OPN mRNA as well (Fig. 6D). Thus cumulatively, our experiments (Fig. 6B– D) substantiated the role of hsa-mir-299–5p in targeting OPN.
Discussion
Tumour heterogeneity plays an important role in determining disease progression and therapeutic resistance. A small population of cells that is inherently drug-resistant is believed to determine tumour progression and micrometastatic spread. Malignant sub-populations of breast cancer cells have been enriched and propagated in culture in three dimensions as multicellular spheroids [4]. These spheroid structures are believed to recapitulate the tumour architecture and physiology more closely compared to the monolayer cell culture conditions [4, 61, 62] and are used in studies investigating drug sensitivity [63–65]. In order to characterize the cells derived from these spheroids, we enriched a spheroid forming subpopulation (SFC) of cells from three breast cell lines: MCF10AT (representing a model of proliferative, pre-neoplastic breast); MCF7 (representing adenocarcinoma of the breast) and the mildly aggressive MCF10DCIS.com cells (representing lesions of Human Comedo Ductal Carcinoma in Situ in xenograft models). The spheroid-derived cells formed a tumour upon injection of far fewer (40-fold less) cells, i.e. the growth rate exhibited by the monolayer-derived, adherent MCF10DCIS.com cells was similar to that of 25,000 SFCs enriched from this cell line. Thus, we enriched a sub-population of cells that displayed an enhanced tumorigenic potential.
In recent decades, the microenvironment or niche has emerged as particularly critical for tumour behaviour and metastasis. The niche comprises the surrounding cells and the extracellular matrix that interact with the tumour cells and serves as a medium for cellular crosstalk. Under normal physiological conditions, the niche maintains homeostatic regulation of the cells. As the cancer cells acquire self-sufficiency and undergo uncontrolled proliferation, due to genetic changes within or as a result of changes in the microenvironment, the niche gets transformed into a microenvironment that favours proliferation and growth [66–68]. Deregulation of the niche can be a result of factors that are secreted by the cells comprising the niche or by the cancer cells themselves, factors that can signal pro-proliferative events in the cancer cells. OPN is one such secreted molecule that signals to promote cell proliferation, invasive and migratory behaviour and metastasis [29, 30, 34, 39, 69]. It is noteworthy that the SFCs secrete OPN de novo since the adherent cells (MCF7, MCF10AT and MCF10DCIS.com) do not secrete OPN (below the detection limits). This implicates that OPN, secreted by the SFC population in a tumour constitutes a component of the tumour microenvironment. Thus, our discovery that the SFC population of breast cancer cells secretes OPN de novo has important implications on the role of OPN in regulating the behaviour of all the heterogeneous cells that comprise the tumour. Our studies show that OPN plays an important role in the proliferative ability of the SFCs and favourably influences the malignant behaviour of breast cancer cells. The three-dimensional structure of the spheroids makes them an ideal model to evaluate the effects of chemotherapeutic drugs from the perspective of diffusion and adhesion barriers created by cell–cell contacts. As a component of the secretome of cancer cells, OPN interacts with cell surface via integrins and CD44 variants and can act as a medium for cell adhesion [70, 71].
The sustained growth of a tumour is accompanied by and made possible by the evolution of the unstable cells that constitute the tumour [72, 73] and by the recruitment of nutrients via an angiogenic supply [74]. OPN promotes survival of endothelial cells [75] and enhances tumour growth and angiogenesis [42, 45, 76] by activating signalling cascades through autocrine and paracrine mechanisms in breast cancer. A number of cellular stress factors such as hypoxia, nutrient deprivation or inducers of reactive oxygen species (ROS) are important stimuli of angiogenic signalling [77]. Our assessment of the ability of the SFCs to respond to conditions of nutrient deprivation showed that in response to nutrient stress the SFCs functionally organized into tubular structures. The tubular structures appear to be comprised of smaller coalesced structures. We further confirmed that these tubular arrangements enclose lumen-like structures. The lumen diameter corresponds to that of a small to medium-sized capillary; potentially, this capillary can also serve as a route for the cancer cells to shed into, thereby promoting systemic spread and distant colonization. Neutralization of the OPN secreted by the SFCs did not permit the development of such a structure (Fig. 3C and D) suggesting that OPN played a vital role in the ability of the SFCs to metamorphose into a vascular phenotype and contributing to tumour neo-vascularization. Moreover, we find that the SFCs enriched from all three breast cancer cell lines display endothelial cell markers (Fig. 5), CD31, Angiopoietin-1 and Endoglin [58, 60], suggesting that the SFCs are primed towards an endothelial phenotype. The expression of these vascular markers is concomitant with the expression of OPN Thus, OPN expression by the SFCs, acquired in part by the downregulation of hsa-mir-299–5p, appears to contribute to their malignant behaviour by allowing them to adapt to restrictive situations imposed by conditions of nutritional limitation by forming multicellular cancer cell units [78] to re-capitulate a vascular niche that sustains the growth of the tumour cells and potentiates the malignant activity of the tumour.
With the increasing evidence for the role of miRNAs in malignant progression, we sought to determine the distinct differences between the monolayer-derived, adherent cells (MCF7, MCF10AT and MCF10DCIS.com) and the respective SFCs by profiling their miRNA expression. Computational predictions indicate that one miRNA may target sets of genes, and suggest that over 50% of human protein-coding genes might be regulated by miRNAs [79]. As a result, miRNAs can modulate protein expression and contribute to tumour growth by regulating expression of critical genes, including those involved in breast cancer cell propagation [80, 81]. In order to determine if the upregulation of OPN expression was a result of de-regulated miRNA expression, we focused our study towards hsa-miR-299–5p that was commonly downregulated in the SFCs derived from all three cell lines. We performed a bioinformatic search [50] for putative target mRNAs of hsa-miR-299–5p, and found that the 3′ UTR of OPN bears a site that is likely recognized by hsa-miR-299–5p. We have previously shown that the expression of OPN is acquired as breast cancer cells increase in their malignant potential [29]. Interaction of miRNA with its target mRNA has been known to result in inhibition of protein expression due to either degradation of the mRNA (perfect or near-perfect complementarity to the target site) or because of inhibition of protein synthesis (imperfect interaction with target) [19].
Thus, increased levels of the OPN mRNA and protein expression by the SFCs may in part be due to the decreased levels of hsa-mir-299–5p among other endogenous factors. This is supported by our observation that functionally, targeting hsa-mir-299–5p using anti-miRNA upregulated expression of OPN, complemented by the decreased activity of a reporter (placed under control of hsa-mir-299–5p) and decreased levels of OPN mRNA in response to overexpression of the mature hsa-mir-299–5p. Thus, we have conclusively demonstrated that hsa-mir-299–5p regulates OPN. To our knowledge this is the first report of regulation of OPN by miRNA.
Thus, our studies have identified that spheroid-derived cells express decreased levels of hsa-mir-299–5p; this results in increased OPN expression by the SFCs. OPN constitutes a vital component of the niche of these cells and potentiates the malignant behaviour of the breast cancer cells. The gain-of-OPN expression permits the spheroid forming breast cancer cells to metamorphose into vascular structures that support a lumen, thereby highlighting their role in tumour angiogenesis. To the best of our knowledge, our study is the first to identify a biologically relevant target of hsa-mir-299–5p; conversely, for the first time, we have determined the role of an miRNA in regulating OPN, and the resultant malignant behaviour of breast cancer cells.
Acknowledgments
We wish to thank Ms. Freda McDonald, Department of Pathology, University of South Alabama, for technical assistance with the SEM studies and Ms. Rama Kastury, for assistance with lab work.
Supporting Information
Fig. S1 (A) Neutralizing OPN using an antibodydecreases the levels of MMP-2. We treated the SFCs from MCF7 andDCIS cells with either an isotype-control (Iso) or a neutralizinganti-OPN Ab (OPN). As compared to the isotype-control treatedcells, the anti-OPN Ab decreases the levels of MMP-2 in the cells.(B) RNAi-mediated silencing of OPN in SFCs. The DCIS-SFCtransfected with OPN shRNA (DCIS-SFC-shOPN) are significantly(indicated by *; P < 0.01) silenced for OPN expression compared to the DCIS-SFC transfected with universal scrambled-sequence cloned into pSUPER (DCIS-SFC-shScr).
Fig. S2 The SFC cells derived from MCF10DCIS.com cellsare able to organize into tubular structures. Shown are tworepresentative pictures (A and B) of scanningelectron microscopy performed on these structures. Bar correspondsto 500 μm. (C) The initiation of the development of alumen by the death and clearance of cells in the tubular structureformed by the MCF10DCIS.com-SFCs.
Fig. S3 The SFC cells derived from MCF7 cells expressCD31. The tubular structures formed by the MCF7-SFC were stainedwith anti-CD31 antibody. Shown are representative pictures(A and C) in phase contrast and (B andD) under fluorescence. (D) shows specific stainingaround the lumen in the structure. The bar corresponds to 50 μmin all pictures.
Please note: Wiley-Blackwell are not responsible for the content or functionality of any supporting materials supplied by the authors. Any queries (other than missing material) should be directed to the corresponding author for the article.
References
- 1.Li X, Lewis MT, Huang J, et al. Intrinsic resistance of tumorigenic breast cancer cells to chemotherapy. J Natl Cancer Inst. 2008;100:672–9. doi: 10.1093/jnci/djn123. [DOI] [PubMed] [Google Scholar]
- 2.McGrogan BT, Gilmartin B, Carney DN, et al. Taxanes, microtubules and chemoresistant breast cancer. Biochim Biophys Acta. 2008;1785:96–132. doi: 10.1016/j.bbcan.2007.10.004. [DOI] [PubMed] [Google Scholar]
- 3.Campone M, Campion L, Roche H, et al. Prediction of metastatic relapse in node-positive breast cancer: establishment of a clinicogenomic model after FEC100 adjuvant regimen. Breast Cancer Res Treat. 2008;109:491–501. doi: 10.1007/s10549-007-9673-x. [DOI] [PubMed] [Google Scholar]
- 4.Kim JB, Stein R, O’Hare MJ. Three-dimensional in vitro tissue culture models of breast cancer– a review. Breast Cancer Res Treat. 2004;85:281–91. doi: 10.1023/B:BREA.0000025418.88785.2b. [DOI] [PubMed] [Google Scholar]
- 5.Mayer B, Klement G, Kaneko M, et al. Multicellular gastric cancer spheroids recapitulate growth pattern and differentiation phenotype of human gastric carcinomas. Gastroenterology. 2001;121:839–52. doi: 10.1053/gast.2001.27989. [DOI] [PubMed] [Google Scholar]
- 6.Ivascu A, Kubbies M. Diversity of cell-mediated adhesions in breast cancer spheroids. Int J Oncol. 2007;31:1403–13. [PubMed] [Google Scholar]
- 7.Pickl M, Ries CH. Comparison of 3D and 2D tumor models reveals enhanced HER2 activation in 3D associated with an increased response to trastuzumab. Oncogene. 2009;28:461–8. doi: 10.1038/onc.2008.394. [DOI] [PubMed] [Google Scholar]
- 8.Laderoute KR, Murphy BJ, Short SM, et al. Enhancement of transforming growth factor-alpha synthesis in multicellular tumour spheroids of A431 squamous carcinoma cells. Br J Cancer. 1992;65:157–62. doi: 10.1038/bjc.1992.34. [DOI] [PMC free article] [PubMed] [Google Scholar]
- 9.Theodorescu D, Sheehan C, Kerbel RS. TGF-beta gene expression depends on tissue architecture. In Vitro Cell Dev Biol. 1993;29A:105–8. doi: 10.1007/BF02630937. [DOI] [PubMed] [Google Scholar]
- 10.Kerbel RS, Rak J, Kobayashi H, et al. Multicellular resistance: a new paradigm to explain aspects of acquired drug resistance of solid tumors. Cold Spring Harb Symp Quant Biol. 1994;59:661–72. doi: 10.1101/sqb.1994.059.01.076. [DOI] [PubMed] [Google Scholar]
- 11.Kobayashi H, Man S, Graham CH, et al. Acquired multicellular-mediated resistance to alkylating agents in cancer. Proc Natl Acad Sci U S A. 1993;90:3294–8. doi: 10.1073/pnas.90.8.3294. [DOI] [PMC free article] [PubMed] [Google Scholar]
- 12.Nelson KM, Weiss GJ. MicroRNAs and cancer: past, present, and potential future. Mol Cancer Ther. 2008;7:3655–60. doi: 10.1158/1535-7163.MCT-08-0586. [DOI] [PubMed] [Google Scholar]
- 13.Takamizawa J, Konishi H, Yanagisawa K, et al. Reduced expression of the let-7 microRNAs in human lung cancers in association with shortened postoperative survival. Cancer Res. 2004;64:3753–6. doi: 10.1158/0008-5472.CAN-04-0637. [DOI] [PubMed] [Google Scholar]
- 14.Wu W, Sun M, Zou GM, et al. MicroRNA and cancer: Current status and prospective. Int J Cancer. 2007;120:953–60. doi: 10.1002/ijc.22454. [DOI] [PubMed] [Google Scholar]
- 15.Jay C, Nemunaitis J, Chen P, et al. miRNA profiling for diagnosis and prognosis of human cancer. DNA Cell Biol. 2007;26:293–300. doi: 10.1089/dna.2006.0554. [DOI] [PubMed] [Google Scholar]
- 16.Calin GA, Pekarsky Y, Croce CM. The role of microRNA and other non-coding RNA in the pathogenesis of chronic lymphocytic leukemia. Best Pract Res Clin Haematol. 2007;20:425–37. doi: 10.1016/j.beha.2007.02.003. [DOI] [PubMed] [Google Scholar]
- 17.Cho WC. OncomiRs: the discovery and progress of microRNAs in cancers. Mol Cancer. 2007;6:60. doi: 10.1186/1476-4598-6-60. [DOI] [PMC free article] [PubMed] [Google Scholar]
- 18.Negrini M, Calin GA. Breast cancer metastasis: a microRNA story. Breast Cancer Res. 2008;10:203. doi: 10.1186/bcr1867. [DOI] [PMC free article] [PubMed] [Google Scholar]
- 19.Lowery AJ, Miller N, McNeill RE, et al. MicroRNAs as prognostic indicators and therapeutic targets: potential effect on breast cancer management. Clin Cancer Res. 2008;14:360–5. doi: 10.1158/1078-0432.CCR-07-0992. [DOI] [PubMed] [Google Scholar]
- 20.Zhang B, Pan X, Cobb GP, et al. microRNAs as oncogenes and tumor suppressors. Dev Biol. 2007;302:1–12. doi: 10.1016/j.ydbio.2006.08.028. [DOI] [PubMed] [Google Scholar]
- 21.Iorio MV, Ferracin M, Liu CG, et al. MicroRNA gene expression deregulation in human breast cancer. Cancer Res. 2005;65:7065–70. doi: 10.1158/0008-5472.CAN-05-1783. [DOI] [PubMed] [Google Scholar]
- 22.Gregory PA, Bert AG, Paterson EL, et al. The miR-200 family and miR-205 regulate epithelial to mesenchymal transition by targeting ZEB1 and SIP1. Nat Cell Biol. 2008;10:593–601. doi: 10.1038/ncb1722. [DOI] [PubMed] [Google Scholar]
- 23.Tavazoie SF, Alarcon C, Oskarsson T, et al. Endogenous human microRNAs that suppress breast cancer metastasis. Nature. 2008;451:147–52. doi: 10.1038/nature06487. [DOI] [PMC free article] [PubMed] [Google Scholar]
- 24.Huang Q, Gumireddy K, Schrier M, et al. The microRNAs miR-373 and miR-520c promote tumour invasion and metastasis. Nat Cell Biol. 2008;10:202–10. doi: 10.1038/ncb1681. [DOI] [PubMed] [Google Scholar]
- 25.Ma L, Teruya-Feldstein J, Weinberg RA. Tumour invasion and metastasis initiated by microRNA-10b in breast cancer. Nature. 2007;449:682–8. doi: 10.1038/nature06174. [DOI] [PubMed] [Google Scholar]
- 26.Zhao JJ, Lin J, Yang H, et al. MicroRNA-221/222 negatively regulates estrogen receptor alpha and is associated with tamoxifen resistance in breast cancer. J Biol Chem. 2008;283:31079–86. doi: 10.1074/jbc.M806041200. [DOI] [PMC free article] [PubMed] [Google Scholar] [Retracted]
- 27.Miller TE, Ghoshal K, Ramaswamy B, et al. MicroRNA-221/222 confers tamoxifen resistance in breast cancer by targeting p27Kip1. J Biol Chem. 2008;283:29897–903. doi: 10.1074/jbc.M804612200. [DOI] [PMC free article] [PubMed] [Google Scholar]
- 28.Kovalchuk O, Filkowski J, Meservy J, et al. Involvement of microRNA-451 in resistance of the MCF-7 breast cancer cells to chemotherapeutic drug doxorubicin. Mol Cancer Ther. 2008;7:2152–9. doi: 10.1158/1535-7163.MCT-08-0021. [DOI] [PubMed] [Google Scholar]
- 29.Shevde LA, Samant RS, Paik JC, et al. Osteopontin Knockdown Suppresses Tumorigenicity of Human Metastatic Breast Carcinoma, MDA-MB-435. Clin Exp Metastasis. 2006;23:123–33. doi: 10.1007/s10585-006-9013-2. [DOI] [PMC free article] [PubMed] [Google Scholar]
- 30.Rodrigues LR, Teixeira JA, Schmitt FL, et al. The role of osteopontin in tumor progression and metastasis in breast cancer. Cancer Epidemiol Biomarkers Prev. 2007;16:1087–97. doi: 10.1158/1055-9965.EPI-06-1008. [DOI] [PubMed] [Google Scholar]
- 31.He B, Mirza M, Weber GF. An osteopontin splice variant induces anchorage independence in human breast cancer cells. Oncogene. 2006;25:2192–202. doi: 10.1038/sj.onc.1209248. [DOI] [PubMed] [Google Scholar]
- 32.Shevde LA, Samant RS, Goldberg SF, et al. Suppression of human melanoma metastasis by the metastasis suppressor gene, BRMS1. Exp Cell Res. 2002;273:229–39. doi: 10.1006/excr.2001.5452. [DOI] [PubMed] [Google Scholar]
- 33.Standal T, Hjorth-Hansen H, Rasmussen T, et al. Osteopontin is an adhesive factor for myeloma cells and is found in increased levels in plasma from patients with multiple myeloma. Haematologica. 2004;89:174–82. [PubMed] [Google Scholar]
- 34.Standal T, Borset M, Sundan A. Role of osteopontin in adhesion, migration, cell survival and bone remodeling. Exp Oncol. 2004;26:179–84. [PubMed] [Google Scholar]
- 35.Bramwell VH, Doig GS, Tuck AB, et al. Serial plasma osteopontin levels have prognostic value in metastatic breast cancer. Clin Cancer Res. 2006;12:3337–43. doi: 10.1158/1078-0432.CCR-05-2354. [DOI] [PubMed] [Google Scholar]
- 36.Chambers AF, Wilson SM, Kerkvliet N, et al. Osteopontin expression in lung cancer. Lung Cancer. 1996;15:311–23. doi: 10.1016/0169-5002(95)00595-1. [DOI] [PubMed] [Google Scholar]
- 37.Fedarko NS, Jain A, Karadag A, et al. Elevated serum bone sialoprotein and osteopontin in colon, breast, prostate, and lung cancer. Clin Cancer Res. 2001;7:4060–6. [PubMed] [Google Scholar]
- 38.Kim YW, Park YK, Lee J, et al. Expression of osteopontin and osteonectin in breast cancer. J Korean Med Sci. 1998;13:652–7. doi: 10.3346/jkms.1998.13.6.652. [DOI] [PMC free article] [PubMed] [Google Scholar]
- 39.Rudland PS, Platt-Higgins A, El-Tanani M, et al. Prognostic significance of the metastasis-associated protein osteopontin in human breast cancer. Cancer Res. 2002;62:3417–27. [PubMed] [Google Scholar]
- 40.Singhal H, Bautista DS, Tonkin KS, et al. Elevated plasma osteopontin in metastatic breast cancer associated with increased tumor burden and decreased survival. Clin Cancer Res. 1997;3:605–11. [PubMed] [Google Scholar]
- 41.Tuck AB, O’Malley FP, Singhal H, et al. Osteopontin expression in a group of lymph node negative breast cancer patients. Int J Cancer. 1998;79:502–8. doi: 10.1002/(sici)1097-0215(19981023)79:5<502::aid-ijc10>3.0.co;2-3. [DOI] [PubMed] [Google Scholar]
- 42.Chakraborty G, Jain S, Kundu GC. Osteopontin promotes vascular endothelial growth factor-dependent breast tumor growth and angiogenesis via autocrine and paracrine mechanisms. Cancer Res. 2008;68:152–61. doi: 10.1158/0008-5472.CAN-07-2126. [DOI] [PubMed] [Google Scholar]
- 43.Chakraborty G, Jain S, Behera R, et al. The multifaceted roles of osteopontin in cell signaling, tumor progression and angiogenesis. Curr Mol Med. 2006;6:819–30. doi: 10.2174/156652406779010803. [DOI] [PubMed] [Google Scholar]
- 44.Hamada Y, Yuki K, Okazaki M, et al. Osteopontin-derived peptide SVVYGLR induces angiogenesis in vivo. Dent Mater J. 2004;23:650–5. doi: 10.4012/dmj.23.650. [DOI] [PubMed] [Google Scholar]
- 45.Jain S, Chakraborty G, Kundu GC. The crucial role of cyclooxygenase-2 in osteopontin-induced protein kinase C alpha/c-Src/IkappaB kinase alpha/beta-dependent prostate tumor progression and angiogenesis. Cancer Res. 2006;66:6638–48. doi: 10.1158/0008-5472.CAN-06-0661. [DOI] [PubMed] [Google Scholar]
- 46.Santner SJ, Dawson PJ, Tait L, et al. Malignant MCF10CA1 cell lines derived from premalignant human breast epithelial MCF10AT cells. Breast Cancer Res Treat. 2001;65:101–10. doi: 10.1023/a:1006461422273. [DOI] [PubMed] [Google Scholar]
- 47.Miller FR, Santner SJ, Tait L, et al. MCF10DCIS.com xenograft model of human comedo ductal carcinoma in situ. J Natl Cancer Inst. 2000;92:1185–6. doi: 10.1093/jnci/92.14.1185a. [DOI] [PubMed] [Google Scholar]
- 48.Strickland LB, Dawson PJ, Santner SJ, et al. Progression of premalignant MCF10AT generates heterogeneous malignant variants with characteristic histologic types and immunohistochemical markers. Breast Cancer Res Treat. 2000;64:235–40. doi: 10.1023/a:1026562720218. [DOI] [PubMed] [Google Scholar]
- 49.Dontu G, Abdallah WM, Foley JM, et al. In vitro propagation and transcriptional profiling of human mammary stem/progenitor cells. Genes Dev. 2003;17:1253–70. doi: 10.1101/gad.1061803. [DOI] [PMC free article] [PubMed] [Google Scholar]
- 50. http://microrna.sanger.ac.uk/targets/
- 51.Golden T, Aragon IV, Rutland B, et al. Elevated levels of Ser/Thr protein phosphatase 5 (PP5) in human breast cancer. Biochim Biophys Acta. 2008;1782:259–70. doi: 10.1016/j.bbadis.2008.01.004. [DOI] [PMC free article] [PubMed] [Google Scholar]
- 52.Al-Hajj M, Wicha MS, Benito-Hernandez A, et al. Prospective identification of tumorigenic breast cancer cells. Proc Natl Acad Sci U S A. 2003;100:3983–8. doi: 10.1073/pnas.0530291100. [DOI] [PMC free article] [PubMed] [Google Scholar]
- 53.Al-Hajj M, Clarke MF. Self-renewal and solid tumor stem cells. Oncogene. 2004;23:7274–82. doi: 10.1038/sj.onc.1207947. [DOI] [PubMed] [Google Scholar]
- 54.Bellahcene A, Castronovo V. Increased expression of osteonectin and osteopontin, two bone matrix proteins, in human breast cancer. Am J Pathol. 1995;146:95–100. [PMC free article] [PubMed] [Google Scholar]
- 55.Furger KA, Menon RK, Tuck AB, et al. The functional and clinical roles of osteopontin in cancer and metastasis. Curr Mol Med. 2001;1:621–32. doi: 10.2174/1566524013363339. [DOI] [PubMed] [Google Scholar]
- 56.Philip S, Kundu GC. Osteopontin induces nuclear factor kappa B-mediated promatrix metalloproteinase-2 activation through I kappa B alpha/IKK signaling pathways, and curcumin (diferulolylmethane) down-regulates these pathways. J Biol Chem. 2003;278:14487–97. doi: 10.1074/jbc.M207309200. [DOI] [PubMed] [Google Scholar]
- 57.Philip S, Bulbule A, Kundu GC. Osteopontin stimulates tumor growth and activation of promatrix metalloproteinase-2 through nuclear factor-kappa B-mediated induction of membrane type 1 matrix metalloproteinase in murine melanoma cells. J Biol Chem. 2001;276:44926–35. doi: 10.1074/jbc.M103334200. [DOI] [PubMed] [Google Scholar]
- 58.Folberg R, Hendrix MJ, Maniotis AJ. Vasculogenic mimicry and tumor angiogenesis. Am J Pathol. 2000;156:361–81. doi: 10.1016/S0002-9440(10)64739-6. [DOI] [PMC free article] [PubMed] [Google Scholar]
- 59.Robert A FJ. Nanomedicine Vol. I: Basic capabilities. Vol. 1. Georgetown, TX: Landes Bioscience; 1999. [Google Scholar]
- 60.Hendrix MJ, Seftor EA, Kirschmann DA, et al. Molecular biology of breast cancer metastasis. Molecular expression of vascular markers by aggressive breast cancer cells. Breast Cancer Res. 2000;2:417–22. doi: 10.1186/bcr88. [DOI] [PMC free article] [PubMed] [Google Scholar]
- 61.Sutherland RM. Cell and environment interactions in tumor microregions: the multicell spheroid model. Science. 1988;240:177–84. doi: 10.1126/science.2451290. [DOI] [PubMed] [Google Scholar]
- 62.Shaw KR, Wrobel CN, Brugge JS. Use of three-dimensional basement membrane cultures to model oncogene-induced changes in mammary epithelial morphogenesis. J Mammary Gland Biol Neoplasia. 2004;9:297–310. doi: 10.1007/s10911-004-1402-z. [DOI] [PMC free article] [PubMed] [Google Scholar]
- 63.Desoize B, Gimonet D, Jardiller JC. Cell culture as spheroids: an approach to multicellular resistance. Anticancer Res. 1998;18:4147–58. [PubMed] [Google Scholar]
- 64.Minchinton AI, Tannock IF. Drug penetration in solid tumours. Nat Rev Cancer. 2006;6:583–92. doi: 10.1038/nrc1893. [DOI] [PubMed] [Google Scholar]
- 65.Kunz-Schughart LA, Freyer JP, Hofstaedter F, et al. The use of 3-D cultures for high-throughput screening: the multicellular spheroid model. J Biomol Screen. 2004;9:273–85. doi: 10.1177/1087057104265040. [DOI] [PubMed] [Google Scholar]
- 66.Li L, Neaves WB. Normal stem cells and cancer stem cells: the niche matters. Cancer Res. 2006;66:4553–7. doi: 10.1158/0008-5472.CAN-05-3986. [DOI] [PubMed] [Google Scholar]
- 67.Ponti D, Zaffaroni N, Capelli C, et al. Breast cancer stem cells: an overview. Eur J Cancer. 2006;42:1219–24. doi: 10.1016/j.ejca.2006.01.031. [DOI] [PubMed] [Google Scholar]
- 68.Yang ZJ, Wechsler-Reya RJ. Hit ‘em where they live: targeting the cancer stem cell niche. Cancer Cell. 2007;11:3–5. doi: 10.1016/j.ccr.2006.12.007. [DOI] [PubMed] [Google Scholar]
- 69.Tuck AB, Chambers AF. The role of osteopontin in breast cancer: clinical and experimental studies. J Mammary Gland Biol Neoplasia. 2001;6:419–29. doi: 10.1023/a:1014734930781. [DOI] [PubMed] [Google Scholar]
- 70.Chellaiah MA, Hruska KA. The integrin alpha(v)beta(3) and CD44 regulate the actions of osteopontin on osteoclast motility. Calcif Tissue Int. 2003;72:197–205. doi: 10.1007/s00223-002-1025-6. [DOI] [PubMed] [Google Scholar]
- 71.Khan SA, Cook AC, Kappil M, et al. Enhanced cell surface CD44 variant (v6, v9) expression by osteopontin in breast cancer epithelial cells facilitates tumor cell migration: Novel post-transcriptional, post-translational regulation. Clin Exp Metastasis. 2005;22:663–73. doi: 10.1007/s10585-006-9007-0. [DOI] [PubMed] [Google Scholar]
- 72.Polyak K. Breast cancer: origins and evolution. J Clin Invest. 2007;117:3155–63. doi: 10.1172/JCI33295. [DOI] [PMC free article] [PubMed] [Google Scholar]
- 73.Polyak K. Is breast tumor progression really linear. Clin Cancer Res. 2008;14:339–41. doi: 10.1158/1078-0432.CCR-07-2188. [DOI] [PubMed] [Google Scholar]
- 74.Folkman J. Angiogenesis. Annu Rev Med. 2006;57:1–18. doi: 10.1146/annurev.med.57.121304.131306. [DOI] [PubMed] [Google Scholar]
- 75.Khan SA, Lopez-Chua CA, Zhang J, et al. Soluble osteopontin inhibits apoptosis of adherent endothelial cells deprived of growth factors. J Cell Biochem. 2002;85:728–36. doi: 10.1002/jcb.10170. [DOI] [PubMed] [Google Scholar]
- 76.Hirama M, Takahashi F, Takahashi K, et al. Osteopontin overproduced by tumor cells acts as a potent angiogenic factor contributing to tumor growth. Cancer Lett. 2003;198:107–17. doi: 10.1016/s0304-3835(03)00286-6. [DOI] [PubMed] [Google Scholar]
- 77.North S, Moenner M, Bikfalvi A. Recent developments in the regulation of the angiogenic switch by cellular stress factors in tumors. Cancer Lett. 2005;218:1–14. doi: 10.1016/j.canlet.2004.08.007. [DOI] [PubMed] [Google Scholar]
- 78.Rak J. Is cancer stem cell a cell, or a multicellular unit capable of inducing angiogenesis. Med Hypotheses. 2006;66:601–4. doi: 10.1016/j.mehy.2005.09.004. [DOI] [PubMed] [Google Scholar]
- 79.Liu W, Mao SY, Zhu WY. Impact of tiny miRNAs on cancers. World J Gastroenterol. 2007;13:497–502. doi: 10.3748/wjg.v13.i4.497. [DOI] [PMC free article] [PubMed] [Google Scholar]
- 80.Ambros V, Chen X. The regulation of genes and genomes by small RNAs. Development. 2007;134:1635–41. doi: 10.1242/dev.002006. [DOI] [PubMed] [Google Scholar]
- 81.Ambros V. microRNAs: tiny regulators with great potential. Cell. 2001;107:823–6. doi: 10.1016/s0092-8674(01)00616-x. [DOI] [PubMed] [Google Scholar]
Associated Data
This section collects any data citations, data availability statements, or supplementary materials included in this article.
Supplementary Materials
Fig. S1 (A) Neutralizing OPN using an antibodydecreases the levels of MMP-2. We treated the SFCs from MCF7 andDCIS cells with either an isotype-control (Iso) or a neutralizinganti-OPN Ab (OPN). As compared to the isotype-control treatedcells, the anti-OPN Ab decreases the levels of MMP-2 in the cells.(B) RNAi-mediated silencing of OPN in SFCs. The DCIS-SFCtransfected with OPN shRNA (DCIS-SFC-shOPN) are significantly(indicated by *; P < 0.01) silenced for OPN expression compared to the DCIS-SFC transfected with universal scrambled-sequence cloned into pSUPER (DCIS-SFC-shScr).
Fig. S2 The SFC cells derived from MCF10DCIS.com cellsare able to organize into tubular structures. Shown are tworepresentative pictures (A and B) of scanningelectron microscopy performed on these structures. Bar correspondsto 500 μm. (C) The initiation of the development of alumen by the death and clearance of cells in the tubular structureformed by the MCF10DCIS.com-SFCs.
Fig. S3 The SFC cells derived from MCF7 cells expressCD31. The tubular structures formed by the MCF7-SFC were stainedwith anti-CD31 antibody. Shown are representative pictures(A and C) in phase contrast and (B andD) under fluorescence. (D) shows specific stainingaround the lumen in the structure. The bar corresponds to 50 μmin all pictures.