

Background: The glycine-binding GluN1 and GluN3 subunits of NMDA receptors have distinctive selectivity profiles.
Results: TK40 binds to the GluN1 orthosteric binding site and competitively reduces the potency of glycine.
Conclusion: TK40 is a novel glycine site antagonist with selectivity for the GluN1 subunit compared with GluN3.
Significance: The imino acetamido moiety acts as an α-amino acid bioisostere, as predicted by virtual screening.
Keywords: Crystal Structure, Ion Channels, Ligand-binding Protein, Molecular Pharmacology, Neurotransmitter Receptors, NMDA Receptor, Schild Analysis, Bioisoster, Competitive Antagonist, Glycine Site
Abstract
NMDA receptors are ligand-gated ion channels that mediate excitatory neurotransmission in the brain. They are tetrameric complexes composed of glycine-binding GluN1 and GluN3 subunits together with glutamate-binding GluN2 subunits. Subunit-selective antagonists that discriminate between the glycine sites of GluN1 and GluN3 subunits would be valuable pharmacological tools for studies on the function and physiological roles of NMDA receptor subtypes. In a virtual screening for antagonists that exploit differences in the orthosteric binding site of GluN1 and GluN3 subunits, we identified a novel glycine site antagonist, 1-thioxo-1,2-dihydro-[1,2,4]triazolo[4,3-a]quinoxalin-4(5H)-one (TK40). Here, we show by Schild analysis that TK40 is a potent competitive antagonist with Kb values of 21–63 nm at the GluN1 glycine-binding site of the four recombinant GluN1/N2A-D receptors. In addition, TK40 displayed >100-fold selectivity for GluN1/N2 NMDA receptors over GluN3A- and GluN3B-containing NMDA receptors and no appreciable effects at AMPA receptors. Binding experiments on rat brain membranes and the purified GluN1 ligand-binding domain using glycine site GluN1 radioligands further confirmed the competitive interaction and high potency. To delineate the binding mechanism, we have solved the crystal structure of the GluN1 ligand-binding domain in complex with TK40 and show that TK40 binds to the orthosteric binding site of the GluN1 subunit with a binding mode that was also predicted by virtual screening. Furthermore, the structure reveals that the imino acetamido group of TK40 acts as an α-amino acid bioisostere, which could be of importance in bioisosteric replacement strategies for future ligand design.
Introduction
N-methyl-d-aspartate (NMDA) receptors are expressed throughout the mammalian central nervous system (CNS) and are members of the larger family of ionotropic glutamate receptors that also comprises α-amino-3-hydroxy-5-methyl-4-isoxazole-propionic acid (AMPA) and kainate receptors (1). The NMDA receptors are critically involved in many physiological processes, such as neuronal development (2) as well as learning and memory (3). However, they are also implicated in numerous pathological conditions in the CNS, making NMDA receptors a promising target for therapeutic intervention (1, 4–7).
Seven different NMDA receptor subunits (GluN1, GluN2A to -D, and GluN3A and -B) have been cloned that form tetrameric complexes composed of glycine-binding GluN1 and GluN3 subunits together with glutamate-binding GluN2 subunits. The GluN1 subunit is widely expressed in the CNS and is an obligate part of all tetrameric NMDA receptor complexes, with the majority of NMDA receptors composed of two GluN1 and two GluN2 subunits (8–10). The NMDA receptor subunits contain a large extracellular N-terminal domain, a ligand-binding domain (LBD),3 a transmembrane domain composed of three transmembrane helixes (M1, M3, and M4) together with an intracellular re-entrant membrane loop (M2), and finally an intracellular C-terminal domain. The LBD of each subunit is composed of two segments of the protein (S1 and S2) and contains the agonist-binding site. The S1 and S2 segments together form a bilobed, clamshell-like structure, with the two subdomains (D1 and D2) representing the upper and the lower lobes, respectively (11–14).
Numerous glycine site antagonists have been identified that can be categorized into different classes according to their chemical structure. Key classes of glycine site antagonists include kynurenic acid derivatives, 2-carboxytetrahydroquinoline, 2-carboxyindole, 4-hydroxyquinolone, and quinoxalinedione antagonists (reviewed in Refs. 15 and 16). 5,7-Dichlorokynurenic acid (5,7-DCKA) (17) is a widely used glycine site antagonist in studies of the physiological roles of NMDA receptors due to its high potency and selectivity for the GluN1 subunit (1, 15, 16). The 2-carboxytetrahydroquinoline antagonist L-689,560 (18) is one of the most potent glycine site antagonists developed and is widely used as a radiolabeled ligand in binding studies together with another ligand, MDL-105,519, belonging to the 2-carboxyindole group of NMDA receptor glycine site antagonists (15, 16). Although antagonists at the orthosteric binding site of GluN1 have been widely used as pharmacological tools to study the roles of NMDA receptors in normal neurological processes as well as in diseases, no glycine site antagonists have been approved as drugs for clinical use (19–22).
In addition to the GluN1 subunit, a glycine binding site is also present in the GluN3A and GluN3B subunits. The presence of glycine binding sites in both GluN1 and GluN3 subunits could confound the use of glycine site antagonists that inhibit both subunits in studies of native NMDA receptors. Thus, glycine site antagonists that discriminate between these glycine sites would be useful tools to selectively study either GluN1 in the NMDA receptor complex or the physiological roles of GluN3-containing NMDA receptors. Studies using the isolated soluble LBDs of GluN1 and GluN3A subunits have revealed a unique selectivity profile for ligand binding to GluN3, which is strikingly different from that of GluN1 (23). For example, glycine site partial agonists display different rank orders of binding affinities at GluN1 and GluN3A. Later generations of glycine site antagonists (i.e. 5,7-DCKA, L-689,560, and other high affinity glycine site antagonists) exhibit strong selectivity for the isolated GluN1 LBD over the isolated GluN3A LBD, with binding affinities at GluN1 in the nanomolar range versus affinities in the 100 μm range for binding to the GluN3A LBD (23). Despite binding of the same endogenous ligand to both GluN1 and GluN3 subunits, glycine has been reported to bind with a 650-fold higher affinity at the isolated GluN3A LBD over the isolated GluN1 LBD, indicating that the glycine-binding site of GluN3 is different from that of GluN1 (23). However, at present, it remains unclear how these binding affinities determined at the soluble LBD translate into potencies at full-length receptors. Differences in the orthosteric binding site of GluN1 and GluN3A were also shown in crystal structures of GluN1, GluN3A, and GluN3B LBDs in complex with the agonist glycine or d-serine (24). We hypothesize that it is possible to exploit structural differences in the orthosteric GluN1 and GluN3 binding sites to develop antagonists that can discriminate between GluN1 and GluN3 subunits. Thus, we identified a novel glycine site antagonist using virtual screening of potential glycine site ligands. The compound has a novel scaffold compared with previously published glycine site antagonists and does not contain an α-amino acid moiety. We report here the pharmacological characterization of this novel antagonist at NMDA receptor subtypes and its binding mode using x-ray crystallography.
EXPERIMENTAL PROCEDURES
Pharmacological Characterization
DNA Constructs and Expression in Xenopus Oocytes
cDNAs encoding the GluN1-1a (GenBankTM accession number U11418; hereafter GluN1), GluN2A (GenBankTM accession number D13211), GluN2B (GenBankTM accession number M91562), GluN2C (GenBankTM accession number D13212), GluN2D (GenBankTM accession number D13214) subunits were generously provided by Dr. S. Heinemann (Salk Institute, La Jolla, CA), P. Seeburg (Max Planck Institute for Medical Research, Heidelberg, Germany), and S. Nakanishi (Osaka Bioscience Institute, Osaka, Japan). cDNAs encoding the short variant GluN3A-1 (GenBankTM accession number U29873; hereafter GluN3A) and GluN3B (GenBankTM accession number NM_133308) subunits were generously provided by Dr. D. Zhang (Sanford-Burnham Medical Research Institute, La Jolla, CA). The GluN1(F484A/T518L) mutant was made by QuikChange site-directed mutagenesis (Stratagene, Agilent Technologies, Santa Clara, CA) and verified by DNA sequencing (SeqWright, Houston, TX). Amino acid residues are numbered based on the full-length polypeptide sequence, including the signal peptide (initiating methionine is 1).
For expression in Xenopus laevis oocytes, cDNAs were linearized by restriction enzymes and used as templates to synthesize cRNA using mMessage mMachine kit (Ambion, Invitrogen). Defolliculated stage V-VI oocytes ready to inject were obtained from EcoCyte Biosciences (Castrop-Rauxel, Germany). The oocytes were coinjected with cRNAs encoding GluN1 and GluN2 or GluN3 subunit in a 1:2 ratio and maintained at 18 °C in Barth's solution containing 88 mm NaCl, 1 mm KCl, 2.4 mm NaHCO3, 0.82 mm MgSO4, 0.33 mm Ca(NO3)2, 0.91 mm CaCl2, 10 mm HEPES (pH 7.5 with NaOH) supplemented with 100 IU/ml penicillin, 100 μg/ml streptomycin, and 100 μg/ml gentamycin (Invitrogen).
Two-electrode Voltage Clamp Recordings
Two-electrode voltage clamp (TEVC) recordings were performed on Xenopus oocytes at room temperature 3–6 days postinjection using an OC-725C TEVC amplifier (Warner Instruments, Hamden, CT). Glass electrodes had a tip resistance of 0.5–2.5 megaohms and were pulled from thin walled glass capillary tubes (World Precision Instruments, Hertfordshire, UK) using a PC-10 puller (Narishige, East Meadow, NY). Voltage and current electrodes were filled with 0.3 and 3 m KCl, respectively. During recordings, oocytes were placed in a recording chamber and perfused with the extracellular recording solution comprised of 90 mm NaCl, 1 mm KCl, 10 mm HEPES, 0.5 mm BaCl2, and 0.01 mm EDTA (pH 7.4 with NaOH). Current responses were recorded at a holding potential of −40 and −60 mV for GluN1/N2 and GluN1/N3 receptors, respectively. Compounds were dissolved in extracellular recording solution and applied to the oocyte by gravity-driven perfusion using a computer-controlled 8-modular valve positioner (Digital MVP, Hamilton, Reno, NV).
Data Analysis for Concentration-Response Curves
Data were analyzed using GraphPad Prism version 5 (GraphPad Software, La Jolla, CA). Agonist concentration-response data for individual oocytes were fitted to the Hill equation, I = Imax/(1 + 10(logEC50 − log[A])·nH), where Imax is the maximum current in response to agonist, EC50 is the concentration of agonist that produces half-maximum activation, [A] is the concentration of agonist, and nH is the Hill coefficient. Antagonist concentration-response data were also fitted to the Hill equation to produce IC50 values (i.e. the concentration of antagonist that produces half-maximum inhibition). The pEC50 or pIC50, which are defined as the decimal logarithm of the reciprocal EC50 and IC50, respectively (i.e. −logEC50 and −logIC50), and the nH from the individual oocytes were used to calculate mean and S.E. For graphical presentation, the data for individual oocytes were normalized to the maximum current response in the same recording and averaged. The averaged data points were then fitted to the Hill equation and plotted together with the resulting curve. Ki values were calculated from IC50 values using the Cheng-Prusoff equation (25).
Schild Analysis
1-Thioxo-1,2-dihydro-[1,2,4]triazolo[4,3-a]quinoxalin-4(5H)-one (TK40) (Enamine, Kiev, Ukraine) antagonism was examined by the Schild method (26). Concentration-response curves for glycine in the absence and presence of increasing concentrations of TK40 were generated. Concentration-response data were analyzed as described above for agonists where the logEC50 values from the individual oocytes were used to calculate mean and S.E. The averaged EC50 values were then used to calculate the dose ratios (DR; defined as the glycine EC50 in the presence of TK40 relative to the glycine EC50 in the absence of TK40). DR was determined for four concentrations of TK40 (0.1, 0.3, 1, and 3 μm) and used to construct a Schild plot of log(DR − 1) versus log[B], where [B] is the antagonist concentration, and the plot was fitted with a straight line with variable slope. The slope of the Schild plot (i.e. the Schild slope) is 1 for a competitive antagonist at equilibrium according to the Schild equation, log(DR − 1) = pA2 + log[B], where pA2 is the negative logarithm of the antagonist concentration that produces a 2-fold shift of the agonist EC50. When the Schild slope of the “free” fit was not significantly different from 1 (determined using the 95% confidence interval), the results were taken to be consistent with the Schild equation, and the Schild plot was refitted with a straight line with the slope fixed at 1, and the equilibrium dissociation constant (Kb) of the antagonist, which then equals A2, was determined by the intercept of the abscissa.
Native Receptor Binding
The binding affinity of TK40 for native NMDA receptors (glycine site of GluN1 subunit) in rat cortical synaptosomes was determined using 1–3 nm [3H]L-689,560 (glycine site antagonist; 23.63 Ci/mmol; Tocris Cookson, Bristol, UK) as described previously (27). Brain membranes were prepared according to the method described by Ransom and Stec (28). TK40 was dissolved as a 1 mm stock solution in 50% DMSO-water. Membranes (200–400 μg of protein) in 0.25 ml of assay buffer (50 mm Tris acetate, pH 7.0 at 4 °C) were incubated for 1 h at 4 °C with radiolabel and increasing concentrations of TK40 (0.1 nm to 10 μm), in triplicate. Subsequently, samples were filtered onto GF/B-type glass fiber filters (VWR, Herlev, Denmark) presoaked in 0.3% (w/v) polyethyleneimine. Filters were washed twice with 5 ml of ice-cold assay buffer. Nonspecific binding was determined using 1 mm glycine. Radioactivity was measured by liquid scintillation counting (TriCarb 2900, PerkinElmer Life Sciences). Specific binding was analyzed by nonlinear regression curve fitting using Grafit version 3.0 (Erithacus Software Ltd., Horley, UK). Ki values were determined as described previously (29) using the published radiolabel affinity, Kd = 2.97 nm (27).
Structural Characterization
Expression and Purification of GluN1 LBD
The plasmid for expression of rat GluN1 LBD was kindly provided by Dr. H. Furukawa (Cold Spring Harbor Laboratory, Cold Spring Harbor, NY). The GluN1 LBD construct comprises an N-terminal region coding for a His tag and a thrombin cleavage site, the GluN1 S1 residues Met394–Lys544, a Gly-Thr linker, and GluN1 S2 residues Arg663–Ser800 (30). Amino acid residues are numbered based on the full-length polypeptide sequence, including the signal peptide (initiating methionine is 1) (UniProt accession number P35439). The enzymatic cleavage by thrombin leaves one remnant N-terminal Gly.
The protein was expressed in the Escherichia coli cell line Origami B (DE3) (Novagen, Madison, WI) using the T7 expression vector pET22c. An overnight culture was used to inoculate 8 liters of LB medium containing 100 μg/ml ampicillin and 30 μg/ml kanamycin and grown to an A600 of ∼0.8 at 37 °C with shaking (200 rpm). Expression was induced by adding 0.5 mm isopropyl-β-d-thiogalactopyranoside and continued overnight at 20 °C.
The cells were harvested by centrifugation at 5,500 rpm at 4 °C for 15 min, and the cell pellet was resuspended in lysis buffer (20 mm Tris-HCl, 20 mm imidazole, 500 mm NaCl, 1 mm glycine, 1 mm PMSF, 0.3 mg/ml lysozyme, 40 mg/ml DNase I, 1 mm MgCl2, and EDTA-free complete protease inhibitor tablets (Roche Applied Science), pH 7.4). The cells were lysed by passing the suspension twice through a cell disrupter (Constant Systems Ltd., Northants, UK) at 4.45 kilobars and 4 °C. The lysate was cleared by centrifugation for 30 min at 20,000 rpm and 4 °C.
The supernatant was loaded onto a 5-ml His Trap FF (GE Healthcare) column. The column was washed with 40 column volumes of buffer A (20 mm Tris-HCl, 12 mm imidazole, 150 mm NaCl, 1 mm glycine, and 5 mm methionine, pH 8). The protein was eluted by a 0–80% linear gradient of 50 ml of buffer B (20 mm Tris-HCl, 400 mm imidazole, 150 mm NaCl, 1 mm glycine, and 5 mm methionine, pH 8). The eluted protein was then dialyzed against a thrombin cleavage buffer (20 mm Tris-HCl, 150 mm NaCl, 1 mm glycine, and 1 mm EDTA, pH 8) overnight at 6 °C. The cleavage by thrombin was performed at room temperature overnight by adding 2.5 mm CaCl2 and 2.5 unit/mg of thrombin. Subsequently, the protein was dialyzed against buffer C (10 mm MES-NaOH, 25 mm NaCl, 1 mm glycine, and 1 mm EDTA, pH 6.5). As a final purification step, the protein was loaded to a 1-ml HiTrap FF (GE Healthcare) column and washed with 4 column volumes of buffer C. The protein was eluted by a 0–100% linear gradient of buffer D (10 mm MES-NaOH, 500 mm NaCl, 1 mm glycine, and 1 mm EDTA, pH 6.5). The eluted protein was then dialyzed three times against buffer E (10 mm HEPES, 50 mm NaCl, and 10% glycerol, pH 7.0) for 3 h at 4 °C.
GluN1 LBD Binding
Soluble GluN1 LBD binding was carried out as described previously (30). GluN1 LBD protein (0.20 μg) in 0.25 ml of binding assay buffer (20 mm HEPES, 150 mm NaCl, 1 mm EDTA, 10% (v/v) glycerol, pH 7.0, at 4 °C) was incubated in triplicate with increasing concentrations of TK40 (0.1 nm to 10 μm) and 1 nm [3H]MDL-105,519 (glycine site antagonist; 71.0 Ci/mmol; Amersham Biosciences) for 1 h at 4 °C. Subsequently, samples were filtered onto Whatman ME 24 0.2-μm mixed cellulose ester filters (VWR, Herlev, Denmark) presoaked in assay buffer. The filter was washed twice with 2 ml of ice-cold assay buffer. Nonspecific binding was measured using 10 mm glycine. The filters were then transferred into a 3-ml scintillation vial (Pony vial, PerkinElmer Life Sciences) and dried for 1 h at 70 °C. The dried filter was dissolved in 1.5 ml of Filter-Count (PerkinElmer Life Sciences), and radioactivity was determined by liquid scintillation counting. Ki values were determined as described above using the published radiolabel affinity, Kd = 5.86 nm (30).
Crystallization
The protein concentration was 1.5 mg/ml (in 10 mm HEPES, 50 mm NaCl, and 10% glycerol, pH 7.0). TK40 was added as solid compound, and the solution was gently shaken overnight to achieve a saturating concentration. Crystallization trays were set up by the hanging drop vapor diffusion method at 6 °C with drops of 1 μl of protein solution plus 1 μl of reservoir solution. The reservoir solution consisted of 0.3 m ammonium sulfate, 0.1 m HEPES, and 30% PEG 4000, pH 7.5. Crystals were passed through a cryoprotectant with 25% glycerol in reservoir solution before flash-cooling.
Structure Determination
The x-ray data set of GluN1 LBD in complex with TK40 was collected to 2.2 Å resolution at cryogenic temperature at beamline BL 14.1 (BESSY, Berlin, Germany). Diffraction data were processed with the programs imosflm and scala from CCP4i (31). For statistics on crystal data and data collection, see Table 1.
TABLE 1.
Statistics of data collection and structure refinement of the LBD of GluN1 in complex with the antagonist TK40
| Parameter | Value |
|---|---|
| Crystal data | |
| Space group | P2I |
| Unit cell | |
| a, b, c (Å) | 43.95; 78.59; 109.63 |
| α, β, γ (degrees) | 90.00; 94.21; 90.00 |
| Molecules (a.u.)a | 2 |
| Data collection | |
| Resolution (Å) | 39.7–2.2 (2.32–2.20)b |
| No. of unique reflection | 37,843 |
| Completeness (%) | 99.9 (100) |
| Average redundancy | 3.2 (3.2) |
| Rmerge (%)c | 9.0 (39.2) |
| I/σI | 7.1 (1.9) |
| Wilson B-factor (Å2) | 27 |
| Refinement | |
| Non-hydrogen atoms | 5185 |
| Amino acid residues | 571 |
| TK40/water/sulfate/glycerol | 2/414/8/18 |
| Rwork (%)d | 17.4 |
| Rfree (%)e | 23.2 |
| RMSDf bond (Å) | 0.007 |
| RMSD angle (degrees) | 1.0 |
| No. of residues in favored regions of Ramachandan plot (%)g | 463 (91.3%) |
| No. of residues in allowed regions of Ramachandan plot (%)g | 44 (8.7%) |
| Average B (Å2) for protein atoms (molA/molB) | 24/27 |
| Average B (Å2) for TK40 atoms (molA/molB) | 13/15 |
a Asymmetric unit of the crystal.
b Numbers in parentheses are for the outermost bin.
c Rmerge = ΣhΣi|Ii(h) − 〈I(h)〉|/ΣhΣi(h), where Ii(h) is the ith measurement.
d Rwork = Σhkl(‖Fo,hkl| − |Fc,hkl‖)/|Fo,hkl|, where |Fo,hkl| and |Fc,hkl| are the observed and calculated structure factor amplitudes, respectively.
e Rfree is equivalent to Rwork, but calculated with reflections omitted from the refinement process (5% of reflections omitted).
f RMSD, root mean square deviation.
g The Ramachandran plot was calculated according to PROCHECK version 3.4.4 (45).
The structure was solved by molecular replacement using the structure of GluN1 LBD in complex with 5,7-DCKA (Protein Data Bank (PDB) code 1PBQ; molA) as a search model for phasing the data. A clear solution comprising two molecules (molA and molB) was obtained. Subsequently, the amino acid residues, except for 20 amino acid residues in chain A and 22 amino acid residues in chain B, were automatically modeled using ARP/wARP (32). The TK40 structure was generated using PRODRG (33) and fitted into the electron density. A geometry restrain file was then generated in eLBOW (34), using the PDB file as input. TK40 was unambiguously fitted into the electron densities within molA and molB. The structure was further subjected to refinements in PHENIX (35). Between each refinement step, the structure was inspected and corrected using the program COOT (36). Gradually, water molecules, glycerol, and sulfate ions were added to the structure. In the final structure, residues Thr396–Ser800 (molA) and Arg397–Arg794 (molB) were modeled. The statistics on structure refinement can be found in Table 1. Figures were generated using PyMOL (Schrödinger, LLC). Domain openings were calculated using DynDom (37).
RESULTS
Pharmacological Characterization of TK40
We aimed at exploiting the differences in the GluN1 and GluN3 orthosteric binding sites to generate antagonists that can discriminate between the glycine-binding GluN1 and GluN3 subunits. We recently reported a virtual screen of GluN3A LBD that was based on three hybrid models of the GluN3A LBD in an antagonist-bound state (38). The models were virtually screened against a compound library of ∼4 million commercially available compounds, of which 99 shortlisted compounds were obtained. The compounds were functionally screened at GluN3A and GluN3B subunits, and active hits were subsequently functionally evaluated at diheteromeric GluN1/N2 receptors using electrophysiological recordings (38). Using this approach, we identified TK40 (Fig. 1A) as a potent antagonist at the GluN1/N2A receptor (38).
FIGURE 1.

Concentration-inhibition data at recombinant NMDA and AMPA receptors. A, chemical structure of TK40 and (S)-NS1209. The imino acetamido moiety in boldface type acts as an α-amino acid bioisostere. B and C, concentration-inhibition data of TK40 at recombinant NMDA and AMPA receptors expressed in Xenopus oocytes were examined by two-electrode voltage clamp electrophysiology. Data are mean ± S.E. from 4–9 oocytes. TK40 was co-applied with 100 μm glutamate and 0.5 μm glycine (B; glycine inhibition) or 3 μm glutamate and 3000 μm glycine (C; glutamate inhibition) at GluN1/N2 receptors, with 100 μm glycine at GluN1(F484A/T518L)/N3 receptors, and with 10 μm glutamate at GluA1 receptors. IC50 values are listed in Table 2 and Table 3. D, representative two-electrode voltage clamp recording of responses from GluN1/N2A receptors expressed in Xenopus oocytes showing inhibition by increasing concentrations of TK40 in the continuous presence of 100 μm glutamate and 0.5 μm glycine. E, concentration inhibition data of 5,7-DCKA at recombinant NMDA receptors expressed in Xenopus oocytes were examined by two-electrode voltage clamp electrophysiology. Data are mean ± S.E. from 6–9 oocytes. 5,7-DCKA was co-applied with 100 μm glutamate and 0.5 μm glycine at GluN1/N2 receptors and with 100 μm glycine at GluN1(F484A/T518L)/N3 receptors. IC50 values are listed in Table 2.
Concentration-inhibition data at recombinant GluN1/N2 receptors expressed in Xenopus oocytes were obtained using TEVC electrophysiology to assess the potency and selectivity of TK40. NMDA receptor currents were activated by a saturating concentration of glutamate (100 μm) and a glycine concentration in the EC50 range at the four GluN1/N2 receptor subtypes (0.5 μm) for evaluation of glycine inhibition (Table 2). The IC50 values of TK40 were in the low nanomolar range (IC50 = 51–160 nm) at the various recombinant GluN1/N2 receptors (Table 2 and Fig. 1, B and D). To evaluate the selectivity between the glycine-binding GluN1 and GluN3 subunits, TK40 was also characterized at GluN1(F484A/T518L)/N3A and GluN1(F484A/T518L)/N3B receptors. Diheteromeric GluN1/N3 receptors are activated by glycine that binds to both the GluN1 and GluN3 subunits (23, 24, 39, 40). Glycine has dual activity at the GluN1/N3 receptors, in that glycine appears to act agonistically at the GluN3 subunit and inhibitory through binding to the GluN1 subunit (41, 42), but agonist binding to the GluN3 subunits alone is sufficient to activate the receptor (41, 42). Enhanced glycine activation of GluN1/N3 receptors has initially been shown by disrupting glycine binding to GluN1 via mutation of key amino acids in the GluN1 ligand-binding pocket (41, 42). We have recently reported a method to isolate the GluN3 pharmacology of GluN1/N3 receptors by mutating the GluN1 subunit (i.e. GluN1(F484A/T518L)), which renders the GluN1 subunit insensitive to glycine and abolishes the concentration-dependent inhibitory component of glycine at GluN1/N3 receptors even at supersaturating glycine concentrations (38). Here, we exploit this mutated diheteromeric GluN1(F484A/T518L)/N3 receptor to characterize the interaction of TK40 with the GluN3 subunit. IC50 values of TK40 in the micromolar range (IC50 = 10–41 μm) were obtained from concentration-inhibition curves of TK40 at GluN1(F484A/T518L)/N3A and GluN1(F484A/T518L)/N3B in the presence of 100 μm glycine (glycine concentration in the range of glycine EC50 at the GluN1(F484A/T518L)/N3 receptors) (Fig. 1B and Table 2). Inhibition data of TK40 at GluN1/N2 and GluN1/N3 receptors suggest that TK40 is a potent antagonist with more than 100-fold selectivity for the GluN1 subunits over the GluN3 subunit of NMDA receptors. TK40 was also evaluated for inhibition of glutamate action at recombinant GluN1/N2 and GluA1 receptors expressed in Xenopus oocytes using TEVC electrophysiology. NMDA receptor currents were activated by a supersaturating concentration of glycine (3000 μm) and a submaximal concentration of glutamate (3 μm). The IC50 values of TK40 were 0.77 μm at GluN1/N2A and >3 μm at GluN1/N2B-D (Table 3 and Fig. 1C). The corresponding Ki values were estimated by the Cheng-Prusoff equation to be 0.56 μm, >1.3 μm, >0.8 μm, and ≫0.3 μm at GluN1/N2A-D, respectively (Table 3). AMPA receptor currents were activated by 10 μm glutamate, giving an IC50 value for TK40 of >300 μm (Ki > 180 μm) at GluA1. Glutamate inhibition data for TK40 at GluN1/N2 and GluA1 receptors show less potent inhibition (10–70-fold) than for glycine at the various GluN1/N2 receptors. TK40 show >3000-fold less potent inhibition at GluA1 over GluN1/N2 (glycine action).
TABLE 2.
Concentration-response data for TK40 and 5,7-DCKA inhibition at the glycine site at recombinant NMDA receptors
IC50 (pIC50 ± S.E.), EC50 (pEC50 ± S.E.), and equilibrium dissociation constants (Kb and Ki) at recombinant NMDA receptors expressed in Xenopus oocytes were obtained by two-electrode voltage clamp electrophysiology. pIC50 and pEC50 are defined as −logIC50 and −logEC50, respectively. nH is the Hill coefficient, and N is the number of oocytes. TK40 and 5,7-DCKA inhibition data were generated in the continuous presence of 100 μm glutamate and 0.5 μm glycine (GluN1/N2 receptors) or 100 μm glycine alone (GluN1(F484A/T518L)/N3 receptors). Kb values for TK40 were obtained using the Schild method (n = 6–8) (see Fig. 2), or Ki values were estimated using the Cheng-Prusoff equation (25). Glycine concentration-response data were generated in the continuous presence of 100 μm glutamate (GluN1/N2 receptors). ND, not determined.
| TK40 |
5,7-DCKA |
Glycine |
|||||||||
|---|---|---|---|---|---|---|---|---|---|---|---|
| IC50 (pIC50 ± S.E.) | nH | N | Kb | IC50 (pIC50 ± S.E.) | nH | N | Ki | EC50 (pEC50 ± S.E.) | nH | N | |
| μm | μm | μm | μm | ||||||||
| GluN1/N2A | 0.051 (7.3 ± 0.02)b | 1.48 | 8 | 0.063 | 0.092 (7.0 ± 0.01) | 1.47 | 9 | 0.065a | 1.2 (5.9 ± 0.02)b | 1.48 | 16 |
| GluN1/N2B | 0.040 (7.4 ± 0.02) | 1.39 | 9 | 0.026 | ND | 0.38 (6.4 ± 0.02) | 1.46 | 8 | |||
| GluN1/N2C | 0.034 (7.5 ± 0.01) | 1.41 | 8 | 0.021 | ND | 0.32 (6.5 ± 0.02) | 1.41 | 8 | |||
| GluN1/N2D | 0.16 (6.8 ± 0.01) | 1.49 | 7 | 0.036 | ND | 0.12 (6.9 ± 0.05) | 1.38 | 8 | |||
| GluN1(F484A/T518L)/N3A | 41 (4.4 ± 0.03)b | 1.26 | 4 | 15a | 97 (4.0 ± 0.03) | 0.79 | 6 | 35a | 57 (4.2 ± 0.01)b | 1.40 | 28 |
| GluN1(F484A/T518L)/N3B | 10 (5.0 ± 0.04)b | 1.39 | 4 | 4.9a | >300 | 0.80 | 6 | >150a | 95 (4.0 ± 0.02)b | 1.57 | 15 |
a Ki estimated using the Cheng-Prusoff equation.
b Data from Ref. 38.
TABLE 3.
Concentration-response data for TK40 inhibition at the glutamate site at recombinant NMDA and AMPA receptors
IC50 (pIC50 ± S.E.), EC50 (pEC50 ± S.E.), and equilibrium dissociation constants (Ki) at recombinant NMDA and AMPA receptors expressed in Xenopus oocytes were obtained by two-electrode voltage clamp electrophysiology. pIC50 and pEC50 are defined as −logIC50 and −logEC50, respectively. nH is the Hill coefficient, and N is the number of oocytes. TK40 inhibition data were generated in the continuous presence of 3 μm glutamate and 3000 μm glycine (GluN1/N2 receptors) or 10 μm glutamate (GluA1 receptors). Ki values were estimated using the Cheng-Prusoff equation (25). Glutamate concentration-response data were generated in the continuous presence of 3000 μm glycine at GluN1/N2 receptors. IC50 >3 or >300 indicates that TK40 showed less than 50% inhibition at 3 μm and 300 μm, respectively. IC50 ≫3 indicates that TK40 showed less than 20% inhibition at 3 μm.
| TK40 |
Glutamate |
||||||
|---|---|---|---|---|---|---|---|
| IC50 (pIC50 ± S.E.) | nH | N | Ki | EC50 (pEC50 ± S.E.) | nH | N | |
| μm | μm | μm | |||||
| GluN1/N2A | 0.77 (6.1 ± 0.05) | 1.19 | 6 | 0.56 | 7.7 (5.1 ± 0.02) | 1.32 | 10 |
| GluN1/N2B | >3 | 1.33 | 6 | >1.3 | 2.3 (5.6 ± 0.01) | 1.28 | 4 |
| GluN1/N2C | >3 | 1.10 | 6 | >0.8 | 1.0 (6.0 ± 0.02) | 1.15 | 12 |
| GluN1/N2D | ≫3 | 4 | ≫0.3 | 0.39 (6.4 ± 0.02) | 1.25 | 12 | |
| GluA1 | >300 | 0.67 | 8 | >180 | 15 (4.8 ± 0.02) | 0.78 | 9 |
TK40 Is a Competitive GluN1 Glycine Site Antagonist
To investigate the mode of inhibition by TK40 and determine the equilibrium dissociation constant (Kb), we performed Schild analyses at the four recombinant GluN1/N2 receptors (26). Concentration-response data for glycine in the absence and presence of TK40 at the four GluN1/N2 NMDA receptors are pictured in Fig. 2. In the presence of increasing concentrations of TK40, the concentration-response curves are shifted to the right and remain parallel with the same maximal activation as would be expected for a competitive antagonist (Fig. 2). The Kb values determined using Schild analysis were 63, 26, 21, and 36 nm at the GluN1/N2A, GluN1/N2B, GluN1/N2C, and GluN1/N2D receptors, respectively (Table 2; also see “Experimental Procedures”). We interpret these functionally derived Kb values to reflect TK40 actions at the GluN1 glycine-binding site given that supermaximal concentrations of glutamate were used to activate the receptors. For comparison, Ki values of TK40 were estimated by the Cheng-Prusoff equation to be 15 and 4.9 μm at the GluN1(F484A/T518L)/N3A and GluN1(F484A/T518L)/N3B receptors, respectively, giving more than 100-fold selectivity for the glycine-binding GluN1 subunit over the GluN3 subunit (Table 2).
FIGURE 2.

Schild analysis; TK40 reduces potency of glycine at the GluN1 subunit. A, C, E, and G, glycine concentration-response curves at the four recombinant GluN1/N2 receptors co-activated by 100 μm glutamate in the absence (0 μm) or presence of increasing concentrations of TK40. Data are from 6–8 oocytes. B, D, F, and H, Schild plots of glycine concentration-response data at the four recombinant GluN1/N2 receptors. DR, dose ratio (DR = EC50′/EC50) calculated from the EC50 values of glycine in the absence (EC50) and presence (EC50′) of TK40. Because the Schild slope was not significantly different from 1, the slope is constrained to 1 according to the Schild equation. The Kb values of TK40 are listed in Table 2.
To compare the GluN1 selectivity and potency of TK40 with that of a standard glycine site antagonist, concentration inhibition data for 5,7-DCKA at recombinant GluN1/N2A and GluN1(F484A/T518L)/N3 receptors were generated. The inhibition data were generated in the continuous presence of 0.5 μm glycine and 100 μm glutamate at GluN1/N2A receptors and 100 μm glycine alone at GluN1(F484A/T518L)/N3 receptors, giving IC50 values in the low nanomolar range (IC50 = 92 nm) at GluN1/N2A and in the micromolar range (IC50 = 97 μm and >300 μm) at GluN1(F484A/T518L)/N3A and GluN1(F484A/T518L)/N3B receptors, respectively (Fig. 1E and Table 2). The corresponding Ki values were estimated by the Cheng-Prusoff equation to be 65 nm, 35 μm, and >150 μm at GluN1/N2A, GluN1(F484A/T518L)/N3A, and GluN1(F484A/T518L)/N3B receptors, respectively, giving more than 500-fold selectivity of 5,7-DCKA for the glycine-binding GluN1 subunit over the GluN3 subunit (Table 2). TK40 is therefore a competitive glycine site antagonist with potency similar to that of the standard glycine site antagonist 5,7-DCKA at the GluN1/N2A receptors. Furthermore, TK40 displays selectivity for GluN1 over GluN3 subunits similar to that of 5,7-DCKA.
To further strengthen these findings, we performed binding experiments to native NMDA receptors in rat cortical synaptosomes using the glycine site antagonist [3H]L-689,560 as a radioligand. TK40 was able to displace the radioligand with a Ki value of 88 nm (pKi ± S.E. = 7.1 ± 0.05, n = 3) (Fig. 3A), which corresponds nicely with the Kb values found in the functional studies. To further substantiate the binding to the glycine site, we also performed binding experiments with the purified GluN1 LBD protein using the glycine site antagonist [3H]MDL-105,519 as radioligand. Here, we obtained a Ki value of 150 nm (pKi ± S.E. = 7.0 ± 0.18, n = 6) (Fig. 3B), which was not statistically significantly different than that observed at the native receptors (p = 0.419, t test). Collectively, these experiments demonstrate that TK40 is a potent competitive antagonist that binds to the orthosteric ligand-binding site of the GluN1 subunit.
FIGURE 3.
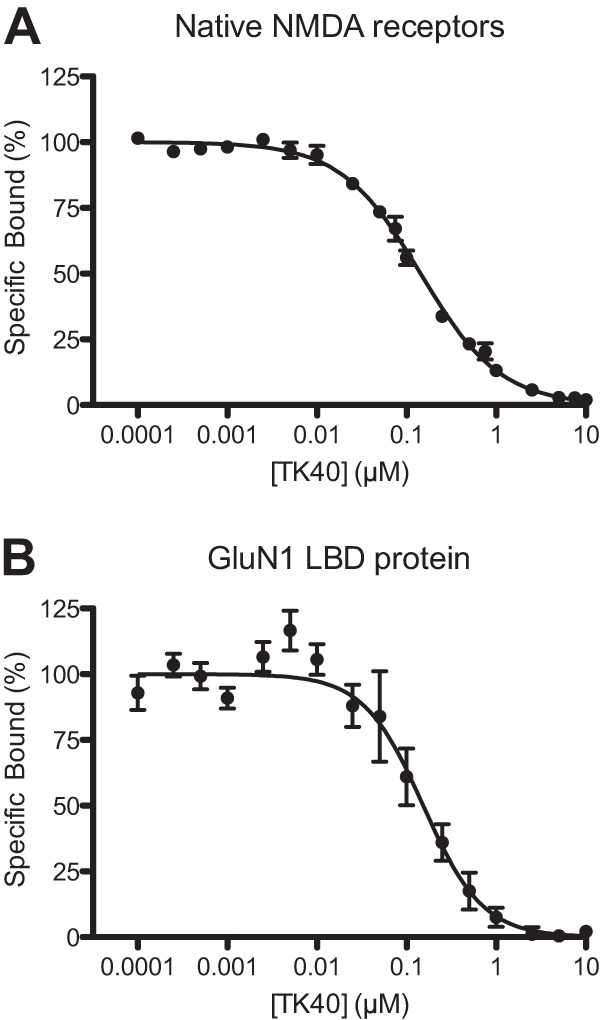
Radioligand binding competition data. Radioligand binding competition curves of TK40 at native NMDA receptors in rat cortical synaptosomes using [3H]L-689,560 as the radioligand (A) or at GluN1 LBD protein using [3H]MDL-105,519 as the radioligand (B). Shown are mean ± S.E. of pooled data from 4–6 separate experiments, conducted in triplicate. A, IC50 = 143 nm, nH = 0.97; B, IC50 = 153 nm, nH = 1.31.
The effects of TK40 at wild-type GluN1/N3 receptors expressed in Xenopus oocytes were also evaluated. The glycine-activated steady-state response at wild-type GluN1/N3 receptors were markedly potentiated by application of 3 μm TK40 with a potentiation of 1090 ± 280% (n = 5) and 2510 ± 220% (n = 10) at GluN1/N3A and GluN1/N3B, respectively (Fig. 4, A and D). TEVC electrophysiology of wild-type GluN1/N3 receptors display bell-shaped concentration-response relationships of increasing concentrations of glycine in the presence of 3 μm TK40 (Fig. 4, panels B and C and panels E and F). This bell-shaped concentration-response relationship is presumably a result of glycine binding to unblocked GluN3 subunits at low glycine concentrations (rising phase). At higher glycine concentrations, the selective block by TK40 at GluN1 subunits is outcompeted, resulting in diminished receptor current (declining phase), which is in agreement with previous reports (41, 42). For glycine-activated responses at wild-type GluN1/N3 receptors, we have previously reported that only negligible current responses (<10 nA) are observed at GluN1/N3A receptors upon glycine application and that glycine concentrations above 10 μm result in diminished receptor current at GluN1/N3B receptors, thereby producing a bell-shaped concentration-response relationship (38). Despite the potentiation, we still observed bell-shaped glycine concentration-response profiles at both wild-type GluN1/N3A and GluN1/N3B receptors in the presence of 3 μm TK40, with the receptor current diminished at glycine concentrations above 100 μm (Fig. 4, panels B and C and panels E and F). The TK40-mediated potentiation of the glycine-activated current responses and the apparent shift in the bell-shaped concentration-response relationships presumably result from selective inhibition of glycine binding to the GluN1 subunit, which is in agreement with other reports (41, 42).
FIGURE 4.

Effect of TK40 at wild-type GluN1/N3 receptors. Representative two-electrode voltage clamp recordings of responses from GluN1/N3 receptors expressed in Xenopus oocytes. A and D, potentiation of glycine-activated current response by 3 μm TK40 at GluN1/N3A (A) and GluN1/N3B (D) (potentiation of 1090 ± 280% (n = 5) and 2510 ± 220% (n = 10) at GluN1/N3A and GluN1/N3B, respectively). B and E, responses from GluN1/N3A (B) and GluN1/N3B (E) receptors to increasing concentrations of glycine in the presence of 3 μm TK40. C and F, glycine concentration-response profile at GluN1/N3A (C) and GluN1/N3B (F) in the presence of 3 μm TK40. Data are mean ± S.E. (error bars) from 4–12 oocytes.
Structure of GluN1 LBD with Bound TK40
To provide further evidence for TK40 binding to the orthosteric GluN1 glycine-binding site and to obtain insight into the molecular mechanism underlying the selectivity of TK40 for GluN1 over GluN3, we determined the structure of the rat GluN1 LBD with bound TK40. The scaffold of TK40 is different from previously published glycine site antagonists, but the glycine-mimicking part of TK40 closely resembles the competitive AMPA receptor antagonist (S)-NS1209, with the imino acetamido moiety conserved in both TK40 and (S)-NS1209 (shown in boldface type in Fig. 1A) (43).
The crystal structure of TK40 bound in the GluN1 LBD was determined to 2.2 Å resolution. Two individual molecules were present in the asymmetric unit of the crystal (molA and molB). TK40 could unambiguously be modeled into the electron density (Fig. 5A) and was found to induce an expanded cleft conformation of the GluN1 LBD with a domain opening of 23° (molA) and 24° (molB) relative to the closed structure with glycine (PDB code 1PB7) (Fig. 5B). This is in the same range as the 24° domain opening reported for the antagonist 5,7-DCKA in GluN1 LBD (30).
FIGURE 5.
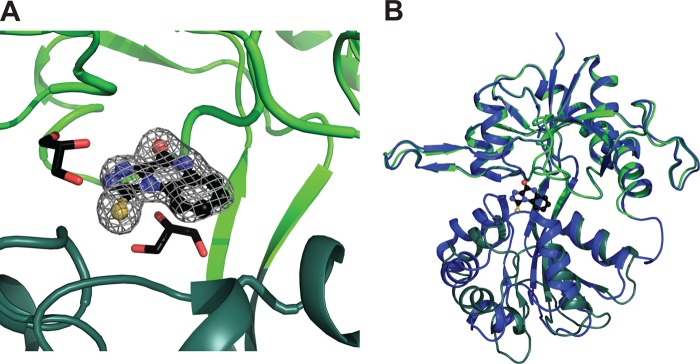
Crystal structure of the antagonist TK40 in the ligand-binding domain of GluN1. A, the omit FO − FC electron density map contoured at the 3σ level. TK40 is shown in a black ball-and-stick representation, D1 in light green, and D2 in dark green (molA). Two glycerol molecules in 4-Å vicinity of TK40 are shown, forming van der Waals interactions to TK40. B, TK40 induces ∼23° domain opening in the LBD of GluN1 compared with the structure of GluN1 in complex with glycine (PDB code 1PB7; molA; blue). The structures were superimposed on D1 residues, and the D1-D2 domain opening was calculated using DynDom (37).
The binding mode of TK40 is shown in Fig. 6, A and B. Four amino acid residues in GluN1 form hydrogen bonds to TK40: Pro516, Thr518, Arg523, and Ser688. Thus, TK40 makes most direct contacts to the upper lobe of the LBD (D1). The residue Phe484 stabilizes binding of TK40 through a π-stacking interaction (Fig. 6, A and C). Furthermore, two glycerol molecules are located in the vicinity of TK40 (Fig. 5A).
FIGURE 6.

Ligand-receptor interactions. A, two-dimensional ligand-receptor interaction plot between GluN1 LBD (molA) and TK40. The GluN1 residues are shown as green circles, and contacts from TK40 to the receptor are shown as dotted arrows (black, to side chain atoms; gray, to backbone atoms) as calculated by the program MOE (Molecular Operating Environment (MOE), version 2011.10, Chemical Computing Group Inc., Montreal, Canada). In addition, one arene contact is shown. B, schematic representation of the binding site with TK40 shown in a black ball-and-stick representation. Residues discussed in this work are shown as green sticks (light green, D1 residues; dark green, D2 residues). Potential hydrogen bonds between TK40 and binding site residues are shown as red dashed lines. C, residues located within 4 Å of TK40 that differ between GluN1 and GluN3A/3B are shown in a stick representation (green, GluN1; magenta, GluN3A). Only GluN1 residues are labeled. D, comparison of the predicted binding mode of TK40 based on the docking to GluN3A from the virtual screen (magenta) with the actual binding mode in GluN1 determined by x-ray crystallography (green). The structures were superimposed on D1 residues. E, alignment of the 11 binding site residues located within 4 Å of TK40 (rat GluN1 (UniProt accession number P35439) and rat GluN3A/3B (UniProt accession number Q9R1M7/Q8VHN2)). Residues that display side chain interactions with glycine are shown in boldface type, and those with backbone interactions are shown in italic type (24, 30). Residues interacting with each other in the closed cleft conformation are underlined (30).
In structures of GluN1 LBD in complex with full and partial agonists, a direct D1-D2 interdomain contact is formed between Gln405 in D1 and Trp731 in D2. In addition, a water-mediated contact between Gln405 and Asp732 is seen (30). These interdomain contacts are disrupted by TK40, which occupies the space between Gln405 and Trp731 and thus acts as wedge (Fig. 6B), as observed previously for 5,7-DCKA in GluN1 (30).
Comparison of TK40 Binding Site Residues in GluN1 and GluN3
Although TK40 displayed >100-fold selectivity for GluN1 over GluN3, it was still among the most potent GluN3 antagonists identified in our virtual GluN3A screen (38). We therefore compared the predicted binding mode of TK40 from the virtual screen docking with the actual binding mode determined in GluN1. Fig. 6D displays an overlay of the predicted GluN3A binding mode with the TK40-bound GluN1 structure. From this, it is evident that our virtual screening procedure was able to predict the correct binding mode, albeit it was not designed to predict whether virtual screening hits at GluN3A would have even higher potency at the related GluN1 or GluN3B-containing receptors.
A closer look at the TK40 binding site in GluN1 reveals that 11 residues are located within a distance of 4 Å from TK40 (Fig. 6, C and E). Four of these residues are identical in the glycine-binding rat GluN1 and rat GluN3 subunits: Arg523, Ser687, Ser688, and Asp732 (residues in GluN1 are listed). The seven amino acid residues that differ among GluN1, GluN3A, and GluN3B are Gln405, Phe484, Pro516, Leu517, Thr518, Trp731, and Val735 (residues in GluN1 are listed) (Fig. 6E). As noted previously, four residues in GluN1 (Pro516, Thr518, Arg523, and Ser688) form hydrogen bonds to TK40 (Fig. 6, A and B), of which Arg523 and Ser688 are conserved in GluN3A and GluN3B (Fig. 6E).
The hydrogen bonds from TK40 to Pro516 and Thr518 (being substituted with Ser631/531 and Ser633/533 in GluN3A/B) are to the backbone atoms, which are also accessible in the residues of GluN3A/B. Collectively, hydrogen bonding interactions are therefore not likely explanations for the observed subtype selectivity. Looking at the other residues in the 4-Å vicinity of TK40 that differ between GluN1 and GluN3 (Fig. 6, C and E), no direct ligand-receptor interactions through hydrogen bonding can explain the observed selectivity, pointing toward differences in side chain properties of binding site residues (see “Discussion”).
DISCUSSION
Virtual screening can successfully identify competitive antagonists that can discriminate between GluN1 and GluN3 subunits of NMDA receptors. One such antagonist (TK40) was identified in a recently published virtual screen, which was performed on a model of the open cleft antagonist-bound state of GluN3A LBD (38). TK40 was among the most potent GluN3-containing receptor antagonists identified in the screen, but here we show that the compound is more than 100-fold more potent at GluN1 (Fig. 1 and Table 2). We also provide a comprehensive pharmacological characterization of TK40, showing that it is a competitive antagonist with low nanomolar equilibrium dissociation constants at the four recombinant GluN1/N2 receptors (Kb = 21–63 nm). TK40 markedly potentiates the glycine-induced response at wild-type GluN1/N3 receptors. The effect at wild-type GluN1/N3 receptors shows that TK40 can mimic the effects of mutations in GluN1, thereby allowing evaluation of glycine binding to GluN3.
The binding affinities of TK40 are in the same range as the estimated Ki value obtained for the glycine site antagonist 5,7-DCKA at GluN1/N2A. The Ki value of 5,7-DCKA at GluN1/N2A obtained here correlates nicely with estimated Ki values (30–170 nm) reported for 5,7-DCKA at the four recombinant GluN1/N2 receptors (44). Furthermore, we report here the first functional data displaying selectivity of 5,7-DCKA for GluN1 over GluN3 subunits, which are consistent with previously reported binding studies of the isolated soluble LBDs of GluN1 and GluN3A. 5,7-DCKA has been reported to display 1000-fold selectivity for GluN1 over GluN3A, with binding affinities of 0.54 and 647 μm at GluN1 and GluN3A LBDs, respectively (23, 30).
We determined the structure of TK40 bound to the LBD of GluN1 and observed that the determined binding mode in GluN1 is very similar to the predicted binding mode from the docking of the virtual screen to GluN3A (Fig. 6D). Although TK40 displays more than 100-fold higher potency at GluN1 than at GluN3A, the similarity in binding mode is striking, and this study represents a unique example of experimental validation of a predicted binding mode from a virtual screen.
The chemical scaffold of TK40 is novel compared with the glycine site antagonists that have previously been explored by extensive medicinal chemistry efforts during the past decades (reviewed in Refs. 15 and 16). Hence, by exploiting a structure-based investigation, we discovered a novel chemotype for NMDA receptor glycine site antagonists. The imino acetamido moiety of TK40 is also present in the competitive AMPA receptor antagonist (S)-NS1209 (Fig. 1A). Comparison of our structure of TK40 bound to GluN1 with the structure of (S)-NS1209 bound to GluA2 reveals that the imino acetamido moiety forms the same four hydrogen bonds with Pro516, Thr518, and Arg523 in GluN1 (Fig. 6, A and B) and with Pro478, Thr480, and Arg485 in GluA2 (not shown) (43). These highly conserved residues also form key interactions with the α-amino acid moiety of the endogenous agonists glycine and l-glutamate, respectively. Thus, our study shows that the imino acetamido moiety can act as an α-amino acid bioisostere in more general terms than previously realized, of interest for optimization and design of novel ionotropic glutamate receptor ligands.
No direct ligand-receptor interaction through hydrogen bonding can explain the observed selectivity of TK40 for GluN1 over GluN3, and thus other mechanisms, such as attractive or repulsive van der Waals interactions, must therefore be considered. Gln405 and Trp731 form an important interdomain interaction in agonist-bound GluN1 structures (30). In GluN3A and GluN3B, the corresponding residues are Glu and Met, respectively (Fig. 6C). It has previously been observed that binding of the larger agonist d-serine in GluN3A relative to binding of glycine displaces the side chain methyl group of Met844 laterally and also pushes the side chain carboxyl group of Asp845 downward. This was speculated to contribute to the 16 and 10 times lower binding affinity of d-serine relative to glycine at the GluN3A- and GluN3B-soluble LBDs, respectively (23, 24). Given the larger size of GluN1-selective antagonists like TK40 and 5,7-DCKA, it is possible that these ligands change the position of the interdomain-stabilizing residues differently in the GluN1- and GluN3-containing receptor subtypes and thus indirectly change the dynamics of the ligand-receptor interaction.
Of the remaining residues in the 4-Å vicinity of TK40, Phe484 in GluN1 is a tyrosine in GluN3A and GluN3B, which still allows π-stacking interactions. Furthermore, the side chains of Leu517 (Phe in GluN3A and GluN3B) and Val735 (Leu in GluN3A and GluN3B) point away from the binding site. Although these interactions are not likely to play a direct role in the observed GluN1 selectivity, we cannot rule out that they play an indirect role. So far, no GluN3A or GluN3B open cleft LBD structures have been published, and the degree of opening and relative position of the D1 and D2 subdomains thus remain unknown. It is therefore possible that the GluN3A and GluN3B LBDs require more energy to provide the ∼23° cleft opening observed in the TK40-bound GluN1 structure or that the D1/D2 domains of the open cleft GluN3 LBDs are positioned in a way that provides more unfavorable interactions with TK40 compared with their position in GluN1.
In conclusion, we have reported a highly potent GluN1 glycine site antagonist TK40 discovered by structure-based investigations, which bind competitively to the orthosteric ligand-binding site with more than 100-fold selectivity for GluN1 compared with GluN3A and GluN3B. The compound has a novel chemical scaffold compared with previously published competitive GluN1 glycine site antagonists and contains an imino acetamido moiety, which acts as an α-amino acid bioisostere.
This work was supported by the Lundbeck Foundation; the GluTarget Programme of Excellence at the University of Copenhagen; the Danish Ministry of Science, Innovation, and Higher Education EliteForsk Programme; the Augustinus Foundation DanScatt; and the Danish Council for Independent Research-Medical Sciences.
The atomic coordinates and structure factors (code 4KFQ) have been deposited in the Protein Data Bank (http://wwpdb.org/).
- LBD
- ligand-binding domain
- 5,7-DCKA
- 5,7-dichlorokynurenic acid
- DR
- dose ratio
- PDB
- Protein Data Bank
- TEVC
- two-electrode voltage clamp
- TK40
- 1-thioxo-1,2-dihydro-[1,2,4]triazolo[4,3-a]quinoxalin-4(5H)-one.
REFERENCES
- 1. Traynelis S. F., Wollmuth L. P., McBain C. J., Menniti F. S., Vance K. M., Ogden K. K., Hansen K. B., Yuan H., Myers S. J., Dingledine R. (2010) Glutamate receptor ion channels. Structure, regulation, and function. Pharmacol. Rev. 62, 405–496 [DOI] [PMC free article] [PubMed] [Google Scholar]
- 2. Nacher J., McEwen B. S. (2006) The role of N-methyl-d-asparate receptors in neurogenesis. Hippocampus 16, 267–270 [DOI] [PubMed] [Google Scholar]
- 3. Lisman J. (2003) Long-term potentiation. Outstanding questions and attempted synthesis. Philos. Trans. R. Soc. Lond. B Biol. Sci. 358, 829–842 [DOI] [PMC free article] [PubMed] [Google Scholar]
- 4. Jansen M., Dannhardt G. (2003) Antagonists and agonists at the glycine site of the NMDA receptor for therapeutic interventions. Eur. J. Med. Chem. 38, 661–670 [DOI] [PubMed] [Google Scholar]
- 5. Kalia L. V., Kalia S. K., Salter M. W. (2008) NMDA receptors in clinical neurology. Excitatory times ahead. Lancet Neurol. 7, 742–755 [DOI] [PMC free article] [PubMed] [Google Scholar]
- 6. Bräuner-Osborne H., Egebjerg J., Nielsen E. O., Madsen U., Krogsgaard-Larsen P. (2000) Ligands for glutamate receptors. Design and therapeutic prospects. J. Med. Chem. 43, 2609–2645 [DOI] [PubMed] [Google Scholar]
- 7. Waxman E. A., Lynch D. R. (2005) N-methyl-d-asparate receptor subtypes. Multiple roles in excitotoxicity and neurological disease. Neuroscientist 11, 37–49 [DOI] [PubMed] [Google Scholar]
- 8. Furukawa H., Singh S. K., Mancusso R., Gouaux E. (2005) Subunit arrangement and function in NMDA receptors. Nature 438, 185–192 [DOI] [PubMed] [Google Scholar]
- 9. Kleckner N. W., Dingledine R. (1988) Requirement for glycine in activation of NMDA-receptors expressed in Xenopus oocytes. Science 241, 835–837 [DOI] [PubMed] [Google Scholar]
- 10. Laube B., Kuhse J., Betz H. (1998) Evidence for a tetrameric structure of recombinant NMDA receptors. J. Neurosci. 18, 2954–2961 [DOI] [PMC free article] [PubMed] [Google Scholar]
- 11. Erreger K., Chen P. E., Wyllie D. J., Traynelis S. F. (2004) Glutamate receptor gating. Crit. Rev. Neurobiol. 16, 187–224 [DOI] [PubMed] [Google Scholar]
- 12. Hollmann M., Heinemann S. (1994) Cloned glutamate receptors. Annu. Rev. Neurosci. 17, 31–108 [DOI] [PubMed] [Google Scholar]
- 13. Paas Y. (1998) The macro- and microarchitectures of the ligand-binding domain of glutamate receptors. Trends Neurosci. 21, 117–125 [DOI] [PubMed] [Google Scholar]
- 14. Sobolevsky A. I., Rosconi M. P., Gouaux E. (2009) X-ray structure, symmetry and mechanism of an AMPA-subtype glutamate receptor. Nature 462, 745–756 [DOI] [PMC free article] [PubMed] [Google Scholar]
- 15. Danysz W., Parsons C. G. (1998) Glycine and N-methyl-d-asparate receptors. Physiological significance and possible therapeutic applications. Pharmacol. Rev. 50, 597–664 [PubMed] [Google Scholar]
- 16. Leeson P. D., Iversen L. L. (1994) The glycine site on the NMDA receptor. Structure-activity relationships and therapeutic potential. J. Med. Chem. 37, 4053–4067 [DOI] [PubMed] [Google Scholar]
- 17. Leeson P. D., Baker R., Carling R. W., Curtis N. R., Moore K. W., Williams B. J., Foster A. C., Donald A. E., Kemp J. A., Marshall G. R. (1991) Kynurenic acid derivatives. Structure-activity relationships for excitatory amino acid antagonism and identification of potent and selective antagonists at the glycine site on the N-methyl-d-asparate receptor. J. Med. Chem. 34, 1243–1252 [DOI] [PubMed] [Google Scholar]
- 18. Leeson P. D., Carling R. W., Moore K. W., Moseley A. M., Smith J. D., Stevenson G., Chan T., Baker R., Foster A. C., Grimwood S. (1992) 4-Amido-2-carboxytetrahydroquinolines. Structure-activity relationships for antagonism at the glycine site of the NMDA receptor. J. Med. Chem. 35, 1954–1968 [DOI] [PubMed] [Google Scholar]
- 19. Huang Y. H., Ishikawa M., Lee B. R., Nakanishi N., Schlüter O. M., Dong Y. (2011) Searching for presynaptic NMDA receptors in the nucleus accumbens. J. Neurosci. 31, 18453–18463 [DOI] [PMC free article] [PubMed] [Google Scholar]
- 20. Piña-Crespo J. C., Talantova M., Micu I., States B., Chen H. S., Tu S., Nakanishi N., Tong G., Zhang D., Heinemann S. F., Zamponi G. W., Stys P. K., Lipton S. A. (2010) Excitatory glycine responses of CNS myelin mediated by NR1/NR3 “NMDA” receptor subunits. J. Neurosci. 30, 11501–11505 [DOI] [PMC free article] [PubMed] [Google Scholar]
- 21. Kenny A. V., Cousins S. L., Pinho L., Stephenson F. A. (2009) The integrity of the glycine co-agonist binding site of N-methyl-d-asparate receptors is a functional quality control checkpoint for cell surface delivery. J. Biol. Chem. 284, 324–333 [DOI] [PubMed] [Google Scholar]
- 22. Gellért L., Fuzik J., Göblös A., Sárközi K., Marosi M., Kis Z., Farkas T., Szatmári I., Fülöp F., Vécsei L., Toldi J. (2011) Neuroprotection with a new kynurenic acid analog in the four-vessel occlusion model of ischemia. Eur. J. Pharmacol. 667, 182–187 [DOI] [PubMed] [Google Scholar]
- 23. Yao Y., Mayer M. L. (2006) Characterization of a soluble ligand binding domain of the NMDA receptor regulatory subunit NR3A. J. Neurosci. 26, 4559–4566 [DOI] [PMC free article] [PubMed] [Google Scholar]
- 24. Yao Y., Harrison C. B., Freddolino P. L., Schulten K., Mayer M. L. (2008) Molecular mechanism of ligand recognition by NR3 subtype glutamate receptors. EMBO J. 27, 2158–2170 [DOI] [PMC free article] [PubMed] [Google Scholar]
- 25. Cheng Y., Prusoff W. H. (1973) Relationship between the inhibition constant (K1) and the concentration of inhibitor which causes 50 percent inhibition (I50) of an enzymatic reaction. Biochem. Pharmacol. 22, 3099–3108 [DOI] [PubMed] [Google Scholar]
- 26. Arunlakshana O., Schild H. O. (1959) Some quantitative uses of drug antagonists. Br. J. Pharmacol. Chemother. 14, 48–58 [DOI] [PMC free article] [PubMed] [Google Scholar]
- 27. Grimwood S., Moseley A. M., Carling R. W., Leeson P. D., Foster A. C. (1992) Characterization of the binding of [3H]L-689,560, an antagonist for the glycine site on the N-methyl-d-asparate receptor, to rat brain membranes. Mol. Pharmacol. 41, 923–930 [PubMed] [Google Scholar]
- 28. Ransom R. W., Stec N. L. (1988) Cooperative modulation of [3H]MK-801 binding to the N-methyl-d-asparate receptor-ion channel complex by l-glutamate, glycine, and polyamines. J. Neurochem. 51, 830–836 [DOI] [PubMed] [Google Scholar]
- 29. Nielsen B. S., Banke T. G., Schousboe A., Pickering D. S. (1998) Pharmacological properties of homomeric and heteromeric GluR1o and GluR3o receptors. Eur. J. Pharmacol. 360, 227–238 [DOI] [PubMed] [Google Scholar]
- 30. Furukawa H., Gouaux E. (2003) Mechanisms of activation, inhibition and specificity. Crystal structures of the NMDA receptor NR1 ligand-binding core. EMBO J. 22, 2873–2885 [DOI] [PMC free article] [PubMed] [Google Scholar]
- 31. Collaborative Computational Project, Number 4 (1994) The CCP4 suite. Programs for protein crystallography. Acta Crystallogr. D Biol. Crystallogr. 50, 760–763 [DOI] [PubMed] [Google Scholar]
- 32. Langer G., Cohen S. X., Lamzin V. S., Perrakis A. (2008) Automated macromolecular model building for X-ray crystallography using ARP/wARP version 7. Nat. Protoc. 3, 1171–1179 [DOI] [PMC free article] [PubMed] [Google Scholar]
- 33. Schüttelkopf A. W., van Aalten D. M. (2004) PRODRG. A tool for high-throughput crystallography of protein-ligand complexes. Acta Crystallogr. D Biol. Crystallogr. 60, 1355–1363 [DOI] [PubMed] [Google Scholar]
- 34. Moriarty N. W., Grosse-Kunstleve R. W., Adams P. D. (2009) Electronic Ligand Builder and Optimization Workbench (eLBOW). A tool for ligand coordinate and restraint generation. Acta Crystallogr. D Biol. Crystallogr. 65, 1074–1080 [DOI] [PMC free article] [PubMed] [Google Scholar]
- 35. Adams P. D., Afonine P. V., Bunkóczi G., Chen V. B., Davis I. W., Echols N., Headd J. J., Hung L. W., Kapral G. J., Grosse-Kunstleve R. W., McCoy A. J., Moriarty N. W., Oeffner R., Read R. J., Richardson D. C., Richardson J. S., Terwilliger T. C., Zwart P. H. (2010) PHENIX. A comprehensive Python-based system for macromolecular structure solution. Acta Crystallogr. D Biol. Crystallogr. 66, 213–221 [DOI] [PMC free article] [PubMed] [Google Scholar]
- 36. Emsley P., Lohkamp B., Scott W. G., Cowtan K. (2010) Features and development of Coot. Acta Crystallogr. D Biol. Crystallogr. 66, 486–501 [DOI] [PMC free article] [PubMed] [Google Scholar]
- 37. Hayward S., Berendsen H. J. (1998) Systematic analysis of domain motions in proteins from conformational change. New results on citrate synthase and T4 lysozyme. Proteins 30, 144–154 [PubMed] [Google Scholar]
- 38. Kvist T., Greenwood J. R., Hansen K. B., Traynelis S. F., Bräuner-Osborne H. (2013) Structure-based discovery of antagonists for GluN3-containing N-methyl-d-asparate receptors. Neuropharmacology 75, 324–336 [DOI] [PMC free article] [PubMed] [Google Scholar]
- 39. Chatterton J. E., Awobuluyi M., Premkumar L. S., Takahashi H., Talantova M., Shin Y., Cui J., Tu S., Sevarino K. A., Nakanishi N., Tong G., Lipton S. A., Zhang D. (2002) Excitatory glycine receptors containing the NR3 family of NMDA receptor subunits. Nature 415, 793–798 [DOI] [PubMed] [Google Scholar]
- 40. Nilsson A., Duan J., Mo-Boquist L. L., Benedikz E., Sundström E. (2007) Characterisation of the human NMDA receptor subunit NR3A glycine binding site. Neuropharmacology 52, 1151–1159 [DOI] [PubMed] [Google Scholar]
- 41. Awobuluyi M., Yang J., Ye Y., Chatterton J. E., Godzik A., Lipton S. A., Zhang D. (2007) Subunit-specific roles of glycine-binding domains in activation of NR1/NR3 N-methyl-d-asparate receptors. Mol. Pharmacol. 71, 112–122 [DOI] [PubMed] [Google Scholar]
- 42. Madry C., Mesic I., Bartholomäus I., Nicke A., Betz H., Laube B. (2007) Principal role of NR3 subunits in NR1/NR3 excitatory glycine receptor function. Biochem. Biophys. Res. Commun. 354, 102–108 [DOI] [PubMed] [Google Scholar]
- 43. Kasper C., Pickering D. S., Mirza O., Olsen L., Kristensen A. S., Greenwood J. R., Liljefors T., Schousboe A., Wätjen F., Gajhede M., Sigurskjold B. W., Kastrup J. S. (2006) The structure of a mixed GluR2 ligand-binding core dimer in complex with (S)-glutamate and the antagonist (S)-NS1209. J. Mol. Biol. 357, 1184–1201 [DOI] [PubMed] [Google Scholar]
- 44. Hess S. D., Daggett L. P., Deal C., Lu C. C., Johnson E. C., Veliçelebi G. (1998) Functional characterization of human N-methyl-d-asparate subtype 1A/2D receptors. J. Neurochem. 70, 1269–1279 [DOI] [PubMed] [Google Scholar]
- 45. Laskowski R. A., MacArthur M. W., Moss D. S., Thornton J. M. (1993) PROCHECK. A program to check the stereochemical quality of protein structures. J. Appl. Crystallogr. 26, 283–291 [Google Scholar]