

Background: Pyruvate kinase M2 controls glycolytic efflux.
Results: Novel FRET sensors report PKM2 structural changes in response to activation by metabolites and phosphorylation events in pancreatic β-cells.
Conclusion: PKM2 activity is oscillatory and synchronized between islet β-cells.
Significance: This approach is broadly applicable for measuring pyruvate kinase M2 activity in living cells.
Keywords: Beta Cell, Flavin, Fluorescence Resonance Energy Transfer (FRET), Glycolysis, Mitochondrial Metabolism, NADH, Pancreatic Islets
Abstract
Pulses of insulin released from pancreatic β-cells maintain blood glucose in a narrow range, although the source of these pulses is unclear. We and others have proposed that positive feedback mediated by the glycolytic enzyme phosphofructokinase-1 (PFK1) enables β-cells to generate metabolic oscillations via autocatalytic activation by its product fructose 1,6-bisphosphate (FBP). Although much indirect evidence has accumulated in favor of this hypothesis, a direct measurement of oscillating glycolytic intermediates has been lacking. To probe glycolysis directly, we engineered a family of inter- and intramolecular FRET biosensors based on the glycolytic enzyme pyruvate kinase M2 (PKAR; pyruvate kinase activity reporter), which multimerizes and is activated upon binding FBP. When introduced into Min6 β-cells, PKAR FRET efficiency increased rapidly in response to glucose. Importantly, however, metabolites entering downstream of PFK1 (glyceraldehyde, pyruvate, and ketoisocaproate) failed to activate PKAR, consistent with sensor activation by FBP; the dependence of PKAR on FBP was further confirmed using purified sensor in vitro. Using a novel imaging modality for monitoring mitochondrial flavin fluorescence in mouse islets, we show that slow oscillations in mitochondrial redox potential stimulated by 10 mm glucose are in phase with glycolytic efflux through PKM2, measured simultaneously from neighboring islet β-cells expressing PKAR. These results indicate that PKM2 activity in β-cells is oscillatory and are consistent with pulsatile PFK1 being the mediator of slow glycolytic oscillations.
Introduction
Pulses of insulin secreted from pancreatic β-cells help maintain plasma glucose within a narrow range. These oscillations are more effective than continuous insulin in restraining hepatic glucose production (1–3) and are lost in Type 2 diabetics (4, 5). Many of the upstream factors that control insulin release are themselves oscillatory, including NAD(P)H, O2 consumption, membrane potential, Ca2+, and ATP (6–9). An outstanding question, then, is where are these oscillations generated?
Pioneering studies of yeast metabolism performed by Betz and Chance (10) led to the discovery that slow oscillations are generated by glycolytic phosphofructokinase-1 (PFK1)2 via the autocatalytic activation of the enzyme by its product, fructose 1,6-bisphosphate (FBP) (11, 12). Several studies suggest that this mechanism, which is also present in muscle (13–15), may also be operational in the β-cell (16). For example, oscillations have been observed in intraislet glucose (7, 17). Second, downstream oscillations in islet Ca2+ are driven by glucose but not substrates entering metabolism downstream of PFK1 (18), and the frequency of islet Ca2+ oscillations is modulated by the activity of PFK2/FBPase2 (phosphofructo-2-kinase/fructose-2,6-bisphosphatase) (19). In addition, slow oscillations are intrinsic to metabolism, as oscillations in NAD(P)H and O2 can be shown to persist in the absence of islet Ca2+ oscillations (20, 21). Some of these studies (19, 21) were motivated by a model in which metabolic oscillations are driven by oscillations in glycolysis (22), and the experiments confirmed predictions made by the model. However, alternate theories for islet metabolic oscillations have been proposed by other workers in the field (23–27), and oscillations in glycolytic intermediates have not been directly measured.
A key effector of glycolytic FBP is pyruvate kinase M2 (PKM2), which utilizes ADP and phosphoenolpyruvate to produce ATP and pyruvate in the final step in glycolysis. Of the four human PK isoforms (M1, M2, L, and R), all are active as tetramers. PKM1 is constitutively active, whereas L-, R-, and M2 are allosterically activated by FBP (28). PKM2 is expressed in β-cells (29, 30), where it is the most abundant glycolytic enzyme (31). Unlike the other isoforms, the catalytic activity of PKM2 is directly linked to the enzyme's quaternary structure; tetrameric PKM2 has high catalytic activity, whereas monomeric and dimeric PKM2 have low catalytic activity (32, 33). The highly active tetrameric state of PKM2 is primarily increased in proportion to allosteric activation by FBP (34, 35) such that in its absence PKM2 is catalytically inactive at any physiological concentration of phosphoenolpyruvate (32). FBP can also overcome the inhibition by allosteric inhibitors of PKM2 such as phenylalanine and other amino acids (36, 37).
To determine whether glycolytic oscillations occur in β-cells, we designed a family of genetically encoded FRET biosensors to measure PKM2 oligomerization in living cells as a direct monitor of allosteric regulation by FBP and activity. We reasoned that if PFK1-mediated oscillations in FBP occur in response to glucose stimulation, then these should in turn trigger cycles of PKM2 activity as FBP induces tetramerization and concomitant FRET activity. We also introduce two new imaging modalities to measure mitochondrial flavin fluorescence, a high throughput and a high sensitivity measurement, with the latter being capable of resolving even small high frequency oscillations superimposed upon slower mitochondrial redox oscillations. Using these techniques in combination, we demonstrate that islet PKM2 activity is not only oscillatory but is also synchronized between the β-cells of an islet and in phase with mitochondrial redox potential.
EXPERIMENTAL PROCEDURES
Cloning
Human PKM2 and PKM1 were cloned from a cDNA library (Invitrogen) into pENTR-DS (SalI/XhoI) using the In-Fusion cloning system (Clontech). ClonaseII/Gateway (Invitrogen) was then used to transfer full-length PKM2 into acceptor vectors containing monomeric pH-insensitive variants of GFP (pD-CeruleanN, pD-CitrineN, pD-CeruleanC, pD-CitrineC) (19), yielding the single-chain pyruvate kinase activity reporter (PKAR) constructs (pG-Cerulean-PKM2, pG-Citrine-PKM2, pG-PKM2-Cerulean, pG-PKM2-Citrine). Finally, the multichain PKARs (pG-Cerulean-PKM2-Citrine, pG-Citrine-PKM2-Cerulean) were constructed by adding an N-terminal (HindIII/KpnI digest) or C-terminal (SacII/AgeI digest) fluorophore using the In-Fusion cloning system; substitution of circularly permuted Cerulean3 (cpCerulean3), yielding pG-Citrine-PKM2-cpCerulean3 and pG-cpCerulean3-PKM2-Citrine, was performed using the same sites. The linker regions of PKAR were initially formed from the attB sites inherent to the Gateway system and were modified as described in Table 1 using PCR mutagenesis. For yeast expression, Citrine-PKM2-cpCerulean3 was subcloned into NdeI/XhoI of pGADT7-myc (Clontech), yielding pGAD-T7-myc-Citrine-PKM2-cpCerulean3. For expression in pancreatic islet β-cells, myc-Citrine-PKM2-cpCerulean3 was cloned downstream of the rat insulin promoter and rabbit β-globin1 intron (RIP-BGI) (38), and ClonaseII was used to prepare the full-length adenoviral construct in pAd-PL/DEST (Invitrogen), yielding pAd-PL-RIP1-myc-Citrine-PKM2-cpCerulean3-TKpA. The University of Michigan Vector Core produced high titer adenovirus. The sequence fidelity of all constructs was verified by the University of Michigan DNA Sequencing Core.
TABLE 1.
Effect of linker length on PKAR dynamic range
Linker amino acid composition is: 5, lsrat; 7, gtgggas; 28, sgtlvklstslykkagfkgtnsvdrtsaa; 22, lsryldpaflykvvdlegprat. Data are unpaired t test of 2.5 G vs. 25 G.
| %E, 2.5 G | %E, 25 G | Δ | % | |
|---|---|---|---|---|
| Multi-chain PKAR | ||||
| Cer-28-PKM2/Cit-28-PKM2 (1.0) | 9.3 ± 0.2 (n = 75) | 10.5 ± 0.3 (n = 61) | 1.2 | 12.9%a |
| Cer-7-PKM2/Cit-7-PKM2 (1.0ΔN) | 7.6 ± 0.4 (n = 22) | 9.3 ± 0.7 (n = 22) | 1.7 | 22.4%b |
| PKM2–22-Cer/PKM2–22-Cit (1.1) | 7.7 ± 0.2 (n = 55) | 8.2 ± 0.2 (n = 50) | 0.5 | 6.5%b |
| PKM2–5-Cer/PKM2–5-Cit (1.1ΔC) | 7.8 ± 0.2 (n = 21) | 7.5 ± 0.2 (n = 23) | −0.3 | −4.8% |
| Cer-28-PKM2/PKM2–22-Cit (1.2) | 8.8 ± 0.3 (n = 84) | 11.0 ± 0.4 (n = 76) | 2.2 | 25.0%c |
| Cer-7-PKM2/PKM2–22-Cit (1.2ΔN) | 6.5 ± 0.3 (n = 12) | 8.5 ± 0.4 (n = 18) | 2.0 | 30.7%c |
| Single-chain PKAR | ||||
| Cit-28-PKM2–22-Cer (2.0) | 25.1 ± 0.3 (n = 68) | 27.3 ± 0.4 (n = 77) | 2.2 | 8.7%c |
| Cit-7-PKM2–22-Cer (2.0ΔN) | 28.6 ± 0.5 (n = 27) | 31.8 ± 0.6 (n = 27) | 3.2 | 11.1%c |
| Cit-28-PKM2–5-Cer (2.0ΔC) | 32.6 ± 0.5 (n = 27) | 33.9 ± 0.6 (n = 31) | 1.3 | 4.0% |
| Cit-7-PKM2–5-Cer (2.0ΔNΔC) | 36.4 ± 0.4 (n = 76) | 37.4 ± 0.4 (n = 76) | 1.0 | 3.0% |
a , p < 0.01;
b, p < 0.05;
c, p < 0.0001.
Culture and Adenoviral Infection of Mouse Islets
Experiments were carried out using male Swiss-Webster mice (25–30 g) from Charles River (Wilmington, MA). Mice were sacrificed by cervical dislocation according to the regulations of the University of Michigan Committee on the Use and Care of Animals, who approved this study (protocol 10147). Islets were isolated from the pancreas (21) and cultured overnight in RPMI1640 supplemented with 10% (v/v) fetal bovine serum (FBS), 100 units/ml penicillin, and 100 μg/ml streptomycin (Invitrogen). Groups of 25 freshly isolated islets were immediately infected with 2000 multiplicity of infection of adenovirus for 1.5 h in a 95/5% air/CO2 incubator at 37 °C followed by fresh culture media lacking virus. Imaging was performed 2–3 days after infection.
NAD(P)H/Flavin and Fura2 Imaging of Islets
For NAD(P)H/flavin (365/430 nm excitation) or Fura2 (340/380 nm excitation) imaging, excitation from a Polychrome V monochrometer (Till Photonics) was passed through a 430HSP exciter (Omega), 458LP dichroic (Semrock), and D500/100m emitter (Chroma) mounted in an IX71 microscope (Olympus) equipped with a 0.3 NA UPlanFL 10× objective. For measurements of intracellular Ca2+, islets were preloaded with 2.5 μm Fura2-AM (Molecular Probes) in 0.1% (v/v) DMSO for 30 min at 37 °C and washed for 10 min before recording; Ca2+ is reported as the emission ratio R340/380. The recording solution contained 145 mm NaCl, 5 mm KCl, 1.2 mm MgCl2, 2.6 mm CaCl2, 10 mm HEPES and glucose as indicated, pH 7.4, 310 milliosmolar. Exposure times were 50–150 ms at 0.2 Hz, the excitation bandwidth was 15 nm (FWHM), the camera's (QuantEM, Photometrics) and electron multiplication gain was 100–200, controlled with MetaFluor software (Molecular Devices).
Stoichiometric FRET Imaging and Calculation of FRET Efficiency
Min6 cells (39) were cultured in DMEM, 15% (v/v) FBS, 285 μm β-mercaptoethanol, 100 unit/ml penicillin, and 100 μg/ml streptomycin and kept at 37 °C under 5% CO2. FRET studies in Min6 cells were performed using a 1.4 NA UPlanSApo 100X oil immersion objective (Olympus). For these experiments, 436-nm (Cerulean or cpCerulean3) and 500-nm (Citrine) excitation was passed through a dual pass excitation filter (430/24; 500/20) and polychroic mirror (89006bs, Chroma, Brattleboro, VT), and emission was passed through a DualView2 beamsplitter (Photometrics) containing a dichroic mirror (T495LPXR) and emission filters (ET470/24m and ET535/30m) (Chroma) to allow simultaneous two-channel monitoring of donor and acceptor emission. All analyses of acquired images were performed using Metamorph/MetaFluor (Molecular Devices). A linked Cerulean-Citrine reference construct of known FRET efficiency (0.3014) (40) was used for calibration in each experiment. Cells expressing Cerulean or Citrine alone were used to generate correction constants for cross-talk (α) and spectral bleed-through (β). The apparent efficiency of acceptor (Citrine) in complex (EA), the apparent efficiency of donor (Cerulean or cpCerulean3) in complex (ED), and the mole fraction of acceptor to donor (ratio) values were determined using the following equations: EA = γ[((DA − βDD)/αAA) − 1](1/EC); ED = [1 − (DD/((DA − αAA − βDD)(ξ/γ) + DD))](1/EC), ratio = (ξ/γ2)[αAA/((DA − αAA − βDD)(ξ/γ) + DD)], where DD is donor excitation-donor emission. DA is donor excitation-acceptor emission, AA is acceptor excitation-acceptor emission, and EC is characteristic efficiency (0.3014). For multichain biosensors we report %E as (EA + ED)/2; in the single-chain biosensors, EA = ED.
Ratiometric FRET and Flavin Imaging in Mouse Islets
The filter sets used were identical to those used for the calculation of FRET efficiency. In this case, 436-nm excitation was passed through a 1.2 NA UPlanSApo 60× water immersion objective, and emission was collected as the ratio of the ET535/30m and ET470/24m channels (R535/470). Camera electron multiplication was turned off to reduce multiplicative noise. A 40% neutral density filter in the ET535/30m emission channel compensated for the 2.5-fold brightness of Citrine relative to Cerulean. In cases where flavin fluorescence was recorded without a FRET probe present, R470/535 was reported because this ratio is directly proportional to the cellular redox potential.
Simultaneous NAD(P)H and PKAR Imaging in Yeast
Saccharomyces cerevisiae (LS41), containing pGADT7-myc or pGADT7-myc-PKAR2.3 were grown under semi-aerobic conditions at 30 °C on a rotary shaker in media containing 1.7 g liter−1 yeast nitrogen base, 5 g liter−1 ammonium sulfate, 2% glucose (w/v), and 2 g of yeast dropout base (−Leu). At A660 = 2 the cells were harvested by centrifugation, washed twice with PBS pH 7.4, starved by incubating at 30 °C for 3 h, and stored on ice (A660 = 2) until use. Oscillations were induced by adding 30 mm glucose to the starved cells and after 4 min adding 5 mm KCN (11). Imaging of NAD(P)H and PKAR was performed immediately by pipetting 2 ml of diluted yeast suspension into a 35-mm glass bottom chamber (World Precision Instruments). These experiments employed a 1.2 NA UPlanSApo 60× water immersion objective. Alternating 365-nm (NAD(P)H) and 430-nm (PKAR FRET) light was passed through a 430HSP exciter (Omega Optical) and a 458LP dichroic mirror (Semrock); FRET was collected as the ratio of the ET535/30m and ET470/24m channels (R535/470), and NAD(P)H emission was collected in the ET470/24m channel of the DualView2.
Biochemistry
Immunoprecipitation of PKM2 was carried out as in Anastasiou et al. (41), except that FRET imaging was used in place of the Western blot. HEK293T cells were transiently transfected with pC-myc-PKAR2.3 and pC-PKAR2.3 or reference constructs for calculation of FRET efficiency (pC-myc-Cerulean, pC-myc-Citrine, or pC-myc-Cerulean-Citrine). After 2 days expression, the cells were rinsed twice in PBS, scraped into PK lysis buffer (50 mm Tris, pH 7.5, 150 mm NaCl, 1 mm EDTA, 1% Igepal CA630, and Roche Complete Protease Inhibitors) and lysed with 10 sonicating pulses (1 s−1, 0.5 Hz). Lysates were placed on ice for 30 min and then centrifuged for 10 min at 18,000 × g at 4 °C. Supernatants were pooled, at which time rabbit antibodies to myc (ICL) and protein A-agarose beads (Invitrogen) were added, and the samples were re-divided for treatment with either vehicle, 200 μm FBP, or 10 mm serine. After overnight incubation at 4 °C, samples were washed 3 times with PK lysis buffer and once in PK assay buffer (50 mm Tris, pH 7.5, 100 mm KCl, 5 mm MgCl2, Roche Complete EDTA-free protease inhibitors, and vehicle, FBP, or serine) before imaging the beads using a 0.7 NA 20× water objective and the FRET filter sets described above. The extent of PKAR-PKAR oligomerization (Binding) was calculated as the normalized fluorescence intensity in response to direct excitation of Citrine (500 nm), which is unaffected by FRET. FRET Efficiency was calculated from the images, as described above.
RESULTS
Multi- and Single-chain FRET Biosensors Engineered from Human PKM2 (PKARs)
The structure of PKM2 is directly linked to its catalytic activity; tetrameric PKM2 is highly active, whereas the dimeric or monomeric forms are inactive at any physiological concentration of phosphoenolpyruvate (32). The design principle of PKAR takes advantage of this structural requirement for catalysis. As depicted in Fig. 1A, multichain PKARs consist of PKM2 monomers labeled with either Cerulean or Citrine. Upon activation by FBP, dimers of PKM2 tetramerize, bringing their fluorophores within close proximity and thereby increasing FRET. It is important to note that dimeric and tetrameric sensors contain a mixture of probe combinations; donor-acceptor combinations are ideal, donor-donor and acceptor-acceptor interactions are not measurable, and donors that interact with multiple acceptors yield surplus energy transfer (42). Therefore, the average change in FRET for all possible combinations is measured. Homology modeling of the apo and FBP-bound PKM2 crystal structures (43) indicates negligible movement of the subunits relative to each other (Fig. 1B) such that multimerization rather than fluorophore orientation would be expected to dominate the FRET change.
FIGURE 1.
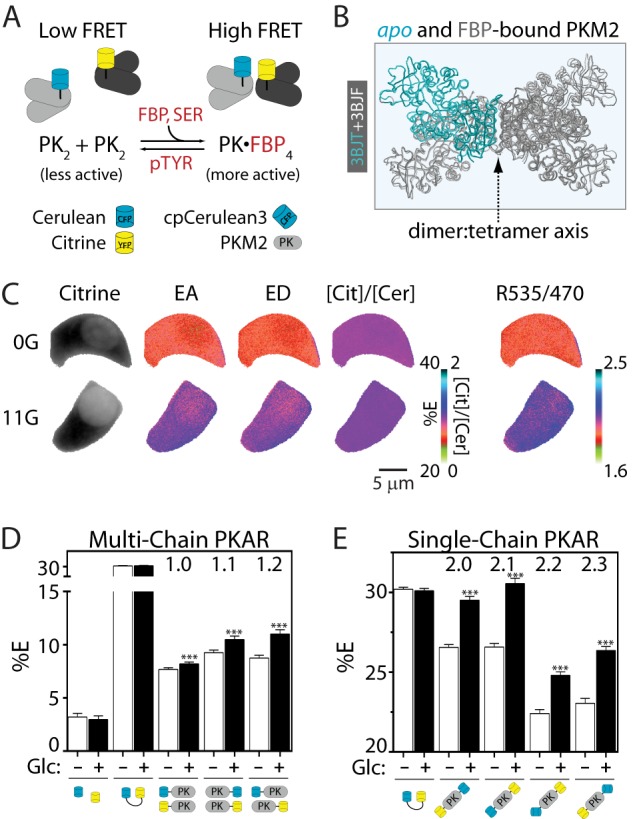
PKARs exhibit glucose-dependent changes in FRET. A, simplified schematic of PKAR activation by FBP and serine (SER) and inactivation by tyrosine phosphorylation and phosphotyrosine peptide binding (pTYR). Note that although the ideal case is pictured, tetrameric complexes formed by the association of PK dimers (PK2) are likely to contain more than one FRET donor or acceptor; FRET efficiencies, therefore, reflect the average of all possible probe combinations. B, overlay of the apo (light gray with one aqua PKM2 monomer) and FBP-bound (dark gray) PKM2 crystal structures showing the dimer:tetramer axis. C, Min6 cells expressing PKAR2.1 were glucose-starved (0G) or treated with 11 mm glucose (11G) to illustrate probe localization and calculation of FRET efficiencies by “stoichiometry” (EA, FRET efficiency of acceptor in complex; ED, FRET efficiency of donor in complex; [Cit]/[Cer], the mole fraction of acceptor to donor) and by the FRET/Cerulean emission ratio (R535/470). D and E, average PKAR FRET efficiency (%E) in Min6 cells ±25 mm glucose (Glc) for multi-chain (D) or single-chain (E) PKAR. %E = (EA+ED)/2; for the single-chain biosensors, EA = ED. Error bars represent the mean ± S.E., n ≥ 20 cells per treatment from ≥6 independent experiments. Analysis of variance with Bonferroni post-test: **, p < 0.01; ***, p < 0.0001.
We evaluated the dynamic range of the PKAR sensors in situ by measuring glucose-dependent changes in FRET efficiency (40) in Min6 cells (Fig. 1C), an insulin-secreting cell line derived from mouse pancreatic β-cells. In these cells, FBP, which is not transported into the cell, is produced in direct proportion to extracellular glucose (39). Our protocol was to expose populations of Min6 cells expressing versions of PKAR to low (0 mm) or high (25 mm) glucose for ≥1 h and then measure their corresponding FRET signals (Figs. 1, D and E). Cells expressing unlinked Cerulean and Citrine showed low levels of FRET that were glucose-insensitive. Multi-chain PKARs, in which the fluorophores are attached to separate PKM2 monomers, showed significant glucose-dependent FRET regardless of whether their donor or acceptor moieties were placed on their N or C termini, but the base line and degree of glucose-dependent change in FRET was altered (Fig. 1D). Compared with the multi-chain PKARs, single-chain PKARs (Fig. 1E) exhibited comparable dynamic range and are advantageous because PKM2 activation, quantified as FRET efficiency, is in this case directly proportional to the FRET/Cerulean emission ratio (R535/470). In addition to the ratiometric FRET approach, we also tested whether anisotropic FRET measurements (44) could improve the dynamic range of the probe; although they did not, we confirmed the glucose sensitivity of PKAR 2.1 and 2.3 in INS1 cells using this alternative method (data not shown).
In single- or multi-chain PKARs, shortening the C-terminal linker from 22 to 5 residues eliminated PKAR glucose responsiveness (Table 1) most likely by disrupting the adjacent FBP binding site. Shortening the N-terminal linker, however, improved the dynamic range by >20% for both single- and multi-chain PKARs. Although these manipulations provide a starting point for improving PKAR sensitivity, we found it comparable to replace Cerulean with a circularly permuted version of Cerulean3 (cpCerulean3) in single-chain PKAR (2.2 and 2.3). This was expected given the reported improvement in photostability of Cerulean3 (45).
FBP Activation Increases PKAR Oligomerization and FRET
To determine whether allosteric activation of PKAR by FBP is sufficient to activate the probe, we studied the sensor in vitro. As an additional validation, we also tested the sensor response to serine, a low affinity activator of PKM2 (46). We adapted a standard co-immunoprecipitation assay for PKM2 oligomerization (41) to allow us to simultaneously quantify PKAR oligomerization and FRET (Fig. 2A). We measured the association of myc-tagged PKAR2.3 with PKAR2.3 (lacking a myc tag) in response to 200 μm FBP or 10 mm serine. Because of the respective affinities of FBP and serine for PKM2 (0.1–0.4 and ∼2 mm, respectively) (46), we observed equivalent increases in PKAR-PKAR binding and, most importantly, changes in FRET efficiency that were comparable to the changes we observed in live cells (cf. Fig. 1E). As expected, FBP and serine appear to induce distinct conformations of PKM2 that change the donor-acceptor probe orientation(s) and in turn affect FRET efficiency. In summary, changes in PKAR oligomerization lead directly to changes in PKAR FRET.
FIGURE 2.
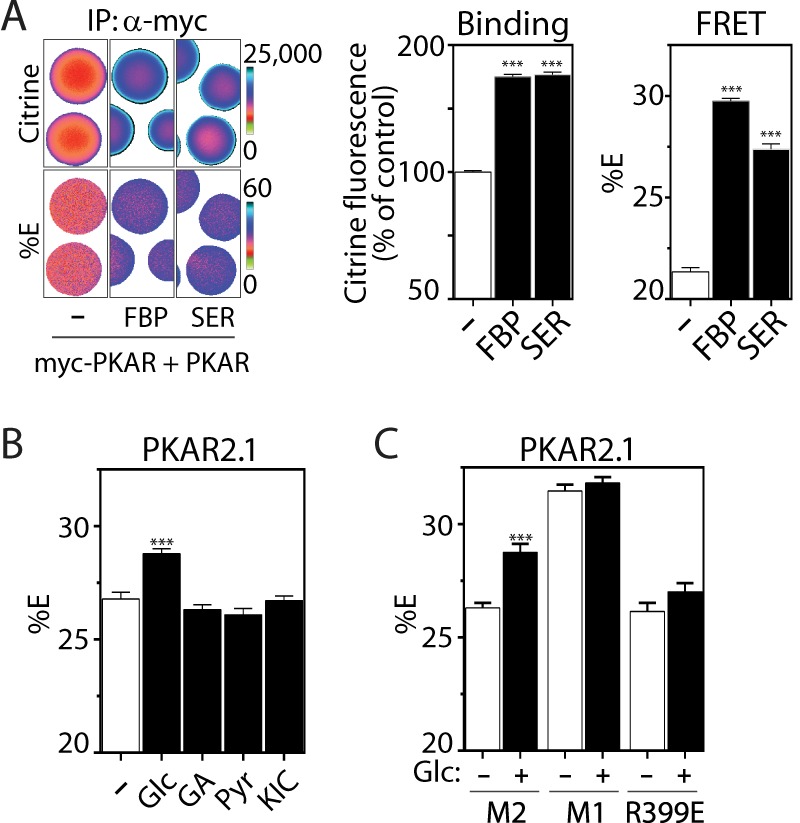
FBP-induced oligomerization of PKM2 activates PKAR FRET. A, coimmunoprecipitation (IP) of PKAR2.3 with myc-PKAR2.3 immobilized on myc antibody-conjugated agarose beads in the absence or presence of 200 μm FBP or 10 mm serine. Binding (middle panel) is quantified as Citrine fluorescence excited at 500 nm, which reports on PKAR concentration independently of FRET. FRET efficiencies (right panel) were calculated as in Fig. 1. n ≥ 50 beads per treatment from 2 independent experiments. B, average PKAR FRET response to 11 mm glucose (Glc), glyceraldehyde (GA), pyruvate (Pyr), or the mitochondrial fuel ketoisocaproate (KIC) in Min6 cells. C, PKAR FRET efficiency in Min6 cells expressing PKAR2.1 (M2) or mutants in which PKM2 was replaced by the tetrameric PKM1 isoform (M1) or the dimeric PKM2 mutant R399E, shown ±25 mm Glc as indicated. n ≥ 50 cells per treatment from ≥3 independent experiments. Error bars in all panels represent the mean ± S.E., analysis of variance with Bonferroni post-test: ***, p < 0.0001.
Several in situ assays further corroborate that the glucose-dependent changes in PKAR we observed arise because of FBP-dependent oligomerization. First, in contrast to glucose, substrates that enter metabolism downstream of PFK1 (i.e. downstream of FBP production) failed to activate PKAR2.1 (Fig. 2B) or PKAR2.3 (data not shown). Second, irrespective of glucose concentration, PKAR FRET was higher when PKM2 was replaced by PKM1 (Fig. 2C), an alternatively spliced isoform of the Pkm gene that imparts a constitutively active tetrameric structure (32). Finally, glucose was unable to activate PKAR-R399E, a constitutively dimeric point mutant of PKM2 (33).
Tyrosine Phosphorylation Inhibits PKM2 Activity in β-Cells
Although FBP allosterically activates PKM2, its tetrameric activity is known to be fine-tuned through interactions with other proteins and metabolites (32). Two of the major mechanisms of PKM2 inhibition, at least in actively proliferating cells (43, 47), are tyrosine phosphorylation of PKM2 itself and the binding of phosphotyrosine-containing peptides by PKM2. Both mechanisms are reported to displace FBP and thus shift the oligomerization state of PKM2 away from the enzymatically active tetrameric form. However, it is not currently known if these processes are active in pancreatic β-cells.
To test this possibility we evaluated three PKM2 mutants that block 1) tyrosine phosphorylation of PKM2 (Y105F) (47), 2) PKM2 binding to endogenous phosphotyrosine peptides (K433E) (43), or 3) the ability of FBP to displace phosphotyrosine peptides (S437Y) (48). All three mutants decreased PKAR activation by glucose by ≥50% (Fig. 3), indicating that each of these mechanisms is active in Min6 β-cells. In summary, we have established that PKAR responds appropriately to both activating and deactivating processes that are known to affect PKM2 activity, and we established their contribution to the sensor dynamic range in situ.
FIGURE 3.
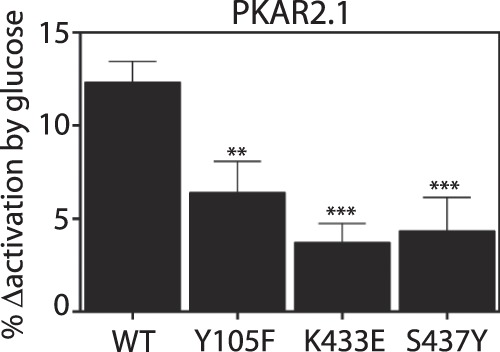
PKAR response to glucose is altered by tyrosine kinases in Min6 cells. Effect of PKAR mutations that disrupt PKM2 inactivation by tyrosine kinases, quantified as % change in FRET activation from 0 to 25 mm glucose. Y105F blocks tyrosine phosphorylation of PKM2 (47), K433E blocks phosphotyrosine peptide binding by PKM2 (43), and S437Y blocks the ability of PKM2 to displace phosphotyrosine peptides (48). Error bars in all panels represent the mean ± S.E., n ≥ 33 cells per treatment from ≥2 independent experiments. Analysis of variance with Bonferroni post-test: **, p < 0.01; ***, p < 0.0001.
Glycolytic Oscillations in S. cerevisiae Detected with PKAR
Our ultimate motivation in constructing PKAR was to test for and evaluate glycolytic oscillations in β-cells, which we have hypothesized are dependent on oscillating FBP levels (49). Therefore, we first assessed the temporal dynamics of PKAR activation in yeast, one of the best studied examples of pulsatile metabolism at the single cell level and one in which the underlying oscillatory mechanism is strongly dependent on the kinetic properties of PFK1 (50). We monitored endogenous glycolytic oscillations in a yeast suspension using optical measurements of endogenous NAD(P)H together with the activity of PKAR, which was expressed in a subset of the cells (Fig. 4). Glycolytic oscillations were induced by administering 30 mm glucose and 5 mm KCN to starved yeast cells; cyanide blocks the cytochrome c oxidase/complex IV and further ensures that the observed oscillations are glycolytic in origin. Under these conditions robust oscillations in PKAR (period 59 ± 1 s, n = 10) were observed that lagged NAD(P)H oscillations by 30 ± 1 s (by cross-correlation analysis) throughout 30 limit cycles. Importantly, yeast lacking PKAR but present in the same field of view never exhibited oscillations in R535/470 (e.g. regions 1 and 2 in Fig. 4B), although out of focus yeast settling on the cover glass frequently interrupted these traces (supplemental Movie 1). This assay confirms that PKAR is sensitive to time-resolved changes in glycolytic metabolism and that PKAR activation and deactivation kinetics are appropriate for detecting oscillating metabolite concentrations.
FIGURE 4.
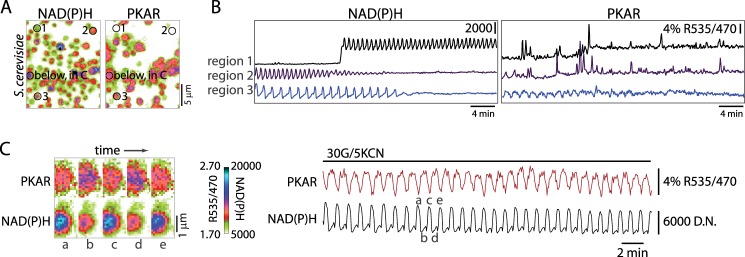
PKAR detects glycolytic oscillations in yeast. A, imaging of NAD(P)H fluorescence and PKAR FRET in a yeast suspension containing 30 mm glucose and 5 mm KCN. Image pairs were taken every 4 s. Example traces (B) are shown for control cells lacking sensor (regions 1 and 2) in the same field as those expressing myc-PKAR2.3 (region 3). C, one region encompassing a PKAR-positive cell in A is shown on an expanded scale to highlight the differences in the PKAR and NAD(P)H waveforms. D.N., digital numbers.
PKM2 Activity Is Oscillatory in β-Cells
In contrast to yeast, it has remained unclear whether FBP levels oscillate in β-cells during glycolysis. In this context the FRET method for monitoring the kinetic properties of glycolytic activity offers a significant advantage over standard biochemical measurements, as β-cells are not homogenous or abundant in pancreatic tissue.
Initially, we transiently transfected PKAR2.3 into Min6 cells. When glucose was raised from 2 to 25 mm, PKAR FRET rapidly increased, reaching a plateau within 55 ± 3 s (n = 8) on average (Fig. 5A, left). When Min6 cells were stimulated with the further addition of 10 mm tetraethylammonium, a K+ channel blocker, oscillations in PKAR activity were evident as ratiometric FRET changes in a subset of cells (5 out of 18 cells) (Fig. 5A, right).
FIGURE 5.
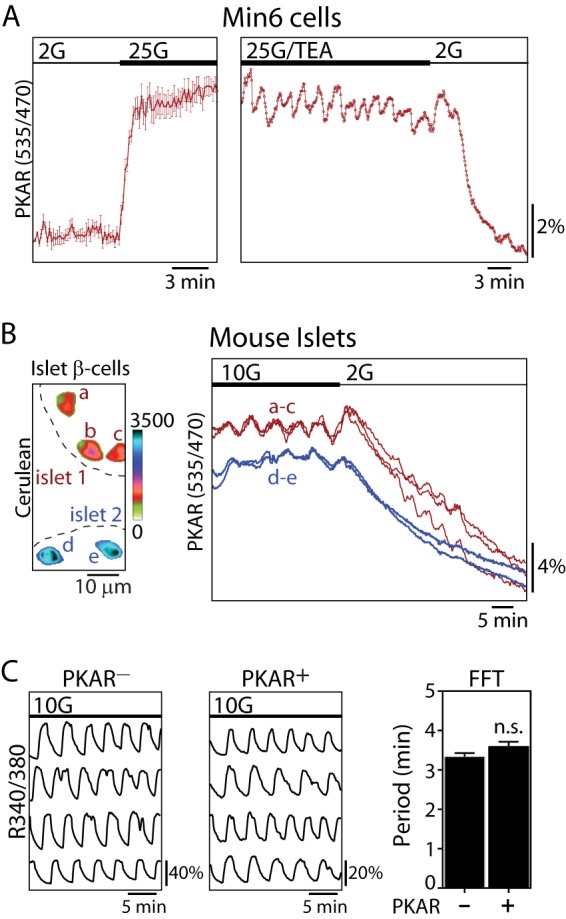
PKM2 activity is oscillatory in Min6 cells and mouse islet β-cells. A, time-resolved change in PKAR FRET (mean ± S.E., n = 8) in response to glucose elevation (2–25 mm) in Min6 cells; traces were normalized to the initial FRET/Cerulean ratio (left). A representative trace shows oscillations in PKAR FRET induced by 25 mm glucose and 10 mm tetraethylammonium (25G/TEA) (right). Sampling interval = 10 s. B, time-lapse imaging of PKAR2.3, expressed in β-cells under control of the rat insulin promoter in two mouse islets perfused with 10 and 2 mm glucose. Cerulean images (left) show the location of β-cells expressing PKAR2.3; the color bar reflects Cerulean fluorescence intensity. C, representative traces showing intracellular Ca2+ oscillations naïve islets (n = 25) or islets treated with adenovirus carrying PKAR (n = 29) as indicated. The average oscillatory period (mean ± S.E.) was quantified by fast Fourier transform (FFT) from >20 min of recording. No significant difference in period were found by an unpaired t test. n.s., not significant.
Next we used adenovirus to express PKAR in mouse islets using the rat insulin promoter to restrict expression to the β-cells (38). In this case we routinely observed synchronous glycolytic oscillations between individual β-cells of the same islet stimulated by 10 mm glucose (Fig. 5B). The oscillations were terminated after reducing the glucose concentration to 2 mm. On average, R535/470 changed from 2.75 ± 0.02 in 10 mm glucose (n = 93) to 2.16 ± 0.02 in 2 mm glucose (n = 70), a 22% decrease (unpaired t test, p < 0.0001). The presence of glycolytic oscillations in PKM2 activity implies that PFK1 can induce oscillations in PKM2 activity both by 1) inducing oscillations in substrate flow to the enzyme as well as 2) direct allosteric activation by FBP, although only the latter affects the PKM2 tetramerization state and would be detectable with PKAR. The average oscillatory period, 6.3 ± 0.5 min (n = 30), was similar to what we and others have observed for downstream oscillations of NAD(P)H, Ca2+, and insulin in mouse islets (8, 21). Although islet β-cell Ca2+ oscillations are electrically synchronized by gap junctions (51) and metabolically synchronized at the mitochondria (8), these results make it clear that this coupling extends to glycolytic oscillations.
In a previous study we overexpressed the glycolytic regulator PFK2/FBPase2 (phosphofructo-2-kinase/fructose-2,6-bisphosphatase) to alter islet oscillatory activity and reported that this affected both the period and the amplitude of downstream Ca2+ oscillations (19). Therefore, we questioned whether expression of PKAR, which contains full-length PKM2, could affect downstream oscillations in Ca2+ using Fura2-loaded islets. Although the strong cross-excitation of Cerulean by the 380-nm light used to excite Ca2+-free Fura2 prohibited accurate quantification of the absolute Ca2+ level and oscillation amplitudes in the PKAR-expressing islets, the period of slow Ca2+ oscillations was unaffected by the expression of PKAR (Fig. 5C). Therefore, PKAR does not appear to disturb the endogenous metabolic oscillations of islets.
Optical Measurements of Islet Redox Potential
To ascertain the kinetic relationship between PKM2 activity and mitochondrial metabolism in β-cells, we measured endogenous NAD(P)H (8, 21, 52–54) and flavin fluorescence, two methods previously used to assess metabolic activity of cells (54, 55). The fluorescence from NAD(P)H is a combination of cellular NADH and NADPH fluorescence, produced in both the cytosolic and mitochondrial compartments. NAD(P)H is strongly fluorescent in its reduced state (λex,max ≅ 365 nm) (53, 54). Although NAD(P)H fluorescence has been shown to oscillate in β-cells (8, 21, 27), strictly differentiating the mitochondrial-specific NADH component from the total signal requires two-photon microscopy and makes it difficult to detect oscillations as it reduces the sensitivity of the technique (53, 54). In contrast to NAD(P)H, endogenous flavins fluoresce in their oxidized state (λex,max ≅ 450 nm) and reflect the level of flavin adenine dinucleotides and mitochondrial flavoproteins. These measurements are reported to provide a better approach to monitor mitochondrial activation as the redox-responsive flavins are intrinsic to the mitochondrion (52, 54, 55), although the sensitivity needed to detect oscillations is currently lacking. Thus, developing a method that is compatible with PKAR first required the evaluation and improvement of the existing techniques for measuring endogenous autofluorescence.
As a first attempt we adapted the ratiometric NAD(P)H/flavin (also known as “redox ratio”) assay (54, 56) for epifluorescence microscopy using alternating excitation at 365 and 430 nm to excite NAD(P)H and flavins, respectively (Fig. 6A). The use of a 10× 0.3 NA objective and a camera with electron multiplication gain (100–200) allowed groups of 15–20 islets to be independently and simultaneously measured. As shown in Fig. 6B, islet redox potential increased in response to glucose, resulting in a rise in NAD(P)H fluorescence and a corresponding drop in flavin fluorescence. NAD(P)H fluorescence rose before the drop in flavin fluorescence (Fig. 6B, inset), consistent with the ∼20-s time lag between the activation of cytosolic and mitochondrial compartments reported previously (53). After reaching steady state, the glucose-dependent increase in redox potential was reversed by the addition of FCCP (carbonyl cyanide p-[trifluoromethoxy]-phenyl-hydrazone), an uncoupler that forces the mitochondria to oxidize adenine dinucleotides in a futile attempt to maintain the chemiosmotic gradient of the inner membrane space of the mitochondrion. These results further confirm that islet autofluorescence is predominantly mitochondrial. However, as expected, the NAD(P)H and flavin response to FCCP were not precisely mirrored; the decay of NAD(P)H fluorescence (τ−1 = 0.309 ± 0.007) lagged the increase in flavin fluorescence (τ−1 = 0.90 ± 0.08), consistent with there being a small component of the NAD(P)H signal that is non-mitochondrial. Although the flavin measurements we made using this imaging technique lack the resolution to detect oscillations or small changes due to small additions of glucose, these epifluorescence NAD(P)H/flavin measurements should under most circumstances be capable of measuring the combined output of glycolytic and mitochondrial metabolism.
FIGURE 6.
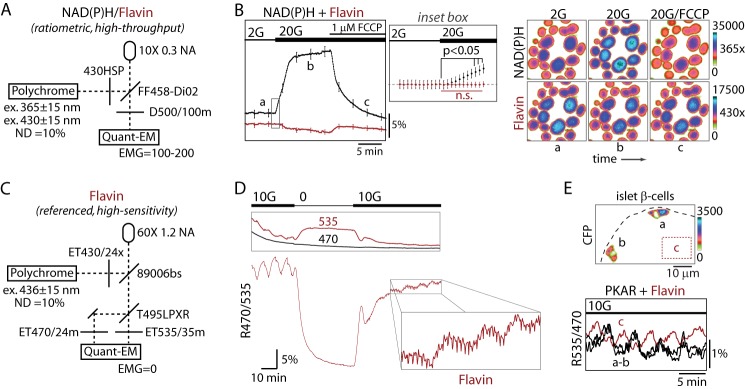
PKM2 activity is in phase with mitochondrial redox potential. A, line diagram of the microscope configuration for simultaneous NAD(P)H and flavin imaging (also known as the redox ratio) excited at 365 nm and 430 nm, respectively. ND, neutral density filter; NA, numerical aperture; EMG, electron multiplication gain. B, glucose-dependent changes in islet NAD(P)H and flavin fluorescence (F/F0) are shown in response to the mitochondrial uncoupled FCCP (1 μm). Traces reflect the mean ± S.E., n = 68 islets from 2 mice. The inset box is expanded (middle panel) to show NAD(P)H (black) and flavin (red) fluorescence immediately after glucose elevation. Images were taken every 5 s. The image series (right) shows a representative field of islets during the recording at times a, b, and c. n.s., not significant. C, line diagram of the microscope configuration for high sensitivity flavin imaging at 436-nm excitation, which exactly matches the optical configuration for the FRET/Cerulean emission ratio (R535/470). D, flavin imaging of a naïve islet at the indicated glucose concentrations using the imaging parameters in C. The individual emission channels (535 nm, flavin fluorescence; 470, reference) are shown in the box (top), and the emission ratio R470/535 (below) is proportional to the level of reduced flavins and redox potential. Data are representative of 24 recordings from five mice. E, simultaneous recording of PKAR FRET (cells a and b) and flavin fluorescence (untransduced cells in region, c) in neighboring cells of an islet stimulated with 10 mm glucose (10G); note that R535/470 is used for both measurements. Traces are representative of eight independent experiments from three mice.
By comparison, high sensitivity measurements of flavin fluorescence were achieved using a 60× 1.2 NA objective to image single islets excited at 436 nm in combination with a CFP-YFP beam splitter (Fig. 6C). In contrast to the broad emission spectrum collected in Fig. 6B (500 ± 50 nm), we isolated the flavin emission using a 535 ± 15-nm emission filter while using 470 ± 12 nm as a reference, which controlled for bleaching and movement artifacts but was unaffected by changes in glucose (Fig. 6D, top). Turning off the camera's electron multiplication gain resulted in greatly reduced noise (data not shown) and allowed multi-hour time-lapse imaging when sampling at 8-s intervals. As shown in Fig. 6D, bottom, we observed slow oscillations in mitochondrial redox potential (R470/535) in the presence of 10 mm glucose that were immediately terminated by glucose deprivation, coincident with a 25% drop in base-line fluorescence. On average, R470/535 decreased by 38%, from 0.252 ± 0.005 to 0.182 ± 0.006 (n = 24; t test, p < 0.0001), when switching from 10 to 2.5 mm glucose, indicating a >3-fold improvement in dynamic range over previously existing techniques (55). When glucose was again raised to 10 mm, a biphasic response ensued consisting of an initial spike followed by compound oscillations (i.e. fast oscillations (period 64 s) superimposed upon slow oscillations (period 7.5 min, fast Fourier transform) (Fig. 6D, inset). The period of the fast mitochondrial oscillations is consistent with fast oscillations in plasma membrane electrical activity and could reflect the activation of mitochondrial dehydrogenases by Ca2+ or, alternatively, intrinsic mitochondrial oscillations arising from oxidative phosphorylation feeding back onto the TCA cycle (52, 57, 58). In addition to validating the approach, these results demonstrate that mitochondria exhibit both fast and slow oscillations, with the latter dominating the changes in redox potential. A key question, then, is what is the relationship between these mitochondrial oscillations and glycolytic efflux?
Simultaneous Measurements of Glycolytic and Mitochondrial Function
To assess the phase relationship between PKM2 activity and mitochondrial redox potential, we simultaneously measured PKAR FRET in islet β-cells and mitochondrial flavin fluorescence from untransduced cells present in the same islet (Fig. 6E). Because flavins are fluorescent in their oxidized form (54, 55), the 180° phase shift we observed (200 s, by cross-correlation analysis) between the two pulsatile signals indicates that activation of glycolytic PKM2 and the mitochondrial redox potential occur exactly in phase. The results shown are representative of eight simultaneous recordings from three animals.
DISCUSSION
PKM2 catalyzes the final step in glycolysis in pancreatic β-cells. We have developed a highly sensitive optical FRET probe for PKM2 activity, PKAR, which is based on the FBP-induced tetramerization of PKM2, which is required for enzymatic activity. In the absence of FBP, PKM2 is inactive at any physiological phosphoenolpyruvate concentration (32, 59), and we show directly that FBP is both necessary and sufficient to induce a FRET increase in the sensor. Finally, we used PKAR to directly establish that glycolytic efflux through PKM2 is oscillatory in β-cells and in phase with the mitochondrial redox potential.
PKAR Provides Direct Evidence That Glycolytic Oscillations Are Driven by PFK1 in β-Cells
The most straightforward explanation for the pulsatile PKAR activity of β-cells is that PKM2 activity mirrors FBP oscillations produced by PFK1. In support of this, PKM2 activity can be made to oscillate in pancreatic islet cytosol by artificially induced oscillations of FBP when the levels of substrates for the enzyme are held constant (35), indicating that oscillations in FBP itself can account for the oscillations in PKAR independent of the flow of substrate to pyruvate kinase. Second, slow metabolic oscillations in both yeast (10, 12) and skeletal muscle (13–15) are driven by PFK1. In fact, PKAR is capable of detecting glycolytic oscillations in respiratory-deficient yeast. Third, in pancreatic β-cells, only substrates that enter the metabolism upstream of PFK1 activated PKAR, whereas a previous study showed that substrates entering downstream of PFK1 fail to produce corresponding oscillations in Ca2+ (Ref. 18 but see Ref 26). Finally, models based on the oscillating activity of the muscle isoform of PFK1, which is present in β-cells and possesses the appropriate Kd for both the autocatalysis of FBP and inhibition by ATP, can uniquely account for slow oscillations such as those observed here (16, 22, 49, 60).
Alternatively, our data could conceivably be explained by periodic inactivation of PKM2, for example, by tyrosine phosphorylation (43, 47) or reactive oxygen species (41), although oscillations would only be generated by this mechanism if the source of the feedback was sufficiently slow or delayed. A third possibility is that glycolytic oscillations are secondary to plasma membrane electrical activity, which feeds back to metabolism at several places (for review, see Ref. 22). For example, PFK1 activity could be susceptible to oscillating ATP levels (6), which are generated by plasma membrane ATPases as Ca2+ levels vary (60). Although oscillations in NAD(P)H and O2 can persist in the absence of downstream electrical oscillations (20, 21, 52), ruling out Ca2+ as a necessary driver of mitochondrial oscillations, it remains formally possible that mitochondrial oscillations are intrinsic, whereas glycolytic oscillations are under Ca2+ or other secondary control. Nevertheless, a parsimonious interpretation of the collective data is that glycolytic oscillations, driven by PFK1 and measurable by PKAR, have a period of 2–9 min and are in turn responsible for downstream mitochondrial and Ca2+ oscillations.
Flavin Measurements in Islets
Although the NAD(P)H/flavin ratio, or redox ratio, has been used for decades to assess metabolic function (56) and was developed previously for confocal microscopy (54, 55), we validate a high throughput version of this ratio to assay islets on an epifluorescence microscope with up to 20 islets measured independently and simultaneously. As expected, glucose-dependent changes in islet flavin fluorescence appear to be mitochondrial in origin and change in the opposite direction to NAD(P)H fluorescence. Using this method we determined the time delay between cytosolic and mitochondrial activation to be 20–30 s, calculated as the lag between changes in NAD(P)H and flavin fluorescence after glucose elevation, in excellent agreement with previous two-photon measurements that spatially isolate the cytosolic and mitochondrial compartments (53). The changes we observed in flavin and NAD(P)H fluorescence changes were not perfectly antiparallel, however, based on their differential responses to FCCP; flavin fluorescence changed three times faster than NAD(P)H, further confirming that the former is more specific to mitochondria (54, 55).
We developed a second, highly sensitive method for flavin imaging that utilized a common CFP-YFP FRET filter set and thus avoids the need for ultraviolet excitation. This method was capable of obtaining a 5–10-fold better oscillation amplitude compared with simply monitoring the corresponding NAD(P)H fluorescence (F/Fo ∼ 5% versus 0.5% for NAD(P)H (8, 21)) and a ∼3-fold better dynamic range (defined as the fluorescence change that occurred when switching from 11 to 0 mm glucose). Islet flavin measurements demonstrate that, akin to downstream oscillations in Ca2+ influx (61), mitochondria can produce a variety of oscillatory behaviors even within the same islet. In the example shown in Fig. 6D, slow oscillations predominate at steady state, whereas fast or compound oscillations are readily induced upon glucose elevation. Several mechanisms could account for the fast oscillations we observed. Their period of <2 min is consistent with the fast oscillations in plasma membrane electrical activity and/or Ca2+ influx, which are known to act on mitochondria both by short-circuiting the mitochondrial membrane potential (62) and by activating mitochondrial dehydrogenases (52, 57). Fast flavin oscillations are also consistent with intrinsic mitochondrial oscillations (57), which could be produced either by TCA cycle oscillations or by oxidative phosphorylation negatively feeding back on the TCA cycle (58). We note, however, that the dominant oscillations in flavin fluorescence, even after glucose elevation, are slow.
Simultaneous PKAR and Flavin Measurements
A persistent challenge we faced is that the endogenous flavin fluorescence of islets directly interferes with ratiometric measurements of CFP-YFP FRET. Measuring FRET efficiency, which corrects for steady-state autofluorescence changes, eliminates this problem (40). However, when recording the FRET/Cerulean ratio (R535/470), we have observed a decrease in PKAR donor fluorescence without a concomitant increase in acceptor fluorescence when glucose is raised. The most likely explanation for this is that glucose-dependent flavin fluorescence decreases in the acceptor channel (535/35) while leaving the donor (470/24) channel unaffected (as in Fig. 6D), underestimating the change in FRET. Less than expected responses to glucose stimulation can generally be avoided by ensuring there is adequate reporter expression in a particular cell (63), and in the case of PKAR, a routine control we relied upon is that FRET and flavin fluorescence changed in opposite directions.
In cases where we applied these controls, we observed that the flavin oscillations were 180 degrees out of phase with the glycolytic oscillations we measured simultaneously using PKAR, indicating that PKAR oscillations (and hence glycolytic oscillations) must be in phase with the mitochondrial redox potential. This phase relationship is predicted by our Dual Oscillator Model for islet oscillations in which glycolytic oscillations drive oscillations in metabolism and insulin secretion (22). Over several decades, a systematic comparison of the phase relationship between NAD(P)H and oscillating glycolytic intermediates has provided overwhelming evidence that metabolic oscillations are generated by PFK1 in yeast (12). Although yeast autofluorescence is actually enhanced by blocking respiration with KCN (64), oscillations become undetectable in respiration-deficient islets, complicating the use of NAD(P)H as a reference. Furthermore, the only measurement of oscillating glycolytic intermediates in islets to date has been a recording showing partial oscillations in glucose 6-phosphate, although in this case the β-cells were from ob/ob islets stimulated by clonidine and high Ca2+ (6). These limitations were a key motivation for the development of PKAR, which can ultimately be used in combination with other probes to either validate PFK1 as the underlying glycolytic oscillator or to test the predictions of other models.
A Possible Role of PKM2 in β-Cell Proliferation?
Our data suggest two potential mechanisms by which glycolytic activity is modulated through PKM2 in the β-cell, each involving tyrosine phosphorylation. First, we found that the dynamic range of PKAR was diminished by K433E, a mutant that blocks PKM2 binding to phosphotyrosine peptides that catalyze the release of FBP (43), as well as S437Y, which inhibits the ability of FBP to displace these peptides (48). Our data also suggest that the direct phosphorylation of PKM2 at Tyr-105 shifts PKM2 to its inactive state by disrupting FBP binding, as Y105F, which blocks this phosphorylation event (47), also diminished PKAR dynamic range. Each of these mechanisms have been reported in rapidly proliferating (i.e. tumorigenic) cells, so it is unsurprising that the same post-translational modifications affected PKAR activity in proliferating Min6 insulinoma cells (Fig. 3C). It will be interesting to determine whether the inactivation of PKM2 could affect the proliferation of islet β-cells, a question we leave for future work.
Summary
In conclusion, we have shown that PKAR is a useful new tool for metabolic phenotyping in multiple cellular systems, including yeast and secretory cells such as the pancreatic β-cells. We have used this tool to demonstrate that the FBP level, and thus PFK1 activity, is oscillatory in β-cells. These glycolytic oscillations can serve as the mechanism for the ∼5 min insulin oscillations that occur in mice, rats, and humans (2, 9, 65, 66), consistent with our Dual Oscillator Model (22). PKAR could be used as a surrogate end point of glycolytic activity and to assess the efficacy of therapeutic interventions that target metabolic activity and possibly proliferative activity. The measurements of NAD(P)H and flavin fluorescence described here provide a simple, accessible approach for assessing mitochondrial function in islets using commonly available equipment. If imaged simultaneously, FRET probes for lactate (67), glucose (68), and citrate (69) could be compared with measurements of PKAR or flavin fluorescence to determine the key phase relationships between metabolic pathways and provide insight into the biochemical mechanism of the intrinsic islet oscillations.
Supplementary Material
Acknowledgments
We thank A. Sherman, R. Bertram, and K. Tornheim for helpful discussions and for comments on the manuscript.
This work was supported, in whole or in part, by National Institutes of Health Grants R01DK46409 (to L. S. S.) and F32DK085960 (to M. J. M.). Additional support was provided by Dr. Steve Lentz and the Morphology and the Image Analysis Core of the University of Michigan Diabetes Research and Training Center (5P60 DK-20572).
This article was selected as a Paper of the Week.

This article contains supplemental Movie 1.
- PFK1
- phosphofructokinase-1
- PKAR
- pyruvate kinase (PK) activity reporter
- FBP
- fructose 1,6-bisphosphate
- PKM2
- pyruvate kinase M2
- FCCP
- carbonyl cyanide p-[trifluoromethoxy]-phenyl-hydrazone
- E
- FRET efficiency.
REFERENCES
- 1. Bratusch-Marrain P. R., Komjati M., Waldhäusl W. K. (1986) Efficacy of pulsatile versus continuous insulin administration on hepatic glucose production and glucose utilization in type I diabetic humans. Diabetes 35, 922–926 [DOI] [PubMed] [Google Scholar]
- 2. Meier J. J., Veldhuis J. D., Butler P. C. (2005) Pulsatile insulin secretion dictates systemic insulin delivery by regulating hepatic insulin extraction in humans. Diabetes 54, 1649–1656 [DOI] [PubMed] [Google Scholar]
- 3. Matveyenko A. V., Liuwantara D., Gurlo T., Kirakossian D., Dalla Man C., Cobelli C., White M. F., Copps K. D., Volpi E., Fujita S., Butler P. C. (2012) Pulsatile portal vein insulin delivery enhances hepatic insulin action and signaling. Diabetes 61, 2269–2279 [DOI] [PMC free article] [PubMed] [Google Scholar]
- 4. Menge B. A., Grüber L., Jørgensen S. M., Deacon C. F., Schmidt W. E., Veldhuis J. D., Holst J. J., Meier J. J. (2011) Loss of inverse relationship between pulsatile insulin and glucagon secretion in patients with type 2 diabetes. Diabetes 60, 2160–2168 [DOI] [PMC free article] [PubMed] [Google Scholar]
- 5. O'Rahilly S., Turner R. C., Matthews D. R. (1988) Impaired pulsatile secretion of insulin in relatives of patients with non-insulin-dependent diabetes. N. Engl. J. Med. 318, 1225–1230 [DOI] [PubMed] [Google Scholar]
- 6. Nilsson T., Schultz V., Berggren P. O., Corkey B. E., Tornheim K. (1996) Temporal patterns of changes in ATP/ADP ratio, glucose 6-phosphate and cytoplasmic free Ca2+ in glucose-stimulated pancreatic beta-cells. Biochem. J. 314, 91–94 [DOI] [PMC free article] [PubMed] [Google Scholar]
- 7. Jung S. K., Kauri L. M., Qian W. J., Kennedy R. T. (2000) Correlated oscillations in glucose consumption, oxygen consumption, and intracellular free Ca2+ in single islets of Langerhans. J. Biol. Chem. 275, 6642–6650 [DOI] [PubMed] [Google Scholar]
- 8. Luciani D. S., Misler S., Polonsky K. S. (2006) Ca2+ controls slow NAD(P)H oscillations in glucose-stimulated mouse pancreatic islets. J. Physiol. 572, 379–392 [DOI] [PMC free article] [PubMed] [Google Scholar]
- 9. Gilon P., Shepherd R. M., Henquin J. C. (1993) Oscillations of secretion driven by oscillations of cytoplasmic Ca2+ as evidences in single pancreatic islets. J. Biol. Chem. 268, 22265–22268 [PubMed] [Google Scholar]
- 10. Betz A., Chance B. (1965) Phase relationship of glycolytic intermediates in yeast cell with oscillatory metabolic control. Arch. Biochem. Biophys. 109, 585–594 [DOI] [PubMed] [Google Scholar]
- 11. Richard P., Diderich J. A., Bakker B. M., Teusink B., van Dam K., Westerhoff H. V. (1994) Yeast cells with a specific cellular make-up and an environment that removes acetaldehyde are prone to sustained glycolytic oscillations. FEBS Lett. 341, 223–226 [DOI] [PubMed] [Google Scholar]
- 12. Richard P. (2003) The rhythm of yeast. FEMS Microbiol. Rev. 27, 547–557 [DOI] [PubMed] [Google Scholar]
- 13. Tornheim K. (1988) Fructose 2,6-bisphosphate and glycolytic oscillations in skeletal muscle extracts. J. Biol. Chem. 263, 2619–2624 [PubMed] [Google Scholar]
- 14. Tornheim K., Andrés V., Schultz V. (1991) Modulation by citrate of glycolytic oscillations in skeletal muscle extracts. J. Biol. Chem. 266, 15675–15678 [PubMed] [Google Scholar]
- 15. Tornheim K. (1979) Oscillations of the glycolytic pathway and the purine nucleotide cycle. J. Theor. Biol. 79, 491–541 [DOI] [PubMed] [Google Scholar]
- 16. Tornheim K. (1997) Are metabolic oscillations responsible for normal oscillatory insulin secretion? Diabetes 46, 1375–1380 [DOI] [PubMed] [Google Scholar]
- 17. Kennedy R. T., Kauri L. M., Dahlgren G. M., Jung S. K. (2002) Metabolic oscillations in beta cells. Diabetes 51, S152–S161 [DOI] [PubMed] [Google Scholar]
- 18. Dahlgren G. M., Kauri L. M., Kennedy R. T. (2005) Substrate effects on oscillations in metabolism, calcium, and secretion in single mouse islets of Langerhans. Biochim. Biophys. Acta 1724, 23–36 [DOI] [PubMed] [Google Scholar]
- 19. Merrins M. J., Bertram R., Sherman A., Satin L. S. (2012) Phosphofructo-2-kinase/fructose-2,6-bisphosphatase modulates oscillations of pancreatic islet metabolism. PLoS ONE 7, e34036. [DOI] [PMC free article] [PubMed] [Google Scholar]
- 20. Jung S.-K., Aspinwall C. A., Kennedy R. T. (1999) Detection of multiple patterns of oscillatory oxygen consumption in single mouse islets of Langerhans. Biochem. Biophys. Res. Commun. 259, 331–335 [DOI] [PubMed] [Google Scholar]
- 21. Merrins M. J., Fendler B., Zhang M., Sherman A., Bertram R., Satin L. S. (2010) Metabolic oscillations in pancreatic islets depend on the intracellular Ca2+ level but not Ca2+ oscillations. Biophys. J. 99, 76–84 [DOI] [PMC free article] [PubMed] [Google Scholar]
- 22. Bertram R., Sherman A., Satin L. S. (2007) Metabolic and electrical oscillations. Partners in controlling pulsatile insulin secretion. Am. J. Physiol. Endocrinol. Metab. 293, E890–E900 [DOI] [PubMed] [Google Scholar]
- 23. Fridlyand L. E., Tamarina N., Philipson L. H. (2003) Modeling of Ca2+ flux in pancreatic beta cells. Role of the plasma membrane and intracellular stores. Am. J. Physiol. Endocrinol. Metab. 285, E138–E154 [DOI] [PubMed] [Google Scholar]
- 24. Fridlyand L. E., Ma L., Philipson L. H. (2005) Adenine nucleotide regulation in pancreatic beta cells. Modeling of ATP/ADP-Ca2+ interactions. Am. J. Physiol. Endocrinol. Metab. 289, E839–E848 [DOI] [PubMed] [Google Scholar]
- 25. Fridlyand L. E., Jacobson D. A., Kuznetsov A., Philipson L. H. (2009) A model of action potentials and fast Ca2+ dynamics in pancreatic beta-cells. Biophys. J. 96, 3126–3139 [DOI] [PMC free article] [PubMed] [Google Scholar]
- 26. Heart E., Smith P. J. (2007) Rhythm of the beta cell oscillator is not governed by a single regulator. Multiple systems contribute to oscillatory behavior. Am. J. Physiol. Endocrinol. Metab. 292, E1295–E1300 [DOI] [PubMed] [Google Scholar]
- 27. Heart E., Yaney G. C., Corkey R. F., Schultz V., Luc E., Liu L., Deeney J. T., Shirihai O., Tornheim K., Smith P. J., Corkey B. E. (2007) Ca2+, NAD(P)H and membrane potential changes in pancreatic beta cells by methyl succinate. Comparison with glucose. Biochem. J. 403, 197–205 [DOI] [PMC free article] [PubMed] [Google Scholar]
- 28. Yamada K., Noguchi T. (1999) Nutrient and hormonal regulation of pyruvate kinase gene expression. Biochem. J. 337, 1–11 [PMC free article] [PubMed] [Google Scholar]
- 29. MacDonald M. J., Chang C. M. (1985) Pancreatic islets contain the M2 isoenzyme of pyruvate kinase. Its phosphorylation has no effect on enzyme activity. Mol. Cell. Biochem. 68, 115–120 [DOI] [PubMed] [Google Scholar]
- 30. Chatterton T. A., Reynolds C. H., Lazarus N. R., Pogson C. I. (1982) Immunological and kinetic properties of pyruvate kinase in rat pancreatic islets. Biochem. J. 204, 605–608 [DOI] [PMC free article] [PubMed] [Google Scholar]
- 31. Martens G. A., Jiang L., Verhaeghen K., Connolly J. B., Geromanos S. G., Stangé G., Van Oudenhove L., Devreese B., Hellemans K. H., Ling Z., Van Schravendijk C., Pipeleers D. G., Vissers J. P., Gorus F. K. (2010) Protein markers for insulin-producing beta cells with higher glucose sensitivity. PLoS ONE 5, e14214. [DOI] [PMC free article] [PubMed] [Google Scholar]
- 32. Mazurek S. (2011) Pyruvate kinase type M2. A key regulator of the metabolic budget system in tumor cells. Int. J. Biochem. Cell Biol. 43, 969–980 [DOI] [PubMed] [Google Scholar]
- 33. Gao X., Wang H., Yang J. J., Liu X., Liu Z.-R. (2012) Pyruvate kinase M2 regulates gene transcription by acting as a protein kinase. Mol. Cell 45, 598–609 [DOI] [PMC free article] [PubMed] [Google Scholar]
- 34. Ashizawa K., Willingham M. C., Liang C. M., Cheng S. Y. (1991) In vivo regulation of monomer-tetramer conversion of pyruvate kinase subtype M2 by glucose is mediated via fructose 1,6-bisphosphate. J. Biol. Chem. 266, 16842–16846 [PubMed] [Google Scholar]
- 35. MacDonald M. J., Al-Masri H., Jumelle-Laclau M., Cruz M. O. (1997) Oscillations in activities of enzymes in pancreatic islet subcellular fractions induced by physiological concentrations of effectors. Diabetes 46, 1996–2001 [DOI] [PubMed] [Google Scholar]
- 36. Ikeda Y., Noguchi T. (1998) Allosteric regulation of pyruvate kinase M2 isozyme involves a cysteine residue in the intersubunit contact. J. Biol. Chem. 273, 12227–12233 [DOI] [PubMed] [Google Scholar]
- 37. Morgan H. P., O'Reilly F. J., Wear M. A., O'Neill J. R., Fothergill-Gilmore L. A., Hupp T., Walkinshaw M. D. (2013) M2 pyruvate kinase provides a mechanism for nutrient sensing and regulation of cell proliferation. Proc. Natl. Acad. Sci. U.S.A. 110, 5881–5886 [DOI] [PMC free article] [PubMed] [Google Scholar]
- 38. Ravier M. A., Daro D., Roma L. P., Jonas J.-C., Cheng-Xue R., Schuit F. C., Gilon P. (2011) Mechanisms of control of the free Ca2+ concentration in the endoplasmic reticulum of mouse pancreatic β-cells. Interplay with cell metabolism and [Ca2+]c and role of SERCA2b and SERCA3. Diabetes 60, 2533–2545 [DOI] [PMC free article] [PubMed] [Google Scholar]
- 39. Miyazaki J., Araki K., Yamato E., Ikegami H., Asano T., Shibasaki Y., Oka Y., Yamamura K. (1990) Establishment of a pancreatic beta cell line that retains glucose-inducible insulin secretion. Special reference to expression of glucose transporter isoforms. Endocrinology 127, 126–132 [DOI] [PubMed] [Google Scholar]
- 40. Hoppe A., Christensen K., Swanson J. A. (2002) Fluorescence resonance energy transfer-based stoichiometry in living cells. Biophys. J. 83, 3652–3664 [DOI] [PMC free article] [PubMed] [Google Scholar]
- 41. Anastasiou D., Poulogiannis G., Asara J. M., Boxer M. B., Jiang J. K., Shen M., Bellinger G., Sasaki A. T., Locasale J. W., Auld D. S., Thomas C. J., Vander Heiden M. G., Cantley L. C. (2011) Inhibition of pyruvate kinase M2 by reactive oxygen species contributes to cellular antioxidant responses. Science 334, 1278–1283 [DOI] [PMC free article] [PubMed] [Google Scholar]
- 42. Koushik S. V., Blank P. S., Vogel S. S. (2009) Anomalous surplus energy transfer observed with multiple FRET acceptors. PLoS ONE 4, e8031. [DOI] [PMC free article] [PubMed] [Google Scholar]
- 43. Christofk H. R., Vander Heiden M. G., Wu N., Asara J. M., Cantley L. C. (2008) Pyruvate kinase M2 is a phosphotyrosine-binding protein. Nature 452, 181–186 [DOI] [PubMed] [Google Scholar]
- 44. Rizzo M. A., Piston D. W. (2005) High-contrast imaging of fluorescent protein FRET by fluorescence polarization microscopy. Biophys. J. 88, L14–L16 [DOI] [PMC free article] [PubMed] [Google Scholar]
- 45. Markwardt M. L., Kremers G.-J., Kraft C. A., Ray K., Cranfill P. J., Wilson K. A., Day R. N., Wachter R. M., Davidson M. W., Rizzo M. A. (2011) An improved cerulean fluorescent protein with enhanced brightness and reduced reversible photoswitching. PLoS ONE 6, e17896. [DOI] [PMC free article] [PubMed] [Google Scholar]
- 46. Chaneton B., Hillmann P., Zheng L., Martin A. C., Maddocks O. D., Chokkathukalam A., Coyle J. E., Jankevics A., Holding F. P., Vousden K. H., Frezza C., O'Reilly M., Gottlieb E. (2012) Serine is a natural ligand and allosteric activator of pyruvate kinase M2. Nature 491, 458–462 [DOI] [PMC free article] [PubMed] [Google Scholar]
- 47. Hitosugi T., Kang S., Vander Heiden M. G., Chung T.-W., Elf S., Lythgoe K., Dong S., Lonial S., Wang X., Chen G. Z., Xie J., Gu T.-L., Polakiewicz R. D., Roesel J. L., Boggon T. J., Khuri F. R., Gilliland D. G., Cantley L. C., Kaufman J., Chen J. (2009) Tyrosine phosphorylation inhibits PKM2 to promote the Warburg effect and tumor growth. Sci. Signal. 2, ra73. [DOI] [PMC free article] [PubMed] [Google Scholar]
- 48. Allali-Hassani A., Wasney G. A., Chau I., Hong B. S., Senisterra G., Loppnau P., Shi Z., Moult J., Edwards A. M., Arrowsmith C. H., Park H. W., Schapira M., Vedadi M. (2009) A survey of proteins encoded by non-synonymous single nucleotide polymorphisms reveals a significant fraction with altered stability and activity. Biochem. J. 424, 15–26 [DOI] [PubMed] [Google Scholar]
- 49. Bertram R., Satin L., Zhang M., Smolen P., Sherman A. (2004) Calcium and glycolysis mediate multiple bursting modes in pancreatic islets. Biophys. J. 87, 3074–3087 [DOI] [PMC free article] [PubMed] [Google Scholar]
- 50. Hess B., Boiteux A. (1971) Oscillatory phenomena in biochemistry. Annu. Rev. Biochem. 40, 237–258 [DOI] [PubMed] [Google Scholar]
- 51. Benninger R. K., Zhang M., Head W. S., Satin L. S., Piston D. W. (2008) Gap junction coupling and calcium waves in the pancreatic islet. Biophys. J. 95, 5048–5061 [DOI] [PMC free article] [PubMed] [Google Scholar]
- 52. Civelek V. N., Deeney J. T., Shalosky N. J., Tornheim K., Hansford R. G., Prentki M., Corkey B. E. (1996) Regulation of pancreatic beta-cell mitochondrial metabolism. Influence of Ca2+, substrate and ADP. Biochem. J. 318, 615–621 [DOI] [PMC free article] [PubMed] [Google Scholar]
- 53. Patterson G. H., Knobel S. M., Arkhammar P., Thastrup O., Piston D. W. (2000) Separation of the glucose-stimulated cytoplasmic and mitochondrial NAD(P)H responses in pancreatic islet beta cells. Proc. Natl. Acad. Sci. U.S.A. 97, 5203–5207 [DOI] [PMC free article] [PubMed] [Google Scholar]
- 54. Rocheleau J. V., Head W. S., Piston D. W. (2004) Quantitative NAD(P)H/flavoprotein autofluorescence imaging reveals metabolic mechanisms of pancreatic islet pyruvate response. J. Biol. Chem. 279, 31780–31787 [DOI] [PubMed] [Google Scholar]
- 55. Quesada I., Todorova M. G., Soria B. (2006) Different metabolic responses in alpha, beta, and delta cells of the islet of Langerhans monitored by redox confocal microscopy. Biophys. J. 90, 2641–2650 [DOI] [PMC free article] [PubMed] [Google Scholar]
- 56. Chance B., Schoener B., Oshino R., Itshak F., Nakase Y. (1979) Oxidation-reduction ratio studies of mitochondria in freeze-trapped samples. NADH and flavoprotein fluorescence signals. J. Biol. Chem. 254, 4764–4771 [PubMed] [Google Scholar]
- 57. MacDonald M. J. (2003) Citrate oscillates in liver and pancreatic beta cell mitochondria and in INS-1 insulinoma cells. J. Biol. Chem. 278, 51894–51900 [DOI] [PubMed] [Google Scholar]
- 58. Bertram R., Budu-Grajdeanu P., Jafri M. S. (2009) Using phase relations to identify potential mechanisms for metabolic oscillations in isolated β-cell mitochondria. Islets 1, 87–94 [DOI] [PubMed] [Google Scholar]
- 59. Mazurek S., Boschek C. B., Hugo F., Eigenbrodt E. (2005) Pyruvate kinase type M2 and its role in tumor growth and spreading. Semin. Cancer Biol. 15, 300–308 [DOI] [PubMed] [Google Scholar]
- 60. Li J., Shuai H. Y., Gylfe E., Tengholm A. (2013) Oscillations of sub-membrane ATP in glucose-stimulated beta cells depend on negative feedback from Ca2+. Diabetologia 56, 1577–1586 [DOI] [PMC free article] [PubMed] [Google Scholar]
- 61. Nunemaker C. S., Satin L. S. (2004) Comparison of metabolic oscillations from mouse pancreatic beta cells and islets. Endocrine 25, 61–67 [DOI] [PubMed] [Google Scholar]
- 62. Keizer J., Magnus G. (1989) ATP-sensitive potassium channel and bursting in the pancreatic beta cell. A theoretical study. Biophys. J. 56, 229–242 [DOI] [PMC free article] [PubMed] [Google Scholar]
- 63. Depry C., Zhang J. (2010) Visualization of kinase activity with FRET-based activity biosensors. Curr. Protoc. Mol. Biol. Chapter 18, Unit 18.15 [DOI] [PubMed] [Google Scholar]
- 64. Schneckenburger H., Gessler P., Pavenstädt-Grupp I. (1992) Measurements of mitochondrial deficiencies in living cells by microspectrofluorometry. J. Histochem. Cytochem. 40, 1573–1578 [DOI] [PubMed] [Google Scholar]
- 65. Nunemaker C. S., Zhang M., Wasserman D. H., McGuinness O. P., Powers A. C., Bertram R., Sherman A., Satin L. S. (2005) Individual mice can be distinguished by the period of their islet calcium oscillations. Is there an intrinsic islet period that is imprinted in vivo? Diabetes 54, 3517–3522 [DOI] [PubMed] [Google Scholar]
- 66. Longo E. A., Tornheim K., Deeney J. T., Varnum B. A., Tillotson D., Prentki M., Corkey B. E. (1991) Oscillations in cytosolic free Ca2+, oxygen consumption, and insulin secretion in glucose-stimulated rat pancreatic islets. J. Biol. Chem. 266, 9314–9319 [PubMed] [Google Scholar]
- 67. San Martín A., Ceballo S., Ruminot I., Lerchundi R., Frommer W. B., Barros L. F. (2013) A genetically encoded FRET lactate sensor and its use to detect the Warburg effect in single cancer cells. PLoS ONE 8, e57712. [DOI] [PMC free article] [PubMed] [Google Scholar]
- 68. Hou B.-H., Takanaga H., Grossmann G., Chen L.-Q., Qu X.-Q., Jones A. M., Lalonde S., Schweissgut O., Wiechert W., Frommer W. B. (2011) Optical sensors for monitoring dynamic changes of intracellular metabolite levels in mammalian cells. Nat. Protoc. 6, 1818–1833 [DOI] [PubMed] [Google Scholar]
- 69. Ewald J. C., Reich S., Baumann S., Frommer W. B., Zamboni N. (2011) Engineering genetically encoded nanosensors for real-time in vivo measurements of citrate concentrations. PLoS ONE 6, e28245. [DOI] [PMC free article] [PubMed] [Google Scholar]
Associated Data
This section collects any data citations, data availability statements, or supplementary materials included in this article.