

Background: Transcription factor doses play important roles in normal and malignant B-lymphocyte development.
Results: We show dose-dependent regulation of B-cell specification and expansion of committed progenitors.
Conclusion: Transcription factor dose impacts several aspects of B-cell development.
Significance: Knowing the effects of reduced transcription factor dose aids our understanding of the molecular events underlying leukemia and B-cell development.
Keywords: Development, Differentiation, Immunology, Lymphocyte, Transcription Factors
Abstract
Transcription factor doses are of importance for normal and malignant B-lymphocyte development; however, the understanding of underlying mechanisms and functional consequences of reduced transcription factor levels is limited. We have analyzed progenitor and B-lineage compartments in mice carrying heterozygote mutations in the E2a, Ebf1, or Pax5 gene. Although lymphoid progenitors from Ebf1 or Pax5 heterozygote mice were specified and lineage-restricted in a manner comparable with Wt progenitors, this process was severely impaired in E2a heterozygote mutant mice. This defect was not significantly enhanced upon combined deletion of E2a with Ebf1 or Pax5. Analysis of the pre-B-cell compartment in Ebf1 heterozygote mice revealed a reduction in cell numbers. These cells expressed Pax5 and other B-lineage-associated genes, and global gene expression analysis suggested that the reduction of the pre-B-cell compartment was a result of impaired pre-B-cell expansion. This idea was supported by a reduction in IL2Rα-expressing late pre-B-cells as well as by cell cycle analysis and by the finding that the complexity of the VDJ rearrangement patterns was comparable in Wt and Ebf1+/− pre-B-cells, although the number of progenitors was reduced. Heterozygote deletion of Ebf1 resulted in impaired response to IL7 in vitro and reduced expression levels of pre-BCR on the cell surface, providing possible explanations for the observed stage-specific reduction in cellular expansion. Thus, transcription factor doses are critical for specification as well as expansion of B-lymphoid progenitors, providing increased insight into the molecular regulation of B-cell development.
Introduction
The development of mature B-lymphocytes from multipotent progenitors in the bone marrow (BM)2 depends on an orchestrated transcription factor network. The understanding of this process has been facilitated by recent advancements in the isolation of early progenitor populations (1) as well as by analysis of gene expression patterns and in vivo protein-DNA interactions (2–4). The formation of the earliest B-cell committed progenitors is dependent on the transcription factor EBF1 (5, 6) as well as E2a encoded proteins (Tcf3) (7, 8) and FOXO1 (9) because in the absence of these factors, the expression of B-lineage genes is dramatically reduced in the lymphoid progenitors, and normal lineage restriction is disrupted (9, 10). Commitment to B-lineage development is associated with the expression of the transcription factor PAX5, known to be of critical importance for restriction of alternative cell fates (11–13). However, in contrast to what is observed in the absence of EBF1 and E2A proteins, lack of PAX5 has a modest effect on the transcription of B-lineage genes in the earliest progenitors (14–16). This has resulted in the establishment of a concept postulating that although EBF1 and E2A are critical for B-cell specification, this process is linked to stable commitment through the activation of PAX5.
Although the role of lineage specific transcription factor networks in development has been rather well established, the direct link between these regulatory cues and human leukemia is now becoming an area of intense investigation. This is because detailed mapping of genetic changes in human B-cell malignancies has revealed that mutations in genes encoding key regulatory proteins, such as PAX5, EBF1, and E2a encoded proteins, can be found in a large fraction of the pediatric B-progenitor acute lymphoblastic leukemias (17). These mutations appear to be heterozygous, and thus it has been suggested that the impact of these mutations depends on a reduction of functional transcription factor dose, an idea supported by the finding that leukemia formation is enhanced in mice expressing a constitutively active STAT5 protein in combination with the loss of one functional allele of either Pax5 or Ebf1 (18). Furthermore, low levels of PAX5 expression in hematopoietic progenitors result in an expansion of cells expressing a combination of myeloid and lymphoid genes similar to what can be observed in biphenotypic leukemia (19). Functional transcription factor dose is also of crucial importance in normal B-cell development, where reduced levels of E-proteins (E2A, HEB, and E2-2) (20) or loss of one allele of Ebf1 alone or in combination with E2a or Runx1 results in disturbed B-cell development (5, 21–23). Hence, transcription factor dose is of critical importance for malignant transformation in leukemia as well as normal B-cell differentiation, creating a link between development and disease.
We here report an analysis of B-cell development in mice carrying heterozygote mutations in critical transcription factors. Although E2a gene dosage is important for B-cell specification, the loss of one allele of Ebf1 instead appears to be of importance for the normal expansion of already committed progenitor cells. We believe that our findings have implications not only for normal B-cell development but also for the molecular understanding of leukemia formation.
EXPERIMENTAL PROCEDURES
Animal Models
Pax5+/− (14), Ebf1+/− (5), E2a+/− (24), and reporter mice carrying a hCD25 reporter under the regulatory elements of the Lambda5 (λ5, Igll1) promoter (25) were all on C57BL/6 background. Bone marrows and spleens were harvested from mice aged 7–13 weeks. Adoptive transfers were performed as described previously (16). Animal procedures were performed with consent from the local ethics committee at Linköping University (Linköping, Sweden).
FACS Staining and Sorting of Hematopoietic Cells
For analysis and cell sorting of progenitor bone marrow cells, CD16/CD32 (FC)-blocked (Clone 93, eBioscience) cells were stained with antibodies against lineage markers CD11b (M1/70), GR1 (RB6-8C5), TER119 (Ter119), CD3 (17A2, BD Pharmingen), CD11c (N418), NK1.1 (PK136), CD19 (1D3), and CD45R/B220 (RA3-6B2). Further staining with KIT (2B8), SCA-1 (E13-161.7), IL7R (A7R34), FLT3 (A2F10), Ly6D (49-H4, BD Pharmingen), and propidium iodide (Invitrogen). All antibodies were purchased from BioLegend unless stated otherwise. For progenitor isolation, bone marrow cells were subjected to magnet-activated cell sorting column enrichment of KIT+ cells using anti-CD117 immunomagnetic beads (Miltenyi Biotec) prior to antibody staining. Analysis and cell sorting were performed on a BD FACSAriaTM cell sorter (BD Biosciences). Gates were set according to fluorescence minus one controls.
For population analysis, equal cell numbers of FC-blocked cells were stained with the following antibody combinations: progenitors, as stated above without column enrichment; B-cells, lineage markers CD11b (M1/70), GR1 (RB6–8C5), TER119 (Ter119), CD3 (17A2), CD11c (N418), and NK1.1 (PK136) and further with CD19 (ID3), CD45R/B220 (RA3–6B2), CD43 (S7), IgM (RMM-1), and IgD (11-26, eBioscience, San Diego, CA). Dead cells were excluded with 7-aminoactinomycin D (7-AAD; Sigma), and analysis was performed with a BD FACSCantoII analyzer (BD Biosciences).
Ex Vivo Analysis of Cell Cycle Status in B-cell Progenitors
Cells stained for lineage, CD19, CD43, IL2Rα (CD25), and IgM were fixated and permeabilized with the Cytofix/Cytoperm kit according to the manufacturer's instructions (BD Biosciences) and further stained with Ki-67 antibody (BD Biosciences) and 4′,6-diamidino-2-phenylindole (DAPI; Invitrogen). Gates for Ki-67 staining were based on isotype control antibody. All gates were set according to fluorescence minus one controls. Analysis was performed on a FACS Aria Special Order SystemTM (BD Biosciences).
In Vitro Evaluation of Natural Killer (NK)- and T-lineage Potentials
For evaluation of NK- and T-cell potential, cells were deposited (using FACSAria) directly into 96-well plates containing preplated (2000 cells/well) stroma cells. T-cultures (on OP9Delta stroma layers) were supplemented with 10 ng/ml KIT ligand, 10 ng/ml Fms-like tyrosine kinase 3 ligand (FLT3L), and 10 ng/ml interleukin-7. NK cultures (on OP9 stroma layers) were supplemented with the same cytokines as the OP9Delta cultures, with the addition of 20 ng/ml interleukin-15 and 40 ng/ml interleukin-2. All cytokines were acquired from Peprotech (Rocky Hill, NJ). Cultures were substituted with fresh cytokines after 7 days. OptiMEM supplemented with 10% heat-inactivated fetal calf serum, 25 mm HEPES, 50 μg/ml Gentamicin, and 50 μm β-mercaptoethanol was used for maintaining the OP9/OP9Delta stroma cell lines (26) as well as for the cocultures.
Cocultures were evaluated by FACS staining with CD19 (ID3), NK1.1 (PK136), CD11c (N418), and 7-AAD for NK OP9 cocultures and CD19 (ID3), CD90.2/Thy1.2 (53-2.1), CD3 (17A2), and 7-AAD for T OP9Delta cocultures. All cocultures were analyzed at day 14 with a BD FACSCantoII analyzer (BD Biosciences).
In Vitro Evaluation of Myeloid Potential
We have modified a previously described method to evaluate myeloid potential (27). In brief, cells were directly sorted to a concentration of 1 cell/20 μl of medium OptiMEM (supplemented as above) and 25 ng/ml KIT ligand, 25 ng/ml FLT3L, 25 ng/ml murine thrombopoietin/megakaryocyte colony-stimulating factor, 10 ng/ml interleukin-3, 25 ng/ml murine granulocyte colony-stimulating factor, and 25 ng/ml murine granulocyte/macrophage colony-stimulating factor, and 20 μl of cell suspension were plated into each well (Nunc Minitrays). Wells were scored after 5 days (using an inverted light microscope) to estimate clonal growth and clone size.
Quantitative and Single Cell RT-PCR
Quantitative RT-PCR analysis of sorted cells was performed as described previously (27). Assays-on-DemandTM probes (Applied Biosystems, Foster City, CA) used were as follows: Hprt, Mm00446968_m1; Pax5, Mm00435501_m1. Multiplex single cell RT-PCR analysis was performed as described previously (27). Multiplex PCR primers used were as follows: Hprt, GGGGGCTATAAGTTCTTTGC (primer 1), GTTCTTTGCTGACCTGCTGG (primer 2), TGGGGCTGTACTGCTTAACC (primer 3), and TCCAACACTTCGAGAGGTCC (primer 4); Pax5, CTACAGGCTCCGTGACGCAG (primer 1), ATGGCCACTCACTTCCGGGC (primer 2), GTCATCCAGGCCTCCAGCCA (primer 3), and TCTCGGCCTGTGACAATAGG (primer 4); λ5/IgII1, AGTTCTCCTCCTGCTGCTGC (primer 1), GGGTCTAGTGGATGGTGTCC (primer 2), CAAAACTGGGGCTTAGATGG (primer 3), and CCCACCACCAAAGACATACC (primer 4); Pou2af1/Ocab, ACGCCCAGTCACATTAAAGAAG (primer 1), AGCCAGTGAAGGAGCTACTGAG (primer 2), ATGTTCCCTCCTCTGTCACTGT (primer 3), and CTGTCACTGTGGAAGCAGAAAC (primer 4); Flt3, TCTCAATTCAGGTGGCGGTG (primer 1), GCTGTGAAAAAGAAGCTCTCATGTC (primer 2), ACCAGGCATGCTGGAATTTG (primer 3), GAGCTGATCCAAGGGCGG (primer 4); Cd79α/Mb1, CCTCCTCTTCTTGTCATACG (primer 1), AAACAATGGCAGGAACCC (primer 2), TGATGATGCGGTTCTTGG (primer 3), GAACAGTCATCAAGGTTCAGG (primer 4). Primers 1 and 4 constitute the outer primer pair, whereas primers 2 and 3 constitute the inner nested primer pair.
Affymetrix Gene Expression and Data Analysis
Cells were sorted directly to RLT buffer with 2-mercaptoethanol, and RNA was extracted from purified adult BM subsets as described previously (28). RNA was labeled and amplified according to the AffymetrixTM GeneChip Expression Analysis Technical Manual and hybridized against Affymetrix gene expression array chip mouse genome 430 2.0. Chips were scanned using a GeneChipTM Scanner 3000 (GEO accession no. GSE51385). Probe level expression values were calculated using RMAexpress, and further analysis was done using dChip (29).
VDJ Recombination Analysis
Amplification of rearranged DNA segments was based on the use of degenerated heavy chain variable segment (VH-gene) family primers (30) and nested primers in the J-segments. The sorted cells (total number of CD43low/negIgM− pre-B-cells from one femur) were lysed and transferred directly to the PCR, at a density of 50,000 cells/50 μl of PCR. After the primary PCR of 15 cycles using biotinylated J-primers, the products were purified on streptavidin-coated beads, and the obtained products were then subjected to a second PCR using the same heavy chain variable segment but nested J-primers at a density of 200,000 input cells/50 μl of PCR (pooled from the primary PCR). The secondary PCRs were pooled and gel-purified and used for construction of single indexed libraries for high throughput sequencing analysis, using an Illumina True Seq kit. Sequencing was performed using a MiSeq benchtop sequencer and a 500-cycle kit (Illumina, San Diego, CA).
Biotinylated Primers were as follows: J4AS1, AGACCTGGAGAGGCCATTCTTACC; J3AS1, GAATGGGAGAAGTTAGGACTCACC; J2AS1, GAATAGAAGAGAGAGGTTGTAAGG; J1AS1, CAGCTTACCTGAGGAGACGGTGACC. Inside primers were as follows: J4AS2, GAGGTTCCTTGACCCCAGTAGTCC; J3AS2, ACCTGCAGAGACAGTGACCAGAGTC; J2AS2, CACCTGAGGAGACTGTGAGAGTGG; J1AS2, AGGAGACGGTGACCGTGGTCCCTGTG. V-family primers were as follows: Vh558, TCCARCACAGCCTWCATGCARCTCARC; Vh7183, AAGAASAMCCTGTWCCTGCAAATGASC; VhQ52, GACTGARCATCASCAAGGACAAYTCC. The sequences are presented 5′ to 3′. Degenerated nucleotide positions are coded as follows: R represents A or G; Y represents C or T; S represents C or G; M represents A or C; K represents G or T; W represents A or T; and B represents C, G, or T. The script used for data analysis is distributed upon request.
Generation of Tamoxifen-dependent Pro-B-cell Lines
For the generation of tamoxifen-inducible cell lines, Ebf1-deficient BM cells (5) were transduced with retroviruses encoding either an EBF1-estrogen receptor fusion protein (EBF1-ER) (31) or full-length EBF1. The transduced progenitors were expanded in tamoxifen (0.5 μm)-supplemented medium as CD19+ cells on OP9 stroma cells.
RESULTS
E2a Dose Is Critical for Normal B-cell Specification
In order to understand the developmental disruptions observed in mice carrying heterozygote mutations in crucial B-lineage transcription factors, we analyzed the formation of early progenitors in Pax5+/−, E2a+/−, and Ebf1+/− as well as in Ebf1+/−E2a+/− transheterozygote mice. We were unable to detect any significant impact of heterozygote loss of either Pax5, E2a, or Ebf1 on the earliest lineage negative Lin−SCA-1highKIThigh (LSK) cells (Fig. 1A), whereas we confirmed an important role for E2a dose in the formation of the FLT3highLSK, lymphoid-primed multipotent progenitor (LMPP) compartment (32–34) (Fig. 1A). Analysis of the Lin−SCA-1low/intKITlow/intFLT3+IL7R+ lymphoid progenitor (CLP) population (35, 36), revealed that the loss of one allele of Ebf1 resulted in a significant increase in the relative frequency of these cells (Fig. 1B). In order to investigate the composition of the early lymphoid restricted compartments further, we investigated the expression of Ly6D within the CLP population (8, 37). Ly6D is expressed on a subpopulation of the classical CLP that retain B-lineage potential but display reduced NK- and dendritic cell (DC)-lineage potential in vivo and in vitro as well as a reduced T-cell potential in vivo (8, 16). The frequency of Ly6D− cells was reduced as compared with Wt in mice carrying one inactivated allele of E2a (Fig. 1B). The relative frequency of Ly6D+ cells was not significantly changed in E2a+/− mice; however, the loss of one allele of Ebf1 resulted in an increase of this population (Fig. 1B).
FIGURE 1.

Reduced E2a dose results in impaired development of early progenitors. A, diagrams showing the percentages or absolute numbers of phenotypic hematopoietic progenitor cells in Wt, Pax5+/−Ebf1+/−, E2a+/−, or Ebf1+/−E2a+/− mice of the total number of propidium iodide negative (live) cells in mouse BM. LSK cells are defined as Lin-SCA-1highKIThigh cells, while LMPPs are defined as FLT3highLSK cells. B, CLPs are identified as Lin−SCA-1low/intKITlow/intFLT3+IL7R+. These cells were then further subdivided based on the expression of Ly6D on the cell surface. Each dot represents one mouse, and the data are presented as median (horizontal line) ± interquartile range. Statistical analysis was performed using the Mann-Whitney U test. *, p < 0.05; **, p < 0.01; ***, p < 0.001; ****, p < 0.0001.
In order to investigate the impact of transcription factor dose on early B-lymphoid progenitors, we analyzed the pro-B-cell (Lin−B220+CD19+CD43highIgM−) compartment in mice carrying heterozygote mutations in the Ebf1 and/or E2a genes (Fig. 2A). Although this population was comparable with Wt in mice lacking one allele of Ebf1 (Ebf1+/−), it was reduced in mice lacking one allele of E2a (E2a+/−). Mice carrying combined heterozygote mutations of the E2a and either the Ebf1 or Pax5 (Pax5+/−) genes did not display any reduction in cell numbers as compared with E2a+/− mice.
FIGURE 2.
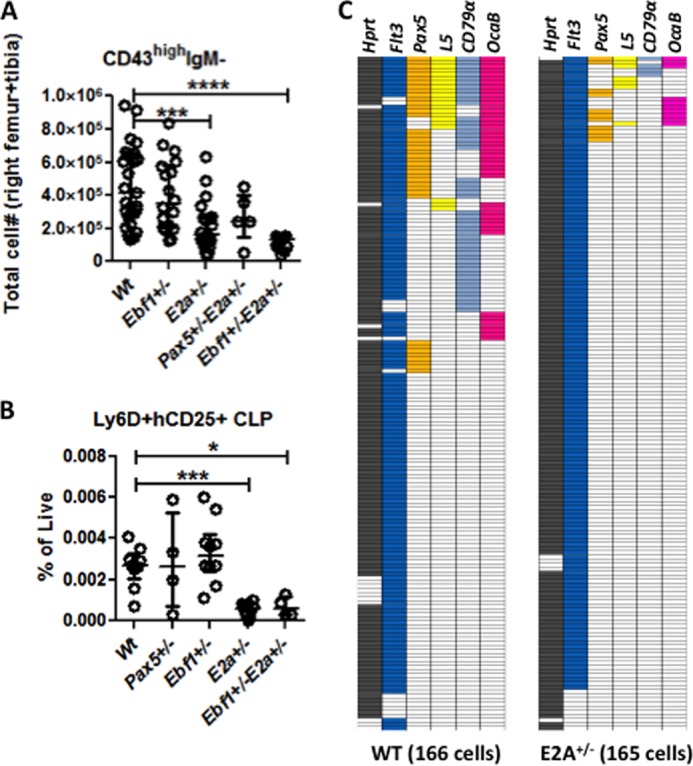
Reduced E2a dose results in impaired B-lineage specification. A, diagram displaying the absolute numbers of 7-AAD− pro-B-cells (Lin−B220+CD19+CD43highIgM−) in BM from Wt, Ebf1+/−, E2a+/−, Pax5+/−E2a+/−, or Ebf1+/−E2a+/− mice. B, diagrams showing the percentage of phenotypic Lin−SCA-1low/intKITlow/intFLT3+IL7R+ CLPs expressing a λ5 promoter-regulated human CD25 (hCD25) reporter transgene in mice of the indicated genotype. Each dot in A and B represents one mouse. Data are presented as median (horizontal line) ± interquartile range. Statistical analysis was performed using the Mann-Whitney U test. C, a color-coded panel displaying data collected by single cell multiplex RT-PCR analysis of Lin−SCA-1low/intKITlow/intFLT3+IL7R+ (CLPs) sorted from Wt or E2a+/− mice. Each horizontal line of the boxes represents a single investigated cell. A colored box indicates that an RT-PCR product from a given gene could be detected on an ethidium bromide-stained agarose gel. Statistical analysis was performed using Fisher's exact test (Table 1). *, p < 0.05; ***, p < 0.001; ****, p < 0.0001.
The reduction of pro-B-cell numbers in the E2a+/− mice suggested that reduced E2a dose results in a developmental disruption at an early progenitor stage, before the expression of CD19 on the cell surface. Within the Ly6D+ compartment, it is possible to detect cells with an activated B-lineage transcriptional program reflected in the expression of the surrogate light chain gene Lambda5 (λ5, Igll1) (27, 37), and in order to investigate B-lineage specification in progenitors from the mutant mice, we crossed E2a- and Ebf1-deficient mice to a reporter mouse carrying a hCD25 reporter gene under the regulatory elements of the λ5 promoter (25). Loss of one allele of E2a resulted in a 5-fold reduction of reporter-expressing CD19− progenitor cells, whereas the combined monoallelic loss of Ebf1 and E2a did not enhance the phenotype as compared with E2a+/− mice (Fig. 2B). In order to further investigate the dependence on E2a dose for B-lineage specification, we performed single cell multiplex RT-PCR on CLPs from Wt and E2a+/− mice (Fig. 2C). Although we noted comparable frequencies of cells with detectable Flt3 expression, the frequency of cells expressing Pax5 was reduced from 24.1% in the Wt to 6.7% (Table 1) of the E2a+/− cells (p < 0.0001). Reductions were also observed in the frequency of cells expressing detectable levels of λ5 (p = 0.0167), Mb1 (p < 0.0001), or Ocab (p < 0.0001) in the E2a+/− as compared with Wt mice. These data suggest that the E2a dose is critical for B-lineage specification.
TABLE 1.
Reduced E2a dose results in impaired B-lineage specification
The table displays data collected by single cell multiplex RT-PCR analysis of Lin−SCA1low/intKITlow/intFLT3+IL7R+ (CLPs) sorted from Wt or E2a+/− mice. The percentage indicates the fraction of cells generating an RT-PCR product from a given gene that could be detected on an ethidium bromide-stained agarose gel. The p values were determined by Fisher's exact test. CI, confidence interval. NS, not significant.
| mRNA | Wt (% of positive cells) | E2a+/− (% of positive cells) | Odds ratio | p value | 95% CI |
|---|---|---|---|---|---|
| Hprt | 91.6 | 96.4 | 0.9 | NS | 0.7–1.2 |
| Flt3 | 92.2 | 91.7 | 1.0 | NS | 0.7–1.3 |
| Ebf1 | 77.7 | 82.4 | 0.9 | NS | 0.6–1.3 |
| Pax5 | 24.1 | 6.7 | 3.6 | 0.0001 | 1.7–7.2 |
| L5 | 12.7 | 4.2 | 2.9 | 0.0167 | 1.2–7.2 |
| Mb1 | 30.1 | 2.4 | 12.4 | <0.0001 | 4.3–35 |
| Ocab | 27.1 | 6.1 | 4.4 | <0.0001 | 2.1–9.1 |
E2a Dose Is Critical for Preserved B-lymphoid Potential in Early Lymphoid Progenitors
Because B-cell lineage restriction depends on transcription factor networks, one possible consequence of reduced transcription factor dose is reduced lineage fidelity. In order to investigate the functional potential of progenitor populations, we cultured single cells under conditions driving development toward defined hematopoietic cell fates. Culturing single LMPPs (Fig. 3A) or Ly6D− CLPs (Fig. 3B) under conditions stimulating growth of myeloid cells revealed that although LMPPs from both Wt and transcription factor heterozygote mutant mice generated large colonies of cells, we were unable to detect any major differences in myeloid lineage restriction in Ly6D− CLPs from any of the heterozygote mutant mice (Fig. 3, A and B), suggesting that E2a dose is not critical for lympho/myeloid lineage restriction. The expression of Ly6D is normally associated with a reduction in the ability of lymphoid progenitors to develop into cells of NK- and DC-lineage (8, 37). In order to investigate if the Ly6D+ cells generated in the presence of reduced levels of transcription factors displayed a proper lineage restriction, we incubated single Ly6D+λ5(hCD25)− progenitors collected from Wt, Pax5+/−, Ebf1+/−, E2a+/−, and Ebf1+/−E2a+/− mice under conditions permissive for the development of B-, DC-, and NK-lineage cells from multipotent progenitors. Flow cytometric analysis of the cellular content of colonies generated from seeded Wt, Pax5+/−, or Ebf1+/− cells revealed that 17, 12, and 23%, respectively, of the colonies contained cells expressing NK1.1 or CD11c in addition to cells expressing CD19 (Fig. 3C). Seeding E2a+/− or Ebf1+/−E2a+/− cells resulted in 61 and 74%, respectively, of the generated colonies containing NK1.1- or CD11c-expressing cells (p < 0.0001 for Wt versus E2a+/− or E2a+/−Ebf1+/−). These cells displayed a reduced cloning frequency (Fig. 3C) (p < 0.0001 for Wt versus E2a+/− or E2a+/−Ebf1+/−) and impaired ability to generate colonies containing CD19+ cells (p < 0.0001 for Wt versus E2a+/− or E2a+/−Ebf1+/−). These data suggest that although the E2a dose is critical for the generation of functional, lineage-restricted B-cell progenitors, the Ebf1 or Pax5 dose has a minor impact on this process.
FIGURE 3.

Reduced E2a dose results in impaired B-lineage potential but retained lymphoid lineage restriction. Diagrams show the cloning frequency and estimated clone size 5 days after seeding of 184 Wt, 187 Ebf1+/−, 153 E2a+/−, and 159 Ebf1+/−E2a+/− single LMPPs (A) or 144 Wt, 143 Ebf1+/−, 144 E2a+/−, and 143 Ebf1+/−E2a+/− single Ly6D− CLPs (B) in Terasaki plates under myeloid conditions. Cells were collected from two independent experiments. C, diagram of the cloning frequency and the cellular content of clones generated from single Ly6D+hCD25−Lin−SCA-1low/intKITlow/intFLT3+IL7R+ cells after 14 days of culture under conditions permissive for B/DC/NK-cell development. The composition of the cultures was determined by flow cytometry using CD19, Cd11c, and NK1.1 as markers for B-, DC-, and NK-cells, respectively. The data are based on seeding of 576 Wt, 384 Pax5+/−, 288 Ebf1+/−, 480 E2a+/−, and 480 Ebf1+/−E2a+/− cells. The data were collected from four independent experiments. Statistical analysis was performed using Fisher's exact test. D, diagrams displaying the cloning frequency and cellular composition of single cell cultures from either 248 Wt, 192 Ebf1+/−, or 380 Pax5+/− Lin−SCA-1low/intKITlow/intFLT3+IL7R+ cells expressing a λ5 promoter-regulated human CD25 (hCD25) reporter transgene incubated for 14 days on OP9Delta stroma cells to stimulate T-cell development. The data are collected from two independent experiments. Statistical analysis was performed using Fisher's exact test. Error bars, S.E.
In order to investigate functional consequences of reduced Ebf1 or Pax5 levels on the earliest specified B-cell progenitors, we sorted Ly6D+hCD25+ lymphoid progenitors and cultured single cells on OP9Delta stroma cells under conditions permissive for T-cell development. The cloning frequency for Wt progenitors approached 50%, with 90% of the cells generating clones composed of only CD19+ cells (Fig. 3D). Seeding cells from Pax5+/− or Ebf1+/− mice resulted in lower cloning frequency (p < 0.0001 for Wt versus Pax5+/− and Ebf1+/−) and an increased frequency of colonies containing Thy1.2+CD3+ cells. However, considering the lower cloning efficiency of Ebf1+/− cells, the increase in frequency of colonies containing T-lineage cells in relation to the number of seeded cells only reached statistical significance using progenitors from Pax5+/− mice (p = 0.0003). This reveals that reduction in either the Pax5 or Ebf1 dose in specified B-cell progenitors results in impaired functional B-cell potential (p < 0.0001 for Wt versus either Ebf1+/− or Pax5+/−), but only heterozygote loss of Pax5 results in a significant increase in lineage plasticity in vitro.
Ebf1 Dose Is Critical for Normal Development of Pre-B- and Mature B-lineage Cells
Investigating the early pre-B-cell compartment (Lin−B220+CD19+CD43low/negIgM−), the loss of one allele of either Ebf1 or E2a resulted in a 2–3-fold reduction of cell numbers as compared with Wt mice (Fig. 4A). In line with previous observations (23), the combined deletion of Ebf1 and E2a resulted in a 6-fold reduction in pre-B-cell numbers, significantly lower than the reduction observed in either Ebf1+/− or E2a+/− mice. In contrast, no synergistic reduction of pre-B-cell numbers was observed in mice carrying transheterozygote mutations in the E2a and Pax5 genes (Fig. 4A). Similar reductions in cell numbers were observed in the IgM+ (Lin−B220+CD19+CD43low/negIgM+) (Fig. 4B) compartment. Heterozygote deletion of either Ebf1 or E2a also resulted in a reduced fraction of CD19+CD43low/negIgM+IgD+ B-cells in the spleen (Fig. 4C).
FIGURE 4.

Loss of one allele of Ebf1 results in impaired development of B-lymphoid cells. Diagrams display the absolute numbers of 7-AAD− pre-B-cells (Lin−B220+CD19+CD43low/negIgM−) (A) or IgM+ cells (Lin−B220+CD19+CD43low/negIgM+) (B) in BM from Wt, Ebf1+/−, E2a+/−, Pax5+/−E2a+/−, or Ebf1+/−E2a+/− mice and Lin−B220+CD19+CD43low/intIgM+IgD+ spleen cells (C) from Wt, Pax5+/−, Ebf1+/−, or E2a+/− mice. D, diagrams displaying the percentage of CD19+ cells among the total number of CD45.2+ cells in the peripheral blood of mice transplanted with either Wt or Ebf1+/− fetal liver after 4, 9, and 16 weeks, as indicated. Each dot in the panel represents one mouse, and the average values are indicated by horizontal lines. Statistical analysis was performed using the Mann-Whitney U test. E, diagram displaying quantitative RT-PCR data to investigate PAX5 expression in sorted pre-B (Lin−B220+CD19+CD43low/negIgM−) cells from Wt or Ebf1+/− mice. The data were normalized to the expression of Hprt and collected from seven individually sorted Wt and 5 Ebf1+/− mice analyzed in triplicate quantitative RT-PCRs. Each dot in the panel represents one mouse, and the data are presented as median (horizontal line) ± interquartile range. Statistical analysis was performed using a Mann-Whitney U test. F, a correlation matrix of eight samples made by dCHIP software using >1.2-fold differentially expressed genes between Wt and Ebf1+/− pre-B-cells and between Wt and Ebf1+/− pro-B-cells. The correlation is calculated and visualized by color (red and blue) in the matrix. The data were generated by hybridization of cRNA to AffymetrixTM microarrays and collected from two independently sorted populations. *, p < 0.05; **, p < 0.01; ****, p < 0.0001.
The impaired ability of Ebf1+/− progenitors to generate B-lineage cells was also reflected in a reduced ability to generate B-lymphoid cells after transplantation (Fig. 4D). During analysis of peripheral blood cell composition 4 weeks after transplantation of Wt or Ebf1+/− CD45.2+ fetal liver cells to CD45.1+ hosts, we noted a lower level of B-cell reconstitution from Ebf1+/− fetal livers than what we observed for Wt fetal liver cells. This effect was lost over time, and 16 weeks after transplantation, the frequency of donor (CD45.2+) CD19+ cells generated from Ebf1+/− fetal liver was comparable with that observed for Wt cells. Hence, heterozygote loss of Ebf1 results in a reduced ability to generate mature B-lineage cells.
Loss of One Allele of Ebf1 Impairs Pre-B-cell Expansion
The enhanced phenotype upon combined reduction of Ebf1 and E2a levels has been suggested to reflect a disrupted genetic program with reduced levels of PAX5 (23); however, quantitative PCR analysis of Ebf1+/− pre-B-cells did not reveal any loss of Pax5 expression (Fig. 4E), arguing against a similar explanation for the reduction of B-cell progenitor populations in Ebf1+/− mice. Hence, to better understand the underlying cause of the reduced pre-B-cell compartment in Ebf1+/− mice, we sorted pro-B- as well as pre-B-cells from Wt and Ebf1 heterozygote mutant mice and performed Affymetrix-based microarray gene expression analysis. Although the overall gene expression patterns as well as Pax5 expression in Wt and Ebf1+/− pro-B-cells were similar (Fig. 4F), gene set enrichment analysis of the microarray data suggested a reduced expression of cell division (p < 0.001) and mitosis (p < 0.001) genes in the Ebf1+/− pre-B-cells as compared with their Wt counterparts (Table 2). This, in combination with rather normal expression of B-lineage genes in Ebf1+/− pre-B-cells, opens up the possibility that the phenotypic loss of pre-B-cells in Ebf1+/− mice could be a result of reduced expansion of progenitors rather than a differentiation block.
TABLE 2.
Gene function enrichment analysis shows changes of the genes for cell division and mitosis in pre-B-cells from Ebf1+/− mice
The table displays the average relative expression values as estimated by dCHIP analysis for a set of B-lineage genes in sorted pre-B (Lin−B220+CD19+CD43low/negIgM−) cells from Wt or Ebf1+/− mice. The lower part of the table displays gene ontology analysis of microarray data from pre-B-cells from either Wt or Ebf1+/− mice. The data were generated by hybridization of cRNA to AffymetrixTM microarrays and collected from two independently sorted populations. The analysis was done using dCHIP based on the genes that are 1.5-fold differentially expressed between Wt and Ebf1+/− pre-B-cells.
| mRNA | Wt CD43low/neg IgM− | Ebf1+/− CD43low/negIgM− | Change |
|---|---|---|---|
| -fold | |||
| B-lineage genes | |||
| Ebf1 | 1459 | 973 | −1.5 |
| Cd79b | 6879 | 5450 | −1.3 |
| Rag2 | 223 | 100 | −2.2 |
| Vpreb3 | 3205 | 1775 | −1.8 |
| Rag1 | 175 | 106 | −1.6 |
| Pax5 | 131 | 118 | −1.1 |
| Vpreb1///Vpreb2 | 64 | 56 | −1.1 |
| CD19 | 2580 | 2397 | −1.1 |
| Blnk | 2549 | 2301 | −1.1 |
| IgH-V J558 | 1407 | 336 | −4.2 |
| Il2ra | 46 | 23 | −2.0 |
| Il7ra | 1123 | 691 | −1.6 |
| Gene ontology cell division (p = 0.000388) | |||
| CcnB1-rs1 | 56 | 21 | −2.6 |
| Cdc45l | 60 | 22 | −2.7 |
| Cdc6 | 80 | 27 | −3.0 |
| Cyclin B1 | 149 | 66 | −2.3 |
| Racgap1 | 70 | 25 | −2.8 |
| Incemp | 99 | 40 | −2.5 |
| Zc3hc1 | 106 | 55 | −1.9 |
| Kntc1 | 78 | 28 | −2.8 |
| Lig4 | 344 | 102 | −3.4 |
| Ube2c | 181 | 68 | −2.6 |
| Rasgef1b | 9 | 42 | −4.4 |
| Gene ontology mitosis (p = 0.000479) | |||
| CcnB1-rs1 | 56 | 21 | −2.6 |
| Cdc6 | 80 | 27 | −3.0 |
| Racgap1 | 70 | 25 | −2.8 |
| Incemp | 99 | 40 | −2.5 |
| Zc3hc1 | 106 | 55 | −1.9 |
| Kntc1 | 78 | 28 | −2.8 |
| Plk1 | 83 | 35 | −2.3 |
| Ube2c | 181 | 68 | −2.6 |
The gene expression data suggested that pre-B-cells from Ebf1+/− mice displayed reduced expression of IL2 receptor α-chain (IL2Rα, CD25), a gene proposed to be expressed after functional heavy chain rearrangement on late proliferating pre-B-cells (38, 39). In line with these data, ex vivo analysis of the IL2Rα+CD43low/negIgM− pre-B-cell population suggests that about 90% of these cells are in an active cell cycle (Fig. 5A). In line with the data obtained from gene expression analysis, a reduction in IL2Rα expression on cells from Ebf1+/− mice was detectable in the IgM−pre-B-cell compartment because 46% of the Wt and 24% of the Ebf1+/−pre-B-cells expressed this marker (Fig. 5, B and C). A significant reduction of IL2Rα expression was also observed on IgM+ cells, where the frequency was reduced from 18% in the Wt to 4% in Ebf1+/− mice (Fig. 5, B and C). In order to identify the late surrogate light chain expressing pre-B-cells with an even higher accuracy, we used Ebf1+/− λ5 reporter mice to compare the presence of IL2Rα+hCD25+IgM− or IgM+ pre-B-cell compartments in Wt and Ebf1+/− mice (Fig. 5D). The relative percentages of these cells among the progenitor B-cells were significantly reduced in both the IgM+ and IgM− compartments, suggesting that the Ebf1 dose is important for normal formation of the IL2Rα+ late pre-B-cell compartment.
FIGURE 5.

Loss of one allele of Ebf1 results in reductions in IL2Rα-expressing late pre-B-cells. A, diagram showing the cell cycle status of IL2Rα+ pre-B-cells (Lin−B220+CD19+CD43low/negIgM−) from Wt BM based on expression of the intracellular proliferation marker Ki-67 and the DNA-staining dye DAPI. Cells negative for Ki-67 and with DAPI staining corresponding to that of a diploid cell were classified as being in G0. Expression of Ki-67 and a normal DNA amount identify cells in G1, whereas high DNA content in combination with Ki-67 expression identifies cells in S/G2/M phase. B, representative histograms displaying expression of IL2Rα on Wt or Ebf1+/− pre-B- and IgM+-B-cells; C, diagrams indicating the frequency of cells (Lin−B220+CD19+CD43low/negIgM− or Lin−B220+CD19+CD43low/negIgM+) expressing IL2Rα on BM cells from Wt or Ebf1+/− mice. Each dot in the panels represents one mouse, and the data are presented as median (horizontal line) ± interquartile range. Statistical analysis was performed using the Mann-Whitney U test. D, diagrams displaying the frequency of IL2Rα, λ5 reporter double-positive cells in the B-cell progenitor compartments in the BM of Wt and Ebf1+/−. Each dot represents one mouse. Data are presented as median (horizontal line) ± interquartile range. Statistical analysis was performed using the Mann-Whitney U test. **, p < 0.01.
It has been reported that complete loss of Ebf1 results in increased apoptosis and a G1 arrest in pro-B-cells (40). In order to investigate if heterozygote loss of Ebf1 would have a similar impact on B-cell progenitors, we investigated the fraction of AnnexinV-positive cells from Wt or Ebf1+/− mice ex vivo. The percentage of AnnexinV+ cells was comparable in pro-B- as well as pre-B- or IgM+ B-lineage cells from both strains (Fig. 6A), suggesting that a full Ebf1 dose is not critical for cell survival. In order to investigate if the loss of one allele of Ebf1 was reflected in changes of cell cycle status of B-cell progenitors, we stained BM cells from Wt and Ebf1+/− mice for expression of surface markers as well as the intracellular proliferation marker Ki-67 and the DNA-staining dye DAPI. Approximately 50% of the Wt pro-B-cells resided in G1, whereas the fraction of these cells from Ebf1+/− mice was increased (Fig. 6B). This was also reflected in the fact that a smaller fraction of the pro-B-cells from Ebf1+/− mice resided in G0; however, consistent with a partial G1 block, we were unable to detect any significant difference in the frequency of cells in S/G2/M phase. In the pre-B-cell compartment, the apparent enrichment of cells in G1 in Ebf1+/− mice was no longer evident; rather, a trend toward a lower fraction of cells in G1 from the Ebf1+/− mice could be detected. We also noted a significantly reduced frequency of cells in S/G2/M phase (Fig. 6B) in Ebf1+/− mice. Hence, although the loss of one allele of Ebf1 does not have any major impact on cell survival, the reduced Ebf1 dose causes alterations in cell cycle dynamics in progenitor B-cell compartments.
FIGURE 6.
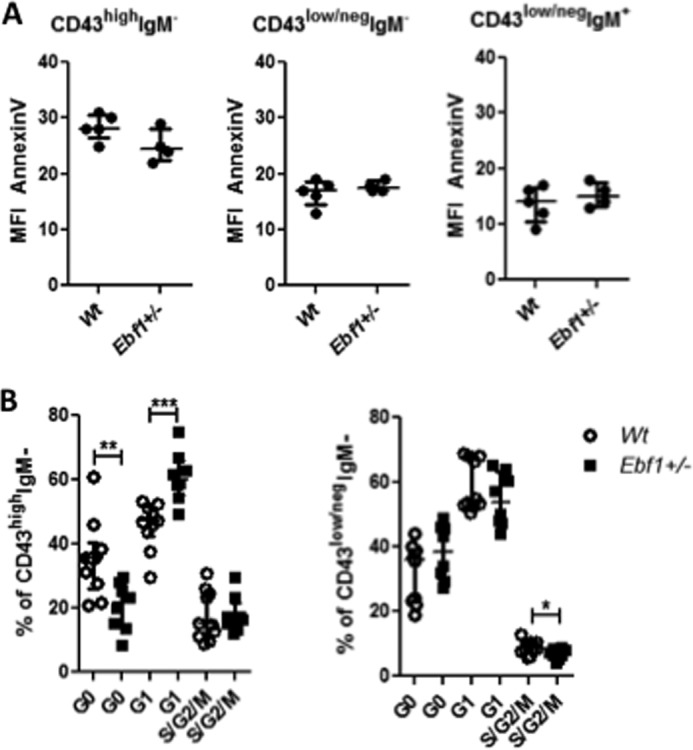
Heterozygote loss of Ebf1 results in disruption of cell cycle dynamics in early progenitor cells. A, diagrams indicating the median fluorescence intensity of AnnexinV on Pro-B (Lin−B220+CD19+CD43highIgM−), Pre-B (Lin−B220+CD19+CD43low/negIgM−), or IgM+ (Lin−B220+CD19+CD43low/negIgM+) BM cells from Wt or Ebf1+/− mice. B, cell cycle analysis of pro-B (Lin−B220+CD19+CD43highIgM−) and pre-B (Lin−B220+CD19+CD43low/negIgM−) cells from Wt and Ebf1+/− BM based on expression of the intracellular proliferation marker Ki-67 and the DNA-staining dye DAPI. Cells negative for Ki-67 and with DAPI staining corresponding to that of a diploid cell were classified as being in G0. Expression of Ki-67 and a normal DNA amount identify cells in G1, whereas high DNA content in combination with Ki-67 expression identifies cells in S/G2/M phase. Each dot in the panels represents one mouse. Data are presented as median (horizontal line) ± interquartile range. Statistical analysis was performed using the Mann-Whitney U test. *, p < 0.05; **, p < 0.01; ***, p < 0.001.
In order to directly investigate the impact of the functional Ebf1 dose on cell expansion, we generated B-cell lines by transduction of Ebf1-deficient BM cells with retroviruses encoding either EBF1-ER (31) or full-length EBF1. The transduced progenitors were expanded in tamoxifen-supplemented medium as CD19+ cells on OP9 stroma cells. Upon removal of tamoxifen, the EBF1-ER-transduced cells displayed a reduction in cell expansion, whereas this treatment had minimal impact on the growth of Ebf1−/− cells rescued by retroviral expression of conventional EBF1 (Fig. 7A). Hence, nuclear EBF1 is critical for normal expansion of B-cell progenitors in vitro. In order to investigate the functional impact of Ebf1 dose on the expansion of these cells, we titrated the amount of tamoxifen in the cultures (Fig. 7B). This resulted in a gradual reduction of cell growth in a dose-dependent manner, providing support for the idea that the level of nuclear EBF1 directly correlates with growth of B-cell progenitors in vitro.
FIGURE 7.
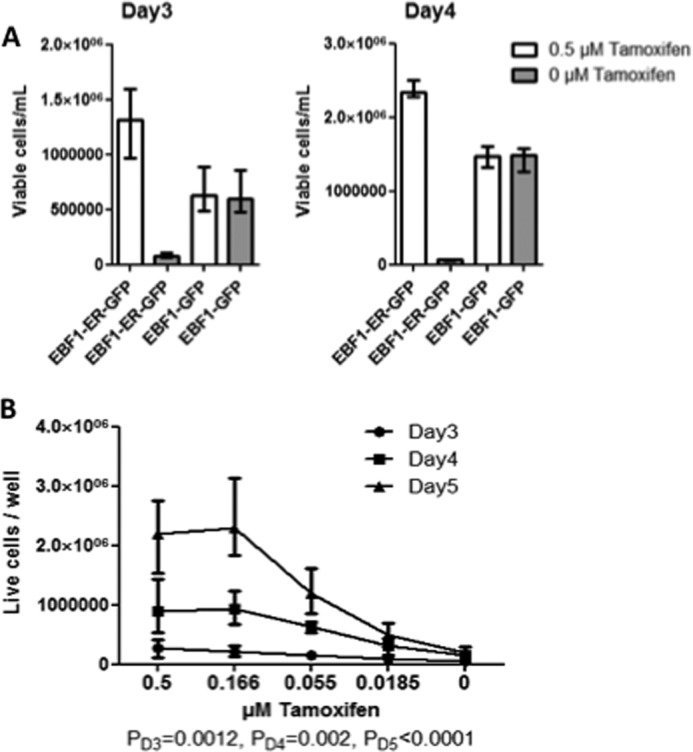
The dose of nuclear EBF1 regulates the expansion of B-cell progenitors. A, diagrams displaying the number of live cells after 3–4 days of culturing 100,000 B-cell progenitors generated from Ebf1−/− BM cells expressing either an EBF1-ER fusion protein or a full-length EBF1 protein in the presence or absence of 0.5 μm tamoxifen. The data are presented as medians ± interquartile range of three wells from two independent BM transductions (total of six wells). B, diagrams displaying the number of live cells after 3–5 days of culturing 5000 B-cell progenitors generated from Ebf1−/− BM cells expressing an EBF1-ER fusion protein in decreasing concentrations of tamoxifen. The data are collected from three wells from two independent BM transductions (total of six wells). Statistical analysis was performed using a Kruskal-Wallis test. Error bars, S.E.
Preserved Complexity of IgH Rearrangements in Mice Lacking One Allele of Ebf1
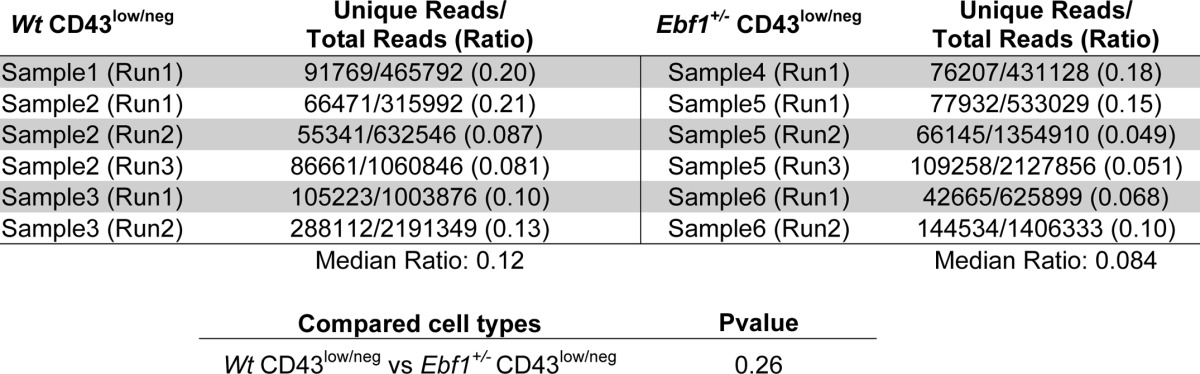
These data suggest that the loss of one allele of Ebf1 results in a reduced expansion of the late pre-B-cell compartment. This could be presumed to result in that the complexity of VDJ rearrangements should be comparable, although the absolute numbers of pre-B-cells are reduced in Ebf1+/− mice. In order to investigate the complexity of the immunoglobulin VDJ rearrangement pattern in Wt and Ebf1+/− mice, we sorted pre-B-cells from Wt and Ebf1+/− mice, amplified VDJ rearrangements by PCR, and performed deep sequencing of the generated amplicons. In order to investigate the complexity, we developed a script that allowed a comparison of the generated sequences, thereby allowing us to calculate the number of unique VDJ junctions in each sequencing run. The identification of the correctly amplified products was achieved by using only sequences containing a part of the J-region (antisense strand) not included in the primers in the mathematical analysis. The diversity was investigated in the region 30 base pairs upstream of the J-region to identify unique VDJ junctions. By dividing the number of unique sequences by the total number of VDJ sequences in a given run, we obtain a number reflecting the complexity of VDJ rearrangements in a given sample (Table 3). Analyzing six sequencing runs from three libraries of Wt pre-B-cells, the median number of unique sequences in relation to the total number of VDJ sequences was 0.120. The corresponding number in cells from Ebf1+/− mice was 0.084, a difference of no statistical significance. Hence, we were unable to detect any major difference in VDJ complexity of the pre-B-cell compartments in Wt and Ebf1+/− mice, providing an independent line of support for the theory that heterozygote loss of Ebf1 results in impaired expansion of the pre-B-cell compartment.
TABLE 3.
Heterozygote deletion of Ebf1 does not result in significantly decreased complexity in VDJ rearrangements in pre-B-cells
The table displays data from sequencing analysis of VDJ region complexity in the bone marrow compartment of pre-B-cells (Lin−B220−CD19+CD43low/negIgM−) from Wt and Ebf1+/− BM. The data indicate the number of reads containing a genomic J segment sequence and the number of unique sequences as judged by sequence analysis of 30 bp downstream of the genomic J segment. The data were collected from four mice (2 Wt and 2 Ebf1+/−), where the cells from each femur were sorted separately from each other. Cells from two bones from one Wt and one Ebf1+/− mouse and one bone from the second mouse of each genotype were used for the generation of three libraries from each phenotype. The libraries were analyzed in the indicated number of sequence runs. Statistical analysis was performed using the Mann-Whitney U test.
Reduced Ebf1 Dose Results in Impaired IL7 Response and Reduced Surface Expression of Pre-BCR on B-cell Progenitors
It has been reported that Ebf1−/− pro-B-cells respond poorly to IL7 (40), and to investigate how heterozygote loss of Ebf1 impacts the response to IL7, we incubated Wt and Ebf1+/− B-cell progenitors on OP9 stroma cells in decreasing amounts of externally supplied IL7 (Fig. 8). In the presence of high levels of IL7, we noted an ∼2-fold reduction in the number of viable cells after 6 days of cultivation. The effect of heterozygote Ebf1 mutation was more pronounced when the level of IL7 was reduced, suggesting that Ebf1+/− B-cell progenitors display a reduced response to IL7.
FIGURE 8.
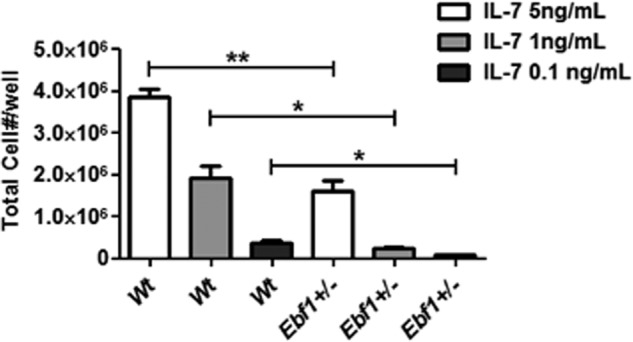
Loss of one allele of Ebf1 results in reduced IL7 response. Shown is a diagram displaying the number of live cells after 6 days of culturing 40,000 Wt or Ebf1+/− B-cell progenitors. Statistical analysis was performed using Student's t test. Error bars, S.E. *, p < 0.05; **, p < 0.01.
Although IL7 is an important regulator of the expansion of the progenitor B-cell compartment, expansion of cells undergoing positive selection for a functional Ig-heavy chain rearrangement has been suggested to involve a combined action of pre-BCR and IL7 signaling (41). One of the critical components of the pre-BCR is λ5 (Igll1), reported to be a direct target for activation by EBF1 (42). In order to investigate if reduced levels of Ebf1 would result in reduced transcription of the critical pre-BCR component λ5, we analyzed the expression of the λ5 promoter-controlled reporter gene (hCD25) in B-cell progenitors from Wt and Ebf1+/− mice (Fig. 9, A and B). Although the expression of the reporter construct was comparable on the CD43high progenitor cells, the expression in the CD43− pre-B and IgM+ cell compartment was significantly reduced. This is in line with the finding that loss of one allele of Ebf1 results in reduced expression of the surrogate light chain component λ5. The reduction in λ5 expression could potentially result in reduced pre-BCR expression levels on late pre-B-cells. To explore this possibility, we analyzed the frequency of pre-BCR+ cells as well as the medium expression of pre-BCR on these cells using an antibody recognizing a pre-BCR-specific epitope on the IgM molecule. This suggested that both the frequency of positive cells and the pre-BCR density on the positive cells are reduced in Ebf1+/− mice (Fig. 9C). A similar result was observed when we analyzed IgM density on pre-BCR+ cells because we noted a significant shift from IgMhigh to IgMlow cells in Ebf1+/− mice (Fig. 9D).
FIGURE 9.

Heterozygote deletion of Ebf1 results in a reduction of pre-BCR expression on B-cell progenitors. Representative histograms (A) and diagrams (B) display expression of a λ5 promoter-regulated human CD25 (hCD25) reporter transgene on B-lineage populations from Wt or Ebf1+/− mice. C, frequency of pre-BCR+ cells and median pre-BCR expression levels on (Lin−B220+CD19+CD43low/negIgM+) cells; D, expression levels of IgM on pre-BCR+ cells from Wt and Ebf1+/− BM. In the diagrams, each dot represents one mouse, and data are presented as median ± interquartile range. Statistical analysis was performed using the Mann-Whitney U test. *, p < 0.05; **, p < 0.01; ***, p < 0.001.
DISCUSSION
Transcription factor dose is shown to be important for the regulation of cell differentiation in a variety of model systems, one of the most striking being sex determination in Drosophila, where the dose of X-encoded transcription factors establishes a regulatory network that acts to determine the sex of the embryo (43). Dose-dependent regulation of cell fate has also been reported in the hematopoietic system, where high expression of PU.1 in multipotent progenitors results in the development of myeloid and, at lower levels, in the development of lymphoid lineage cells (44). Regulation of the functional levels of PU.1 is mediated by the transcriptional repressor GFI-1, which replaces PU.1 on autoregulatory elements in the PU.1 gene (45). Gfi-1 expression is regulated by the zinc finger transcription factor IKAROS (Ikzf1) (45), known to be important for lymphoid priming in early BM progenitors (46), suggesting that a balanced network of transcription factors is of crucial importance for development of the earliest lymphocyte progenitors. In the B-lineage, the enhanced phenotype observed upon combined heterozygote loss of E2a and Ebf1 (23) and the large number of shared target genes (2, 3) has led to the conclusion that they act synergistically to stimulate B-cell development. This could be a result of direct coordinated target gene activation; however, because E2A proteins appear to regulate the expression of EBF1 (2, 47, 48), the lack of lineage priming could be a result of reduced EBF1 levels in the CLP. Furthermore, E-proteins regulate FOXO1 expression in the CLP compartment (7). A lack of FOXO1 results in defective lineage priming in a manner similar to what is observed in EBF1-deficient progenitors (9). The ability of FOXO1 to bind potential regulatory elements in the Ebf1 gene and binding of EBF1 to regions in the FoxO1 gene suggest that these proteins act in a regulatory loop crucial for the specification of early B-cell progenitors (9). Hence, reduced levels of E2A proteins are likely to result in a disruption of this feedback loop, causing reduced expression of both EBF1 and FOXO1, leading to impaired B-lineage specification. This would be in line with the fact that E2a+/− mice display impairment in B-lineage priming already in CD19− progenitors. However, because we were unable to detect any synergistic effect of combined deletion of EBF1 and E2A on the formation of λ5-expressing progenitors or pro-B-cells (Fig. 2, A and B), we find it reasonable to propose that the synergistic effect is caused by a reduced number of primed cells in combination with reduced expansion capacity of pre-B-cells as a result of reduced EBF1 levels. Our analysis reveals that the loss of one allele of Ebf1 results in a reduction of CD19+IL2Rα+ B-cell progenitors (Fig. 5), and although the link between IL2Rα and cell proliferation recently was disputed because c-myc-expression was not evident in B220+CD43+IL2Rα+ cells (41), ex vivo analysis of the CD43low/negIL2Rα+ pre-B-cell population revealed that about 90% of these cells are in the active cell cycle (Fig. 5A). Mutations in λ5, IgM, or Rag-1 result in a similar phenotype with a reduction in or even loss of IL2Rα+ B-cell progenitors (39), suggesting that reduced levels of EBF1 may result in impaired pre-BCR signaling. Although we detect modest down-regulations of mRNAs encoding pre-BCR components in Ebf1+/− pre-B-cells, slight reductions in the expression of several genes in combination may combine to reduce the number of completely assembled pre-BCRs, resulting in an impaired expansion of the pre-B-cell compartment. It is also interesting to note that the response to IL7 appears to be reduced in Ebf1+/− B-cell progenitors because IL7 signaling has been reported to act in synergy with pre-BCR signaling to regulate pre-B-cell expansion. Another possible explanation could be that EBF1 itself is directly involved in the regulation of genes controlling cell proliferation. This idea is supported by the finding that the major category of EBF1 target genes identified by chromatin immunoprecipitation was genes encoding proteins with crucial functions in the regulation of basic biological processes in pre-B-cells (2). Hence, the role of stage specific transcription factors may reach beyond that of regulation of a defined set of lineage-restricted target genes.
A role for Ebf1 dose in the expansion of B-cell progenitors is also supported by the findings that Ebf1+/− mice display an accumulation of pro-B-cells in G1, consistent with the idea that deletion of the Ebf1 gene in B-cell progenitors results in a G1 block (40). In the more mature CD43low/neg pre-B-cells, the relative fraction of cells in G1 is rather reduced, and this, in combination with a reduced number of cells in S/G2, supports the idea that the loss of one allele of Ebf1 results in impaired expansion of these progenitor cells. It has been reported that ectopic expression of active STAT5 is insufficient to rescue the disturbed proliferation and cell survival in Ebf1+/− pro-B-cells; however, the finding that transgenic expression of constitutively active STAT5 collaborates with heterozygote loss of Ebf1 in the generation of B-cell leukemia in mouse models (18) indicates that reduced Ebf1 dose impacts cell proliferation and survival differently than a complete loss of Ebf1 function. This is also consistent with the finding that heterozygote loss of Ebf1 did not result in increased apoptosis, as previously reported for Ebf1-deficient progenitors (40). Hence, the function of reduced Ebf1 dose in malignant transformation may be complex and possibly a result of mechanisms other than impaired differentiation. Also interesting with regard to leukemia development is the finding that reduced transcription factor dose may result in lineage plasticity in B-cell progenitors. Although our functional analysis did not reveal any dramatic increase in lineage instability of B-lineage cells, it has been reported that monoallelic loss of Ebf1 leads to aberrant expression of NK-lineage genes in B-lymphoid progenitors (22). This indicates that alternative lineage programs cannot be properly silenced, and it should not be excluded that combined heterozygote deletions of Pax5 and Ebf1 may impact lineage commitment in a more dramatic manner than the heterozygote loss of either of these proteins alone. Hence, it appears as if reduced transcription factor dose may impact specification and expansion as well as lineage stability during B-cell development. Our data reveal that the impact of the transcription factor dose goes beyond a partial differentiation block, providing an extended insight into both normal and malignant blood cell development.
Acknowledgments
We thank our colleagues for help with transgenic mice and cell lines, and we also thank Liselotte Lenner and Linda Bergström for advice and assistance.
This work was supported by grants from the Swedish Cancer Society, the Swedish Research Council through project grants, and Hemato-Linné and the Faculty of Medicine at Linköping University.
- BM
- bone marrow
- 7-AAD
- 7-aminoactinomycin D
- NK
- natural killer
- LMPP
- lymphoid-primed multipotent progenitor
- CLP
- common lymphoid progenitors.
REFERENCES
- 1. Welinder E., Ahsberg J., Sigvardsson M. (2011) B-lymphocyte commitment. Identifying the point of no return. Semin. Immunol. 23, 335–340 [DOI] [PubMed] [Google Scholar]
- 2. Lin Y. C., Jhunjhunwala S., Benner C., Heinz S., Welinder E., Mansson R., Sigvardsson M., Hagman J., Espinoza C. A., Dutkowski J., Ideker T., Glass C. K., Murre C. (2010) A global network of transcription factors, involving E2A, EBF1 and Foxo1, that orchestrates B cell fate. Nat. Immunol. 11, 635–643 [DOI] [PMC free article] [PubMed] [Google Scholar]
- 3. Treiber T., Mandel E. M., Pott S., Györy I., Firner S., Liu E. T., Grosschedl R. (2010) Early B cell factor 1 regulates B cell gene networks by activation, repression, and transcription-independent poising of chromatin. Immunity 32, 714–725 [DOI] [PubMed] [Google Scholar]
- 4. Revilla-I-Domingo R., Bilic I., Vilagos B., Tagoh H., Ebert A., Tamir I. M., Smeenk L., Trupke J., Sommer A., Jaritz M., Busslinger M. (2012) The B-cell identity factor Pax5 regulates distinct transcriptional programmes in early and late B lymphopoiesis. EMBO J. 31, 3130–3146 [DOI] [PMC free article] [PubMed] [Google Scholar]
- 5. Lin H., Grosschedl R. (1995) Failure of B-cell differentiation in mice lacking the transcription factor EBF. Nature 376, 263–267 [DOI] [PubMed] [Google Scholar]
- 6. Zandi S., Mansson R., Tsapogas P., Zetterblad J., Bryder D., Sigvardsson M. (2008) EBF1 is essential for B-lineage priming and establishment of a transcription factor network in common lymphoid progenitors. J. Immunol. 181, 3364–3372 [DOI] [PubMed] [Google Scholar]
- 7. Welinder E., Mansson R., Mercer E. M., Bryder D., Sigvardsson M., Murre C. (2011) The transcription factors E2A and HEB act in concert to induce the expression of FOXO1 in the common lymphoid progenitor. Proc. Natl. Acad. Sci. U.S.A. 108, 17402–17407 [DOI] [PMC free article] [PubMed] [Google Scholar]
- 8. Inlay M. A., Bhattacharya D., Sahoo D., Serwold T., Seita J., Karsunky H., Plevritis S. K., Dill D. L., Weissman I. L. (2009) Ly6d marks the earliest stage of B-cell specification and identifies the branchpoint between B-cell and T-cell development. Genes Dev. 23, 2376–2381 [DOI] [PMC free article] [PubMed] [Google Scholar]
- 9. Mansson R., Welinder E., Åhsberg J., Lin Y. C., Benner C., Glass C. K., Lucas J. S., Sigvardsson M., Murre C. (2012) Positive intergenic feedback circuitry, involving EBF1 and FOXO1, orchestrates B-cell fate. Proc. Natl. Acad. Sci. U.S.A. 109, 21028–21033 [DOI] [PMC free article] [PubMed] [Google Scholar]
- 10. Tsapogas P., Zandi S., Åhsberg J., Zetterblad J., Welinder E., Jönsson J. I., Månsson R., Qian H., Sigvardsson M. (2011) IL-7 mediates Ebf-1-dependent lineage restriction in early lymphoid progenitors. Blood 118, 1283–1290 [DOI] [PubMed] [Google Scholar]
- 11. Xie H., Ye M., Feng R., Graf T. (2004) Stepwise reprogramming of B cells into macrophages. Cell 117, 663–676 [DOI] [PubMed] [Google Scholar]
- 12. Cobaleda C., Jochum W., Busslinger M. (2007) Conversion of mature B cells into T cells by dedifferentiation to uncommitted progenitors. Nature 449, 473–477 [DOI] [PubMed] [Google Scholar]
- 13. Nutt S. L., Heavey B., Rolink A. G., Busslinger M. (1999) Commitment to the B-lymphoid lineage depends on the transcription factor Pax5. Nature 401, 556–562 [DOI] [PubMed] [Google Scholar]
- 14. Urbánek P., Wang Z. Q., Fetka I., Wagner E. F., Busslinger M. (1994) Complete block of early B cell differentiation and altered patterning of the posterior midbrain in mice lacking Pax5/BSAP. Cell 79, 901–912 [DOI] [PubMed] [Google Scholar]
- 15. Nutt S. L., Urbánek P., Rolink A., Busslinger M. (1997) Essential functions of Pax5 (BSAP) in pro-B cell development. Difference between fetal and adult B lymphopoiesis and reduced V-to-DJ recombination at the IgH locus. Genes Dev. 11, 476–491 [DOI] [PubMed] [Google Scholar]
- 16. Zandi S., Ahsberg J., Tsapogas P., Stjernberg J., Qian H., Sigvardsson M. (2012) Single-cell analysis of early B-lymphocyte development suggests independent regulation of lineage specification and commitment in vivo. Proc. Natl. Acad. Sci. U.S.A. 109, 15871–15876 [DOI] [PMC free article] [PubMed] [Google Scholar]
- 17. Mullighan C. G., Goorha S., Radtke I., Miller C. B., Coustan-Smith E., Dalton J. D., Girtman K., Mathew S., Ma J., Pounds S. B., Su X., Pui C. H., Relling M. V., Evans W. E., Shurtleff S. A., Downing J. R. (2007) Genome-wide analysis of genetic alterations in acute lymphoblastic leukaemia. Nature 446, 758–764 [DOI] [PubMed] [Google Scholar]
- 18. Heltemes-Harris L. M., Willette M. J., Ramsey L. B., Qiu Y. H., Neeley E. S., Zhang N., Thomas D. A., Koeuth T., Baechler E. C., Kornblau S. M., Farrar M. A. (2011) Ebf1 or Pax5 haploinsufficiency synergizes with STAT5 activation to initiate acute lymphoblastic leukemia. J. Exp. Med. 208, 1135–1149 [DOI] [PMC free article] [PubMed] [Google Scholar]
- 19. Simmons S., Knoll M., Drewell C., Wolf I., Mollenkopf H. J., Bouquet C., Melchers F. (2012) Biphenotypic B-lymphoid/myeloid cells expressing low levels of Pax5. Potential targets of BAL development. Blood 120, 3688–3698 [DOI] [PubMed] [Google Scholar]
- 20. Zhuang Y., Cheng P., Weintraub H. (1996) B-lymphocyte development is regulated by the combined dosage of three basic helix-loop-helix genes, E2A, E2-2 and HEB. Mol. Cell Biol. 16, 2898–2905 [DOI] [PMC free article] [PubMed] [Google Scholar]
- 21. Lukin K., Fields S., Lopez D., Cherrier M., Ternyak K., Ramírez J., Feeney A. J., Hagman J. (2010) Compound haploinsufficiencies of Ebf1 and Runx1 genes impede B cell lineage progression. Proc. Natl. Acad. Sci. U.S.A. 107, 7869–7874 [DOI] [PMC free article] [PubMed] [Google Scholar]
- 22. Lukin K., Fields S., Guerrettaz L., Straign D., Rodriguez V., Zandi S., Månsson R., Cambier J. C., Sigvardsson M., Hagman J. (2011) A dose-dependent role for EBF1 in repressing non-B cell specific genes. Eur. J. Immunol. 41, 1787–1793 [DOI] [PMC free article] [PubMed] [Google Scholar]
- 23. O'Riordan M., Grosschedl R. (1999) Coordinate regulation of B cell differentiation by the transcription factors EBF and E2A. Immunity 11, 21–31 [DOI] [PubMed] [Google Scholar]
- 24. Zhuang Y., Soriano P., Weintraub H. (1994) The helix-loop-helix gene E2A is required for B cell formation. Cell 79, 875–884 [DOI] [PubMed] [Google Scholar]
- 25. Mårtensson I. L., Melchers F., Winkler T. H. (1997) A transgenic marker for mouse B lymphoid precursors. J. Exp. Med. 185, 653–661 [DOI] [PMC free article] [PubMed] [Google Scholar]
- 26. Schmitt T. M., Zúņiga-Pflücker J. C. (2002) Induction of T cell development from hematopoietic progenitor cells by δ-like-1 in vitro. Immunity 17, 749–756 [DOI] [PubMed] [Google Scholar]
- 27. Mansson R., Zandi S., Anderson K., Martensson I. L., Jacobsen S. E., Bryder D., Sigvardsson M. (2008) B-lineage commitment prior to surface expression of B220 and CD19 on hematopoietic progenitor cells. Blood 112, 1048–1055 [DOI] [PubMed] [Google Scholar]
- 28. Åhsberg J., Tsapogas P., Qian H., Zetterblad J., Zandi S., Månsson R., Jönsson J. I., Sigvardsson M. (2010) Interleukin-7 induced Stat-5 acts in synergy with Flt-3 signaling to stimulate expansion of hematopoietic progenitor cells. J. Biol. Chem. 285, 36275–36284 [DOI] [PMC free article] [PubMed] [Google Scholar]
- 29. Li C., Wong W. (2001) Model-based analysis of oligonucleotide arrays. Expression index computation and outlier detection. Proc. Natl. Acad. Sci. U.S.A. 98, 31–36 [DOI] [PMC free article] [PubMed] [Google Scholar]
- 30. Schlissel M. S., Corcoran L. M., Baltimore D. (1991) Virus-transformed pre-B cells show ordered activation but not inactivation of immunoglobulin gene rearrangement and transcription. J. Exp. Med. 173, 711–720 [DOI] [PMC free article] [PubMed] [Google Scholar]
- 31. Gao H., Lukin K., Ramírez J., Fields S., Lopez D., Hagman J. (2009) Opposing effects of SWI/SNF and Mi-2/NuRD chromatin remodeling complexes on epigenetic reprogramming by EBF and Pax5. Proc. Natl. Acad. Sci. U.S.A. 106, 11258–11263 [DOI] [PMC free article] [PubMed] [Google Scholar]
- 32. Dias S., Månsson R., Gurbuxani S., Sigvardsson M., Kee B. L. (2008) E2A proteins promote development of lymphoid-primed multipotent progenitors. Immunity 29, 217–227 [DOI] [PMC free article] [PubMed] [Google Scholar]
- 33. Semerad C. L., Mercer E. M., Inlay M. A., Weissman I. L., Murre C. (2009) E2A proteins maintain the hematopoietic stem cell pool and promote the maturation of myelolymphoid and myeloerythroid progenitors. Proc. Natl. Acad. Sci. U.S.A. 106, 1930–1935 [DOI] [PMC free article] [PubMed] [Google Scholar]
- 34. Yang Q., Kardava L., St Leger A., Martincic K., Varnum-Finney B., Bernstein I. D., Milcarek C., Borghesi L. (2008) E47 controls the developmental integrity and cell cycle quiescence of multipotential hematopoietic progenitors. J. Immunol. 181, 5885–5894 [DOI] [PMC free article] [PubMed] [Google Scholar]
- 35. Kondo M., Weissman I. L., Akashi K. (1997) Identification of clonogenic common lymphoid progenitors in mouse bone marrow. Cell 91, 661–672 [DOI] [PubMed] [Google Scholar]
- 36. Karsunky H., Inlay M. A., Serwold T., Bhattacharya D., Weissman I. L. (2008) Flk2+ common lymphoid progenitors possess equivalent differentiation potential for the B and T lineages. Blood 111, 5562–5570 [DOI] [PMC free article] [PubMed] [Google Scholar]
- 37. Mansson R., Zandi S., Welinder E., Tsapogas P., Sakaguchi N., Bryder D., Sigvardsson M. (2010) Single-cell analysis of the common lymphoid progenitor compartment reveals functional and molecular heterogeneity. Blood 115, 2601–2609 [DOI] [PubMed] [Google Scholar]
- 38. Chen J., Ma A., Young F., Alt F. W. (1994) IL-2 receptor α chain expression during early B lymphocyte differentiation. Int. Immunol. 6, 1265–1268 [DOI] [PubMed] [Google Scholar]
- 39. Rolink A., Grawunder U., Winkler T. H., Karasuyama H., Melchers F. (1994) IL-2 receptor α chain (CD25, TAC) expression defines a crucial stage in pre-B cell development. Int. Immunol. 6, 1257–1264 [DOI] [PubMed] [Google Scholar]
- 40. Györy I., Boller S., Nechanitzky R., Mandel E., Pott S., Liu E., Grosschedl R. (2012) Transcription factor Ebf1 regulates differentiation stage-specific signaling, proliferation, and survival of B cells. Genes Dev. 26, 668–682 [DOI] [PMC free article] [PubMed] [Google Scholar]
- 41. Sandoval G. J., Graham D. B., Bhattacharya D., Sleckman B. P., Xavier R. J., Swat W. (2013) Cutting edge. Cell-autonomous control of IL-7 response revealed in a novel stage of precursor B cells. J. Immunol. 190, 2485–2489 [DOI] [PMC free article] [PubMed] [Google Scholar]
- 42. Sigvardsson M., O'Riordan M., Grosschedl R. (1997) EBF and E47 collaborate to induce expression of the endogenous immunoglobulin surrogate light chain genes. Immunity 7, 25–36 [DOI] [PubMed] [Google Scholar]
- 43. Cline T. W., Meyer B. J. (1996) Vive la difference. Males vs females in flies vs worms. Annu. Rev. Genet. 30, 637–702 [DOI] [PubMed] [Google Scholar]
- 44. DeKoter R. P., Singh H. (2000) Regulation of B lymphocyte and macrophage development by graded expression of PU.1. Science 288, 1439–1441 [DOI] [PubMed] [Google Scholar]
- 45. Spooner C. J., Cheng J. X., Pujadas E., Laslo P., Singh H. (2009) A recurrent network involving the transcription factors PU.1 and Gfi1 orchestrates innate and adaptive immune cell fates. Immunity 31, 576–586 [DOI] [PMC free article] [PubMed] [Google Scholar]
- 46. Yoshida T., Ng S. Y., Zuniga-Pflucker J. C., Georgopoulos K. (2006) Early hematopoietic lineage restrictions directed by Ikaros. Nat. Immunol. 7, 382–391 [DOI] [PMC free article] [PubMed] [Google Scholar]
- 47. Kee B. L., Murre C. (1998) Induction of early B cell factor (EBF) and multiple B lineage genes by the basic helix-loop-helix transcription factor E12. J. Exp. Med. 188, 699–713 [DOI] [PMC free article] [PubMed] [Google Scholar]
- 48. Smith E. M., Gisler R., Sigvardsson M. (2002) Cloning and characterization of a promoter flanking the early B cell factor (EBF) gene indicates roles for E-proteins and autoregulation in the control of EBF expression. J. Immunol. 169, 261–270 [DOI] [PubMed] [Google Scholar]