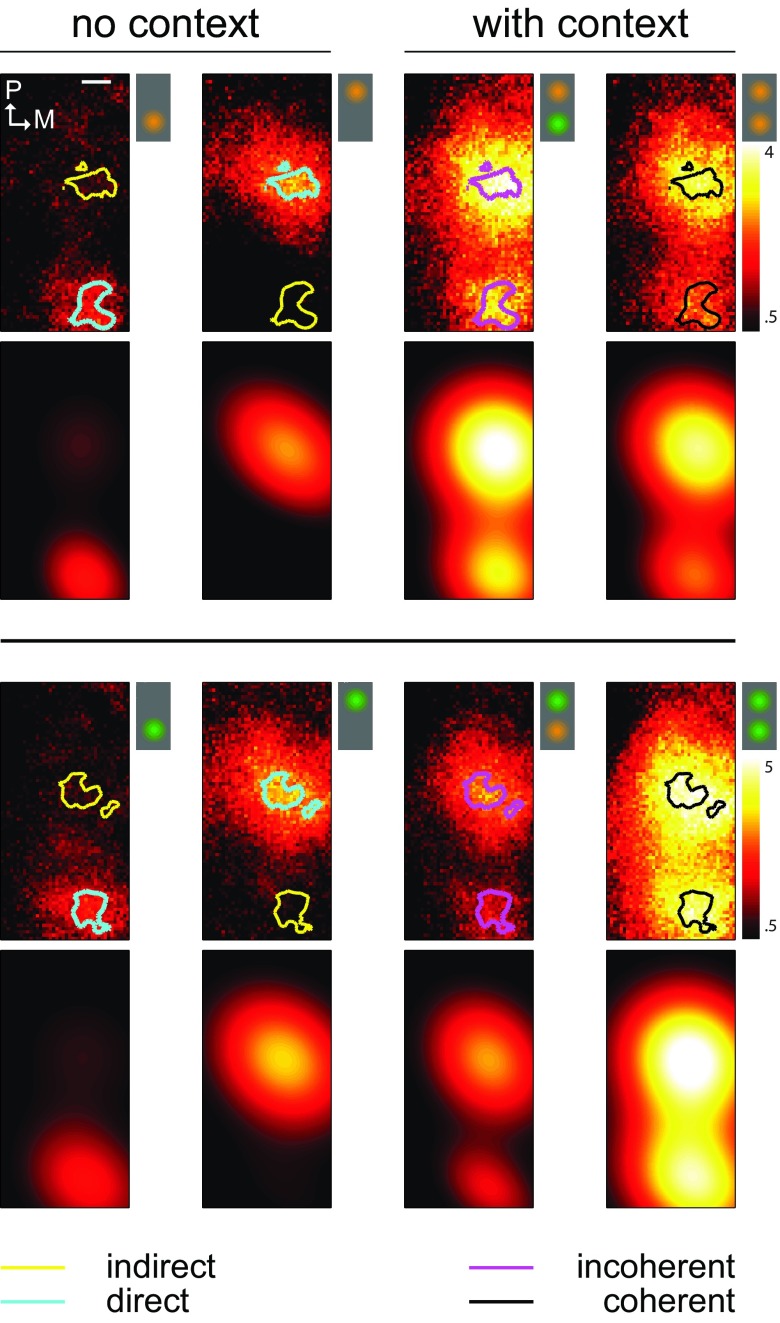
Figure 3. Observed and modeled spatial profiles of activity patterns.
Spatial activity profiles ( first and third rows) in response to two different natural movies ( upper and lower panels) presented at various stimulation conditions with ( third and fourth columns) or without ( first and second columns) contextual information. Icons schematically represent the stimulation conditions. These are computed by time-averaging the data presented in Figure 2. Activity during no-context conditions was used to define a pair of interest regions per movie. This was done by selecting the pixels with highest activity located within the top 5 th percentile (see contour lines). Within these regions of interest we derived direct ( cyan), indirect ( yellow) and coherent ( black) and incoherent ( magenta) activity levels. The observed activity profiles were parametrically fitted using a composite function involving two 2-D Gaussians ( second and fourth rows). The goodness of fit values characterized by the correlation coefficient is shown for the whole data set in Figure 4D.

