Background: The mechanism of TGF-β1-induced Akt kinase activation in diabetic nephropathy (DN) is not fully elucidated.
Results: FOG2 down-regulation by TGF-β1-induced miR-200b/c activates Akt, which leads to glomerular mesangial hypertrophy.
Conclusion: FOG2 and miR-200b/c are novel modulators of TGF-β1-induced Akt activation in glomerular mesangial cells.
Significance: These results reveal new mediators of TGF-β1 actions related to the pathogenesis of DN.
Keywords: Akt, Cell Signaling, Diabetes, MicroRNA, Nephrology, Transforming Growth Factor β (TGFbeta), FOG2, Hypertrophy
Abstract
Glomerular hypertrophy is a hallmark of diabetic nephropathy. Akt kinase activated by transforming growth factor-β1 (TGF-β) plays an important role in glomerular mesangial hypertrophy. However, the mechanisms of Akt activation by TGF-β are not fully understood. Recently, miR-200 and its target FOG2 were reported to regulate the activity of phosphatidylinositol 3-kinase (the upstream activator of Akt) in insulin signaling. Here, we show that TGF-β activates Akt in glomerular mesangial cells by inducing miR-200b and miR-200c, both of which target FOG2, an inhibitor of phosphatidylinositol 3-kinase activation. FOG2 expression was reduced in the glomeruli of diabetic mice as well as TGF-β-treated mouse mesangial cells (MMC). FOG2 knockdown by siRNAs in MMC activated Akt and increased the protein content/cell ratio suggesting hypertrophy. A significant increase of miR-200b/c levels was detected in diabetic mouse glomeruli and TGF-β-treated MMC. Transfection of MMC with miR-200b/c mimics significantly decreased the expression of FOG2. Conversely, miR-200b/c inhibitors attenuated TGF-β-induced decrease in FOG2 expression. Furthermore, miR-200b/c mimics increased the protein content/cell ratio, whereas miR-200b/c inhibitors abrogated the TGF-β-induced increase in protein content/cell. In addition, down-regulation of FOG2 by miR-200b/c could activate not only Akt but also ERK, which was also through PI3K activation. These data suggest a new mechanism for TGF-β-induced Akt activation through FOG2 down-regulation by miR-200b/c, which can lead to glomerular mesangial hypertrophy in the progression of diabetic nephropathy.
Introduction
Diabetic nephropathy (DN)2 is a major complication of diabetes. It is characterized by glomerular mesangial expansion caused by mesangial cell hypertrophy, followed by extracellular matrix protein accumulation and subsequent glomerulosclerosis (1–4). Cellular hypertrophy, a maladaptive increase in total cell volume and protein content without a concomitant increase in total cell number, is one of the early abnormalities found in DN (5). In addition, chronic fibrotic changes have been found to be preceded by hypertrophic growth (4, 6). Therefore, understanding the mechanisms associated with pathogenesis of mesangial hypertrophy is important for the development of approaches to treat DN.
The phosphatidylinositol 3-kinase (PI3K)-Akt pathway plays a key role in cellular hypertrophy. The PI3K enzyme, a well known upstream mediator of Akt kinase activation, is composed of a catalytic subunit, p110, and a regulatory subunit, p85α. When activated, the catalytic subunit of PI3K recruits Akt kinase to the membrane and activates it by phosphorylation (7). Activated Akt phosphorylates several downstream proteins that play central roles in hypertrophy, cell growth, cell survival, and protein synthesis.
Transforming growth factor-β1 (TGF-β) is a major promoter of diabetic renal manifestations. Enhanced expression of TGF-β in renal cells can lead to glomerular mesangial hypertrophy and fibrosis under diabetic conditions (2, 8–11). High glucose conditions increase the transcription of TGF-β1 (12, 13). Moreover, many of the effects of high glucose in renal cells or the progression of DN were found to be attenuated by neutralizing TGF-β1 (10, 14). Therefore, TGF-β is a critical mediator of the effects of high glucose in models of DN. Recent studies have found that PI3K-Akt activation by TGF-β plays a key role in its downstream actions (15–18). Interestingly, recent studies have shown that down-regulation of phosphatase and tensin homolog (PTEN) is a key mechanism by which TGF-β activates PI3K-Akt and that this occurs via microRNAs (miRNAs) such as miR-216a/miR-217 that target PTEN (16, 19).
Growing evidence suggests that miRNAs play critical roles in the progression of DN. miRNAs are a group of endogenously produced, short noncoding RNAs that bind to the 3′UTRs of target mRNAs through base pairing and inhibit mRNA translation or promote mRNA degradation (20, 21). Several miRNAs expressed in the kidney were found to be mis-regulated in the renal cortex and glomeruli of animal models of diabetes as well as in mouse and human mesangial cells treated with TGF-β or high glucose, and they could modulate the expression of extracellular matrix genes, suggesting a functional role in DN pathophysiology (3, 19, 22–34).
Recently, a novel protein FOG2 was found to bind with the p85α, regulatory subunit of PI3K, thereby inhibiting PI3K activation (35). In addition, miR-200 was reported to decrease FOG2 expression by targeting the 3′UTR of the FOG2 mRNA, thereby altering PI3K activity and regulating the insulin signaling pathway and metabolism (35). However, the role of FOG2 in TGF-β signaling and cellular hypertrophy has not been examined.
In this study, we show that TGF-β up-regulates miR-200b/c in mouse mesangial cells (MMC) and subsequently down-regulates its target FOG2, which leads to PI3K-Akt activation and glomerular mesangial hypertrophy. Furthermore, we observed that a FOG2 siRNA could directly increase Akt activity and cellular hypertrophy, whereas inhibitors of miR-200b/c could attenuate TGF-β-induced mesangial cellular hypertrophy. These results reveal a novel new role for FOG2 regulated by miR-200b/c in TGF-β-induced PI3K-Akt activation in the pathogenesis of DN.
EXPERIMENTAL PROCEDURES
Animals
All animal studies were conducted according to protocol approved by the Institutional Animal Care and Use Committee at the Beckman Research Institute of City of Hope. Type 2 diabetic db/db mice and genetic control nondiabetic db/+ mice (10–12 weeks old, eight per group), were obtained from The Jackson Laboratory (Bar Harbor, ME). C57BL/6 mice (The Jackson Laboratory) were injected with 50 mg/kg of streptozotocin (STZ) intraperitoneally on 5 consecutive days. Mice injected with diluent served as controls. Diabetes was confirmed by tail vein blood glucose levels (fasting glucose >300 mg/dl). Each group was composed of eight mice. All mice were sacrificed at 16 weeks post-induction of diabetes. Glomeruli were isolated from freshly harvested kidneys by a sieving technique. Renal capsules were removed, and the cortical tissue of each kidney was separated by dissection. The cortical tissue was then carefully strained through a stainless sieve with a pore size of 150 μm by applying gentle pressure. Enriched glomerular tissue below the sieve was collected and transferred to another sieve with a pore size of 75 μm. After several washes with cold PBS, the glomerular tissue remaining on top of the sieve was collected. The pooled glomeruli were centrifuged, and the pellet was collected for RNA extraction. Each glomeruli sample was composed of tissue pooled from two mice.
Cell Culture Experiments
MMC were obtained and cultured as described previously in RPMI 1640 medium supplemented with 10% FBS (22). Passages 5–7 were used for experiments. Recombinant human TGF-β1 was from R&D Systems (Minneapolis, MN). LY-294002 was from Calbiochem, and MK-2206 was purchased from Selleck Chemicals (Houston, TX). LY-294002 and MK-2206 were dissolved in dimethyl sulfoxide (DMSO) and used at a final concentration of 20 and 1 μm, respectively, as described previously (36, 37).
Immunohistochemistry
Formalin-fixed, paraffin-embedded sections of mouse kidneys were mounted onto positively charged slides, deparaffinized, washed with water, blocked with Dako protein block (Dako, Carpinteria, CA), and incubated with FOG2 antibody (1:25) for 30 min. Slides were washed with Dako wash, treated with hydrogen peroxide for 5 min, washed with PBS, incubated with anti-rabbit secondary antibody conjugated with a peroxidase polymer (Dako, Carpinteria, CA), and washed and incubated with 3,3′-diaminobenzidine for 8 min. Slides were counterstained with hematoxylin and mounted. Images were taken at ×40 magnification using an Olympus BX51 microscope with In Studio (Pixera Corp., Santa Clara, CA) software to collect images. ImagePro software (Media Cybernetics Inc., Rockville, MD) was used to quantify staining.
Real Time Quantitative PCR
RNA was extracted using miRNeasy columns (Qiagen, Inc. Valencia, CA). miRNA expression analysis was performed with the qScript miRNA cDNA synthesis kit (Quanta Biosciences, Gaithersburg, MD) and PerfeCTa SYBR Green Supermix (Quanta Biosciences). GeneAmp RNA PCR kit (Applied Biosystems, Carlsbad, CA) and POWER SYBR Green mix (Applied Biosystems) were used for mRNA quantification. Extracted mature miRNAs were first polyadenylated with poly(A) polymerase followed by reverse transcription into cDNA using oligo(dT) primer with universal tag. miRNAs were amplified using specific mature miRNA sequences as forward primers and the universal primer provided in the kit as reverse primer. Real time quantitative PCRs were performed on the 7500 real time PCR system (Applied Biosystems, Foster City, CA). PCR primer sequences were as follows: FOG2, 5′-GAGCTGCGAAGACGTGGAGT-3′ and 5′-CCAGGCTGTCCTGGTTTGTC-3′; and TGF-β1, 5′-CAACGCCATCTATGAGA-3′ and 5′-AAGCCCTGTATTCCGTCTCC-3′.
Western Blot Analysis
Immunoblotting was performed as described previously (22). Cells were lysed in Laemmli's sample buffer. Lysates were fractionated on 10% SDS-polyacrylamide gels (Bio-Rad) and transferred to nitrocellulose membrane. Membranes were immunoblotted with appropriate antibodies. Antibody against FOG2 was from Santa Cruz Biotechnology (1:500). Antibodies against phospho-Akt, Akt, and β-actin were from Cell Signaling (Beverly, MA). Blots were scanned using GS-800 densitometer and quantified with Quantity One software (Bio-Rad).
miRNA Oligonucleotides
Oligonucleotides representing the miR mimics, negative control for mimics (NC-M), the miR-200b/c inhibitors, and the negative control for the inhibitors (NC-I) were all obtained from Thermo Fischer Scientific Inc. (Waltham, MA).
MMC Transfection
Cells (1 × 10⁶/transfection) were transfected with siRNA or miRNA oligonucleotides using an Amaxa Nucleofector (Lonza, Basel, Switzerland) according to the manufacturer's protocols as described previously (19). MMC were trypsinized and resuspended in Basic Nucleofection Solution at 1 × 10⁷/ml. Subsequently, 100 μl of cell suspension (1 × 10⁶ cells) was mixed with miRNA mimic, hairpin inhibitor oligonucleotides, or ON-TARGET plus siRNA or negative controls (Thermo Fischer Scientific Inc., Waltham, MA) as indicated. Transfected cells were harvested for RNA and protein isolation at indicated times.
Measurement of Cellular Hypertrophy
Hypertrophy was assessed by measurement of cellular protein/cell counts as described previously (19). MMC were trypsinized and counted using a Coulter Counter with 100-μm aperture (Beckman Coulter, Brea, CA). Cells were lysed, and total protein content was measured using protein assays from Bio-Rad.
Statistical Analysis
Statistical analysis was performed using PRISM software (Graph-Pad, San Diego, CA) for data analysis with Student t tests or analysis of variance. p < 0.05 was considered statistically significant. All data were expressed as means ± S.E.
RESULTS
FOG2 Expression Is Down-regulated in Glomeruli of Diabetic Mice
To evaluate whether glomerular FOG2 is related to the progression of DN, we first examined the expression of FOG2 in glomeruli of type 2 and type 1 diabetic mice. The immunohistochemical staining of FOG2 was significantly decreased in glomeruli from type 2 diabetic db/db mice compared with nondiabetic control mice (db/+) (Fig. 1, A–C). FOG2 mRNA levels were also significantly lower in the renal glomeruli of the diabetic db/db mice when compared with control db/+ mice (Fig. 1D). Conversely, TGF-β1 gene expression levels were increased in the glomeruli from db/db mice (Fig. 1E). A similar decrease in FOG2 staining was observed in glomeruli from streptozotocin-induced type 1 diabetic mice (STZ) compared with nondiabetic control mice (CON) (Fig. 1, F–H). FOG2 mRNA levels were lower in STZ glomeruli (Fig. 1I), whereas TGF-β1 expression levels were significantly higher (Fig. 1J).
FIGURE 1.
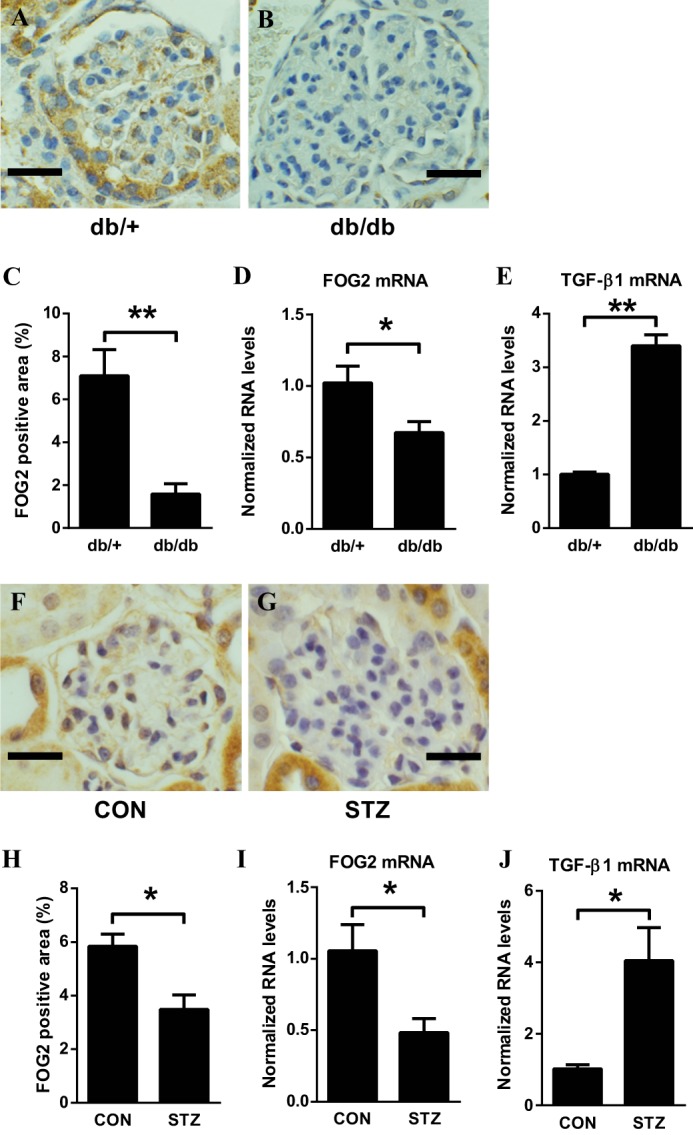
Decreased levels of FOG2 in glomeruli from mouse models of type 2 (db/db) and type 1 diabetes (streptozotocin-induced). A and B, representative immunohistochemistry staining of FOG2 in glomeruli from genetic control db/+ mouse (scale bar, 20 μm) (A) and from diabetic db/db mouse (B). C, percentage of FOG2-positive area. Significant decrease of FOG2 staining is observed in glomeruli from db/db mice compared with those from genetic control db/+ mice. To quantify the expression of FOG2, the positive stained areas/glomerular areas (%) were measured using ImageJ (National Institutes of Health). For each animal, 10 glomeruli were evaluated. Mean ± S.E. D, FOG2 mRNA expression in glomeruli. Significant decrease of FOG2 mRNA in glomeruli from db/db mice compared with those from genetic control db/+ mice. E, TGF-β1 mRNA expression in glomeruli. Significant increase in TGF-β1 mRNA in glomeruli from db/db mice compared with those from genetic control db/+ mice. Glomeruli were isolated by a sieving technique from eight mice in each group. Results were normalized with internal control 18 S. Mean ± S.E. F and G, representative immunohistochemistry staining of FOG2 in glomeruli from control (CON) mouse (scale bar, 20 μm) (F) and from STZ-induced diabetic mouse (G). H, percentage of FOG2-positive area. Significant decrease of FOG2 staining is observed in glomeruli from STZ compared with those from CON mice. For each animal, 10 glomeruli were evaluated. Mean ± S.E. I, FOG2 mRNA expression in glomeruli. Significant decrease of FOG2 mRNA in glomeruli from STZ mice compared with those from CON mice. J, TGF-β1 mRNA expression in glomeruli. Significant increase in TGF-β1 mRNA in glomeruli from STZ mice compared with those from CON mice. Glomeruli were isolated by a sieving technique from eight mice in each group. Results were normalized with internal control 18 S. Mean ± S.E. ** and * indicate p < 0.01 and p < 0.05, respectively.
FOG2 Expression Is Down-regulated in MMC Treated with High Glucose and with TGF-β
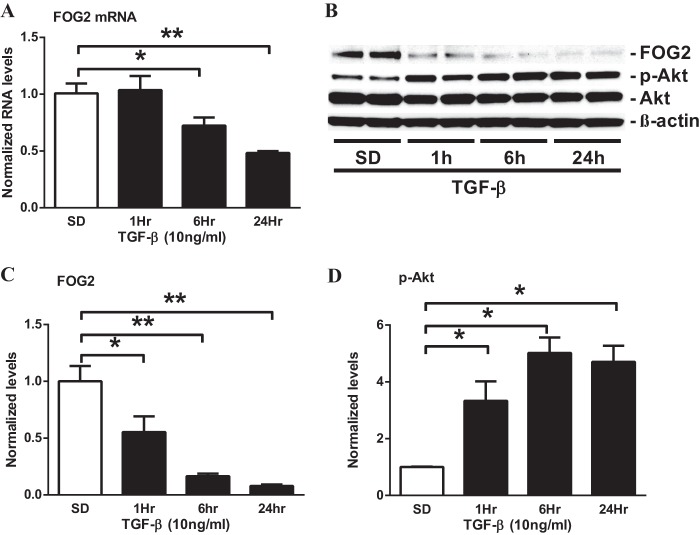
To further clarify whether the glomerular expression of FOG2 is regulated by diabetic conditions in vitro, MMC were cultured with either normal glucose (NG, 5.5 mm) or high glucose (HG, 25 mm) for 72 h. The expression of FOG2 mRNA and protein was significantly down-regulated by HG relative to NG treatment (Fig. 2, A–C). The down-regulation of FOG2 in HG-treated MMC was associated with an increase in Akt phosphorylation (Fig. 2, B and D). These changes were accompanied by a significant increase of TGF-β1 expression in HG-treated MMC (Fig. 2E). Because TGF-β is increased in renal cells under diabetic conditions, is up-regulated by HG, and plays a key role in the pathogenesis of DN, we next examined the effects of TGF-β. TGF-β treatment in MMC resulted in a significant decrease in FOG2 mRNA (from 6 to 24 h; Fig. 3A) and protein levels (from 1 to 24 h; Fig. 3, B and C). Furthermore, in parallel, there was a significant increase in Akt phosphorylation in the TGF-β-treated MMC (Fig. 3, B and D). Together, these results suggest that FOG2 expression is decreased in mesangial cells under diabetic conditions in vivo and in vitro, and this is associated with an increase in Akt phosphorylation. In addition, the findings imply that these changes are associated with TGF-β expression, suggesting a link between FOG2 inhibition and Akt phosphorylation in glomerular mesangial cells under diabetic conditions.
FIGURE 2.
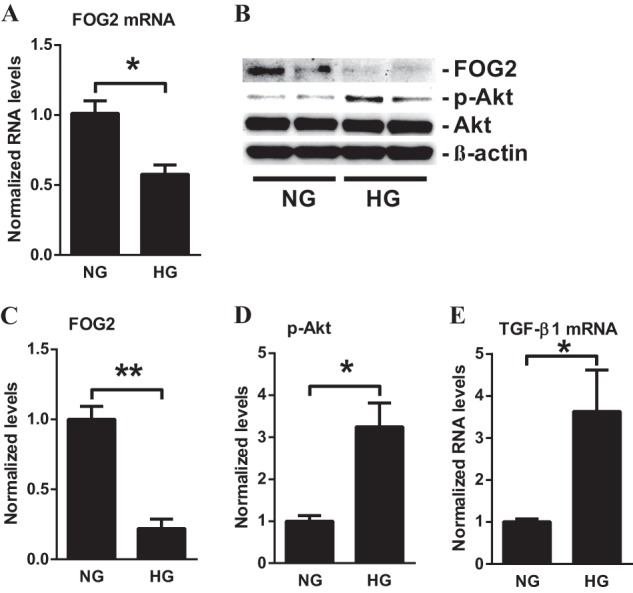
High glucose decreases the expression of FOG2 in MMC. A, FOG2 mRNA levels in MMC treated with NG (5.5 mm) or HG (25 mm). Significant decrease was detected at 72 h after HG treatment compared with NG. Results were normalized with internal control 18 S. Mean ± S.E. (n = 4). B, immunoblotting analysis of MMC after treatment with HG (25 mm for 72 h). C, HG treatment significantly decreased protein levels of FOG2 (normalized to β-actin). Mean ± S.E. (n = 4). D, phosphorylation of Akt (p-Akt) (normalized to total Akt) significantly increased with HG treatment. Mean ± S.E. (n = 4). E, TGF-β1 mRNA levels in MMC with HG treatment. Significant increase in TGF-β1 mRNA in MMC treated with HG for 72 h compared with NG. Results were normalized with internal control 18 S. Mean ± S.E. (n = 4). ** and * indicate p < 0.01 and p < 0.05, respectively versus NG.
FIGURE 3.
TGF-β decreases the expression of FOG2 in MMC. A, FOG2 mRNA levels in MMC treated with TGF-β. Significant decrease was detected at 6 and 24 h after TGF-β treatment. Results were normalized with internal control 18 S. Mean ± S.E. (n = 4). B–D, immunoblotting analysis of MMC after treatment with TGF-β (10 ng/ml for 1 h to 24 h). C, TGF-β treatment significantly decreased protein levels of FOG2 at 1–24 h (normalized to β-actin). Mean ± S.E. (n = 4). D, phosphorylation of Akt (p-Akt) (normalized to total Akt) significantly increased with TGF-β treatment. Mean ± S.E. (n = 4). ** and * indicate p < 0.01 and p < 0.05, respectively versus S.D.
Knockdown of FOG2 Activates Akt in Mouse Mesangial Cells
Next, we tested the functional relevance of FOG2 down-regulation in MMC. Recently, FOG2 and its fly analog U-shaped (USH) were found to suppress PI3K activity and thereby repress insulin receptor signaling in human cell lines and Drosophila melanogaster to control growth (35). Therefore, we investigated whether FOG2 also affects the phosphorylation of Akt, a downstream target of PI3K, in MMC. FOG2 gene silencing by transfection with specific siRNAs (siFOG2) resulted in a significant decrease in FOG2 mRNA (Fig. 4A) as well as FOG2 protein levels (Fig. 4, B and C) relative to nontargeting control siRNA (siNTC). Furthermore, siFOG2 transfection also significantly increased the phosphorylation of Akt relative to siNTC transfection in MMC (Fig. 4, B and D), suggesting that the down-regulated FOG2 in TGF-β-treated cells may have a functional relationship with Akt activation in MMC.
FIGURE 4.
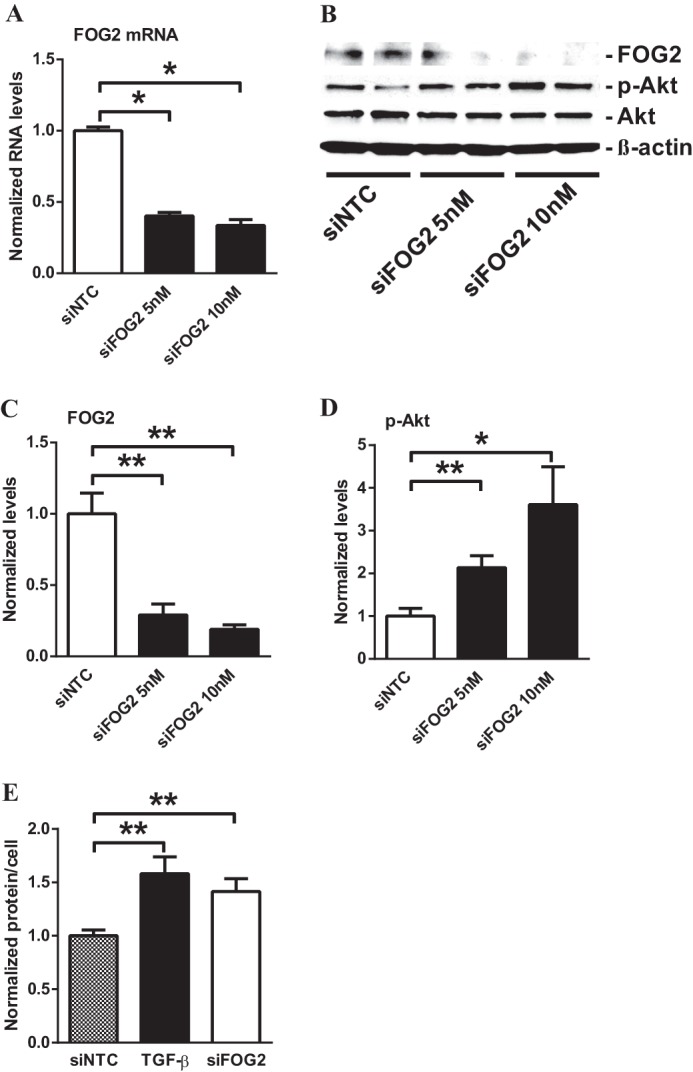
Down-regulation of FOG2 induces Akt phosphorylation in MMC. A, transfection with siFOG2 significantly decreased mRNA levels of FOG2 in MMC relative to nontargeting control siRNA (siNTC). Results were normalized with internal control 18 S. Mean ± S.E. (n = 4). B–D, immunoblotting analysis of MMC after transfection with siFOG2 (5 and 10 nm for 24 h). C, FOG2 protein levels significantly decreased after transfection with siFOG2 (normalized to β-actin). Mean ± S.E. (n = 4). D, transfection with siFOG2 significantly increased phosphorylation of Akt (normalized to total Akt). Mean ± S.E. (n = 4). E, cellular protein levels were calculated as ratio of total protein amount/total cell number. Protein content (hypertrophy) was increased by TGF-β in serum-depleted cells. FOG2 down-regulation by siFOG2 transfection induced hypertrophy in MMC to a similar extent as TGF-β. Mean ± S.E. (n = 4). ** and * indicate p < 0.01 and p < 0.05, respectively.
Previous studies have shown that glomerular mesangial hypertrophy, a major feature of DN, is a downstream consequence of Akt activation (16, 19). We next tested whether the increase in Akt phosphorylation ensued by FOG2 knockdown also results in increased cellular hypertrophy in MMC. TGF-β significantly increased cellular protein content, verifying that MMC hypertrophy is induced by TGF-β (Fig. 4E). Transfection of siFOG2 similarly induced hypertrophy in serum-depleted glomerular mesangial cells (Fig. 4E), confirming that the down-regulation of FOG2 can enhance cellular hypertrophy in MMC. Together these results suggest that the down-regulation of FOG2 by TGF-β under diabetic conditions can augment Akt kinase activation and subsequently result in glomerular mesangial cell hypertrophy.
miR-200b/c Are Up-regulated in MMC Treated with HG and TGF-β, as Well as in Glomeruli of Diabetic Mice
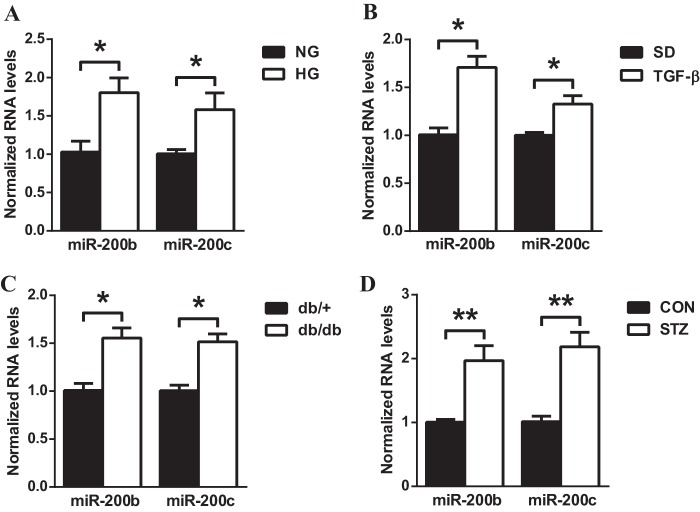
miR-200b and miR-200c were recently shown to target FOG2 in human cell lines. Similarly, in D. melanogaster the corresponding fly analog miR-8 could target U-shaped (USH) (35). In addition, the 3′UTR of FOG2 is highly conserved in humans and mice. Therefore, we examined whether FOG2 could also be down-regulated by miR-200b/c under diabetic conditions in MMC. First, miR-200b/c expression levels were evaluated in HG-treated MMC. miR-200b and miR-200c levels were significantly increased in MMC after 72 h of HG treatment (Fig. 5A). A similar increase in miR-200b and miR-200c was also found in MMC treated with TGF-β (24 h) (Fig. 5B). miR-200b/c levels were further evaluated in glomeruli of db/db and STZ mice. miR-200b and miR-200c levels were significantly increased in glomeruli of db/db mice (Fig. 5C) as well as STZ mice (Fig. 5D) compared with corresponding control mice as reported previously (27, 28), verifying that miR-200b and miR-200c are up-regulated in glomerular mesangial cells and renal glomeruli under diabetic conditions.
FIGURE 5.
Increased levels of miR-200b/c in TGF-β or HG-treated MMC and glomeruli from db/db or STZ-induced diabetic mice. A, expression levels of miR-200b/c in MMC treated with NG (5.5 mm) or HG (25 mm) for 72 h. miR-200b and miR-200c levels were increased in HG-treated MMC relative to NG-treated MMC. Mean ± S.E. (n = 4). B, expression levels of miR-200b/c in MMC treated with or without TGF-β (10 ng/ml for 24 h). miR-200b and miR-200c levels were significantly increased by TGF-β. Mean ± S.E. (n = 4). C, miR-200b and miR-200c levels were increased in diabetic (db/db) mice glomeruli relative to respective control nondiabetic (db/+) mice. Glomeruli were isolated by a sieving technique from eight mice in each group. D, miR-200b and miR-200c levels were increased in STZ-induced diabetic mice compared with nondiabetic CON mice. Glomeruli were isolated by a sieving technique from eight mice in each group. Mean ± S.E. Results were normalized with internal control U6. ** and * indicate p < 0.01 and p < 0.05, respectively.
FOG2 Is Down-regulated by miR-200b/c in MMC
Next, we examined whether miR-200b/c could down-regulate FOG2 in MMC. Transfection of MMC with oligonucleotide mimics of miR-200b (200b-M) or miR-200c (200c-M) significantly increased the levels of miR-200b and miR-200c, respectively, verifying the effectiveness of the mimics (Fig. 6A). Furthermore, results showed that 200b-M and 200c-M transfection significantly down-regulated both FOG2 mRNA (Fig. 6B) and protein levels (Fig. 6, C and D) relative to those transfected with negative control mimic (NC-M) oligonucleotides, suggesting that FOG2 abundance can be decreased by the up-regulated miR-200b/c in glomerular mesangial cells under diabetic conditions.
FIGURE 6.
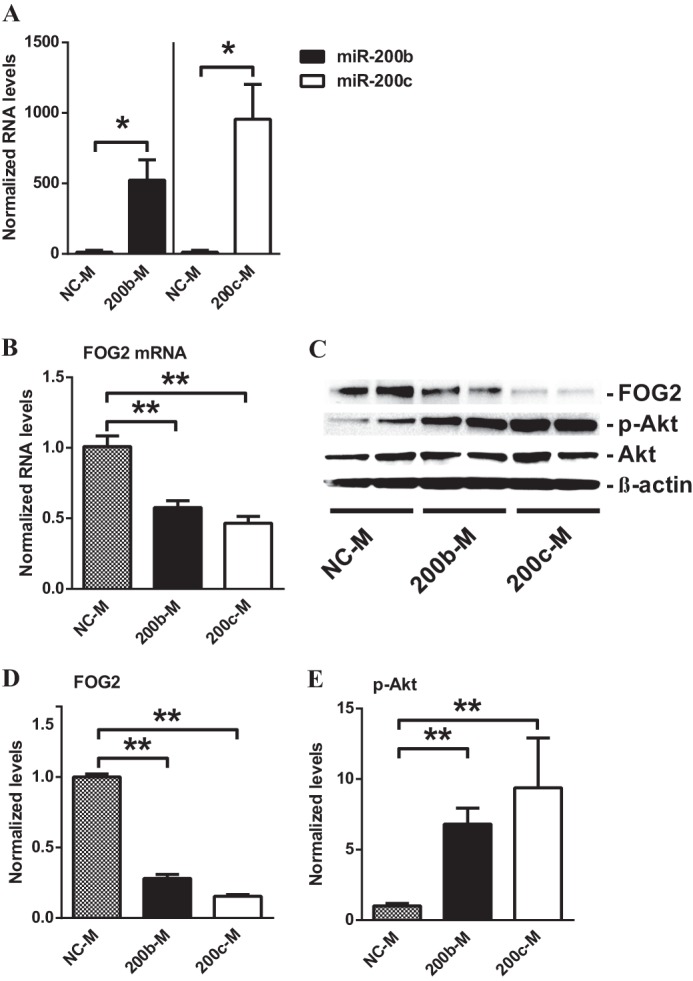
FOG2 is down-regulated by mimics of miR-200b (200b-M) and miR-200c (200c-M) in MMC. A, levels of miR-200b/c in MMC transfected with miR-200b and miR-200c mimics. Transfection with 200b-M or 200c-M significantly increased miR-200b and miR-200c levels, respectively, relative to NC-M oligonucleotides. Results were normalized with internal control U6. Mean ± S.E. (n = 3). B, expression of FOG2 mRNA in MMC transfected with miR-200b and miR-200c mimics. Transfection with 200b-M or 200c-M significantly decreased FOG2 mRNA levels. Results were normalized with internal control 18 S. Mean ± S.E. (n = 4). C–E, immunoblotting analysis of MMC after transfection with 200b-M and 200c-M. D, FOG2 protein levels normalized to β-actin were significantly decreased after transfection with 200b-M or 200c-M. Mean ± S.E. (n = 4). E, transfection with 200b-M or 200c-M significantly increased phosphorylation of Akt (p-Akt) normalized to total Akt. Mean ± S.E. (n = 4). ** and * indicate p < 0.01 and p < 0.05, respectively.
Akt Is Activated by miR-200b/c in MMC
Because our results showed that FOG2 can suppress the phosphorylation of Akt, we next evaluated whether the 200b-M and 200c-M induced down-regulation of FOG2 could also up-regulate Akt phosphorylation in MMC. Results showed that Akt phosphorylation was indeed significantly increased in MMC transfected with 200b-M and 200c-M compared with NC-M-transfected cells (Fig. 6, C and E), which occurred in parallel, to the down-regulation of FOG2 (Fig. 6, C and D).
miR-200b/c Inhibitors Can Attenuate the Down-regulation of FOG2 by TGF-β in MMC
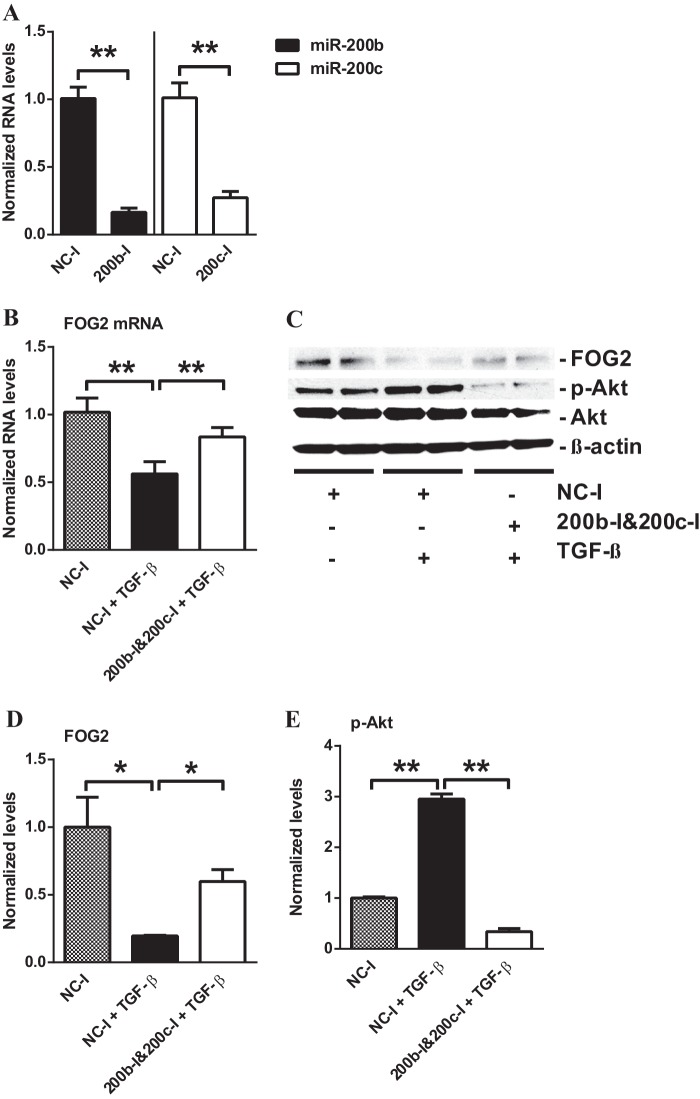
To verify that FOG2 is regulated by miR-200b/c in glomerular mesangial cells under diabetic conditions, we further investigated whether TGF-β-induced down-regulation of FOG2 can be reversed by oligonucleotide inhibitors of miR-200b/c. Transfection with hairpin inhibitor oligonucleotides of miR-200b (200b-I) and miR-200c (200c-I) resulted in a significant decrease in miR-200b and miR-200c levels, respectively (Fig. 7A). Treatment of MMC with TGF-β and NC-I significantly down-regulated both FOG2 mRNA (Fig. 7B) and protein levels (Fig. 7, C and D) relative to MMC with NC-I alone. However, the FOG2 mRNA (Fig. 7B) and protein levels (Fig. 7, C and D) decreased by TGF-β treatment were both significantly restored in cells transfected with a mixture of 200b-I and 200c-I. These results further verify that TGF-β-induced miR-200b/c under diabetic conditions can down-regulate the expression of FOG2 in glomerular mesangial cells.
FIGURE 7.
TGF-β-induced down-regulation of FOG2 restored by inhibitors of miR-200b (200b-I) and miR-200c (200c-I) in MMC. A, expression levels of miR-200b/c in MMC transfected with miR-200b or miR-200c inhibitors. Transfection with 200b-I or 200c-I significantly decreased miR-200b or miR-200c expression levels, respectively, relative to negative control inhibitor (NC-I) oligonucleotides. Results were normalized with internal control U6. Mean ± S.E. (n = 3). B, expression of FOG2 mRNA levels in MMC treated with TGF-β after transfection with negative control inhibitor (NC-I) or 200b-I and 200c-I. Treatment of MMC with TGF-β down-regulated FOG2 mRNA levels. Transfection with miR-200b-I and 200c-I reversed this effect. Results were normalized with internal control 18 S. Mean ± S.E. (n = 5). C–E, immunoblotting analysis of MMC after TGF-β treatment and transfection with 200b-I and 200c-I. D, FOG2 protein levels (normalized to β-actin) were significantly decreased after TGF-β treatment for 24 h. Transfection with 200b-I and 200c-I significantly restored FOG2 protein levels decreased by TGF-β. Mean ± S.E. (n = 4). E, treatment with TGF-β significantly increased phosphorylation of Akt. Transfection with 200b-I and 200c-I blocked TGF-β-induced up-regulation of Akt phosphorylation (normalized to total Akt). Mean ± S.E. (n = 4). ** and * indicate p < 0.01 and p < 0.05, respectively.
miR-200b/c Inhibitors Attenuate Akt Activation in TGF-β-treated MMC
Because the inhibition of miR-200b/c attenuated the down-regulation of FOG2 in TGF-β-treated MMC, and FOG2 down-regulates Akt phosphorylation, we further tested whether inhibition of miR-200b/c could also reverse the TGF-β-induced increase in Akt phosphorylation in MMC. Treatment of MMC with TGF-β significantly up-regulated Akt phosphorylation relative to untreated MMC as expected (Fig. 7, C and E). However, in 200b-I- and 200c-I-transfected MMC, TGF-β-induced Akt phosphorylation was significantly attenuated compared with that seen in NC-I-transfected MMC (Fig. 7, C and E).
FOG2 Down-regulation Activates ERK as Well as Akt in a PI3K-dependent Manner in MMC
MMC transfected with siFOG2 and 200b-M were treated with a PI3K inhibitor, LY-294002, and Akt-specific inhibitor, MK-2206 (36, 38), to confirm that increased Akt phosphorylation is via PI3K signaling mediated by miR-200b/c-induced FOG2 down-regulation. FOG2 protein levels were significantly decreased in siFOG2-transfected MMC compared with siNTC-transfected MMC (Fig. 8, A and B). Akt was activated in siFOG2-transfected MMC. This increase in Akt phosphorylation was significantly reduced in MMC treated with LY-294002 and MK-2206 (Fig. 8, A and C). The activation of ERK was also evaluated in MMC transfected with siFOG2 and 200b-M treated with LY-294002 and MK-2206 to investigate whether Akt was the only downstream pathway affected by FOG2 and miR-200b/c. ERK was significantly activated in siFOG2-transfected MMC as evidenced by increased phospho-ERK levels. This activation was significantly attenuated by LY-294002 treatment. However, ERK activation was not significantly affected by MK-2206 (Fig. 8, A and D).
FIGURE 8.
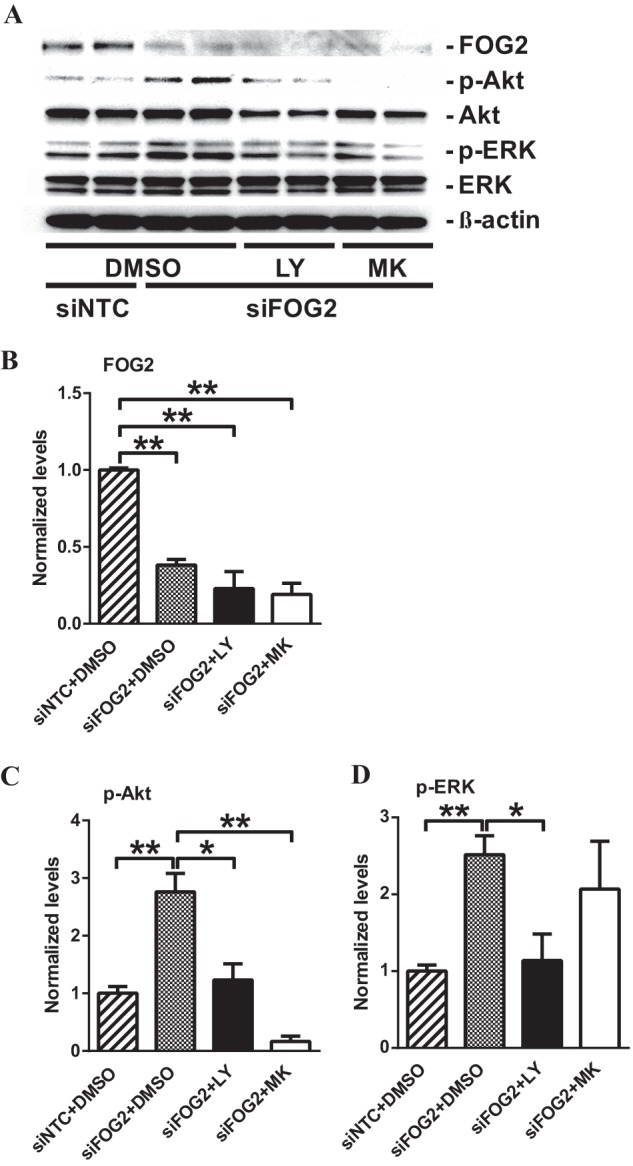
FOG2 down-regulation phosphorylates Akt as well as ERK in a PI3K-dependent manner in MMC. A–D, immunoblotting analysis of MMC after siFOG2 transfection followed by LY-294002 (LY) and MK-2206 (MK) treatment. siFOG2-transfected MMC were treated with either 20 μm LY or 1 μm MK for 24 h. B, FOG2 protein levels significantly decreased after siFOG2 transfection (normalized to β-actin). Mean ± S.E. (n = 4). C, transfection with siFOG2 increased phosphorylation of Akt. This increase in Akt phosphorylation was significantly attenuated by LY and MK treatment (normalized to total Akt). Mean ± S.E. (n = 4). D, siFOG2 transfection significantly increased phosphorylation of ERK. This increased ERK phosphorylation was significantly decreased by LY, but not by MK treatment (normalized to total ERK). Mean ± S.E. (n = 4). ** and * indicate p < 0.01 and p < 0.05, respectively.
Similarly, in 200b-M transfected MMC, FOG2 protein levels were significantly decreased (Fig. 9, A and B). This was accompanied by an increase in Akt phosphorylation. Activated Akt in 200b-M-transfected MMC was attenuated in LY-294002- and MK-2206-treated MMC (Fig. 9, A and C), showing that Akt activation associated with FOG2 down-regulation induced by miR-200b/c is PI3K-dependent. In addition, ERK phosphorylation was significantly increased in 200b-M-transfected MMC, and this was significantly attenuated by LY-294002 treatment. However, increased ERK phosphorylation induced by 200b-M was not blocked by MK-2206, suggesting that ERK is not downstream of Akt in MMC (Fig. 9, A and D). These results suggest that, in addition to Akt, ERK is also activated through miR-200b/c-induced FOG2 down-regulation. Moreover, the results also suggest that FOG2-regulated activation of both Akt and ERK is through a common upstream effector, PI3K.
FIGURE 9.
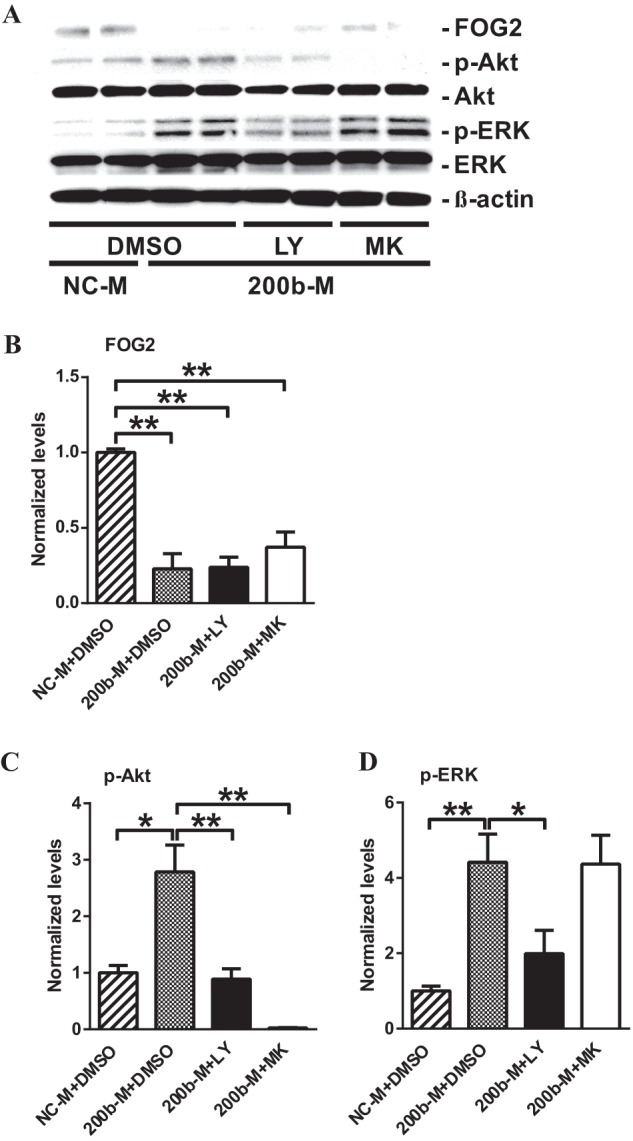
miR-200b-induced FOG2 down-regulation phosphorylates ERK as well as Akt in a PI3K-dependent manner in MMC. A–D, immunoblotting analysis of MMC after miR-200b mimic (200b-M) transfection followed by LY-294002 (LY) and MK-2206 (MK) treatment. 200b-M transfected MMC were treated with either 20 μm LY or 1 μm MK for 24 h. B, FOG2 protein levels significantly decreased after 200b-M transfection (normalized to β-actin). Mean ± S.E. (n = 4). C, transfection with 200b-M increased phosphorylation of Akt. This increase in Akt phosphorylation was significantly attenuated by LY and MK treatment (normalized to total Akt). Mean ± S.E. (n = 4). D, 200b-M transfection significantly increased phosphorylation of ERK. This increased ERK phosphorylation was significantly decreased by LY, but not by MK treatment (normalized to total ERK). Mean ± S.E. (n = 4). ** and * indicate p < 0.01 and p < 0.05, respectively.
miR-200b/c Enhance Hypertrophy in MMC
Because miR-200b/c could down-regulate FOG2 and subsequently enhance Akt phosphorylation, we further examined whether miR-200b/c can also directly increase glomerular mesangial cell hypertrophy, a downstream consequence of Akt or ERK phosphorylation. Transfection of MMC with 200b-M or 200c-M significantly increased cellular protein content compared with control NC-M-transfected MMC (Fig. 10A). In addition, transfection with a mixture of 200b-I and 200c-I significantly attenuated the TGF-β-induced increase in cellular protein content relative to that seen in NC-I-transfected MMC (Fig. 10B). These results suggest that, in response to TGF-β or diabetic conditions, up-regulated miR-200b/c, which targets FOG2, can lead to a down-regulation of FOG2 and subsequent increase in Akt (and ERK) phosphorylation to promote hypertrophy in MMC (Fig. 11).
FIGURE 10.
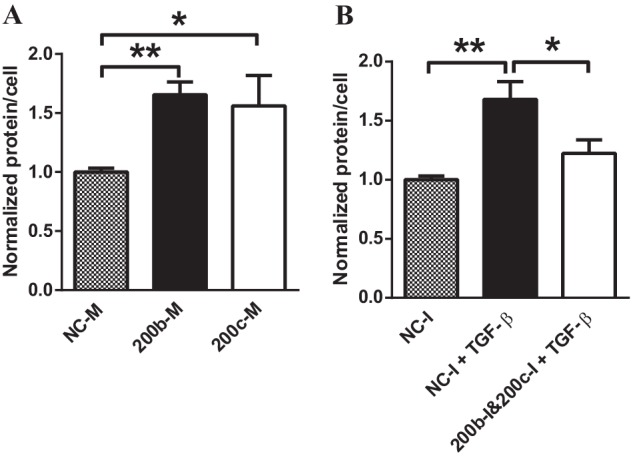
miR-200b and miR-200c regulate TGF-β-induced hypertrophy in MMC. A and B, cellular protein levels were calculated as ratios of total protein amount/total cell number. A, protein levels (hypertrophy) were increased in cells transfected with miR-200b and miR-200c mimics. Mean ± S.E. (n = 4). B, TGF-β treatment increased hypertrophy in serum-depleted cells. Transfection with miR-200b and miR-200c inhibitors attenuated TGF-β-induced hypertrophy. Mean ± S.E. (n = 4). ** and * indicate p < 0.01 and p < 0.05, respectively.
FIGURE 11.
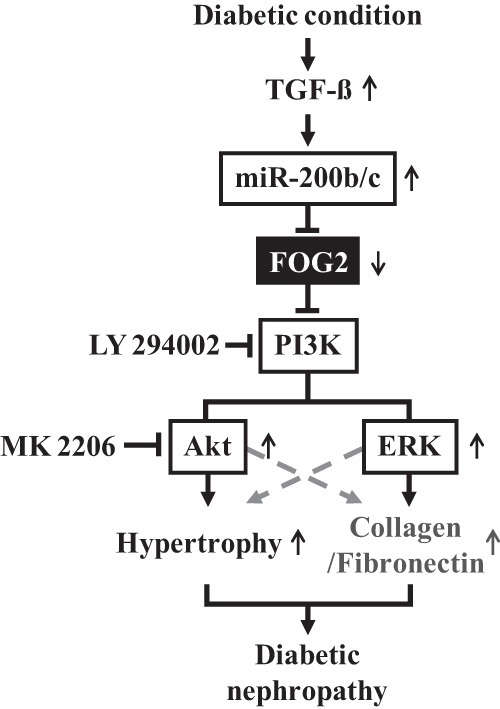
Schematic model of Akt and ERK activation and hypertrophy through miR-200b/c and FOG2 pathway in response to TGF-β in the pathogenesis of diabetic nephropathy. TGF-β induced by diabetic conditions up-regulates miR-200b/c which targets FOG2, ensuing a down-regulation of FOG2. The decrease in FOG2 increases PI3K and Akt activation, leading to MMC hypertrophy. In addition, increased PI3K by FOG2 down-regulation also activates ERK, which can play a role in fibrosis and other mechanisms related to diabetic nephropathy.
DISCUSSION
In this study, we showed for the first time that diabetic conditions can down-regulate FOG2 and that the down-regulation of FOG2 plays a role in TGF-β-induced Akt activation in MC. In addition, FOG2 down-regulation by miR-200b and miR-200c was demonstrated to induce hypertrophy in MMC, thus identifying FOG2 as a new regulator in the pathogenesis of DN. Moreover, we have shown that, in addition to Akt, ERK, which is also one of the key players implicated in DN, could also be activated by the down-regulation of FOG2.
Our current results demonstrate an additional novel pathway by which Akt is activated by TGF-β. Accumulating evidence shows that TGF-β plays a key role in the pathogenesis of DN, which has been attributed to the activation of its downstream targets (1, 2, 10, 11). The Smad signaling pathway has been the best characterized effector of TGF-β receptor activation and signaling in DN progression (39, 40). However, the PI3K-Akt pathway has also been implicated in mediating the cellular effects of TGF-β in DN (15, 17, 18). Reports show that the PI3K-Akt signaling cascade triggered by TGF-β induces glomerular mesangial and renal tubular hypertrophy, important pathologic phenotypic changes in the course of DN progression (16, 41). Because of its well known role as a signal transducer of TGF-β in DN, the mechanisms by which TGF-β activates Akt has elicited much interest. Down-regulation of PTEN by TGF-β has been implicated in Akt activation (16), and recently, we showed that miR-216a- and miR-217-mediated down-regulation of PTEN, which de-phosphorylates phosphatidylinositol 1,4,5-trisphosphate to inhibit Akt activation, is a key mechanism of Akt activation by TGF-β in MMC (19). In addition to these previously suggested pathways, our current results demonstrate that another mechanism involving miR-200b/c targeting FOG2, which inhibits PI3K activity, can also contribute to TGF-β-induced Akt activation in mesangial cells under diabetic conditions. These results imply that TGF-β activates Akt through several indirect mechanisms mediated by key miRNAs and signaling intermediates. One report showed that, although TGF-β receptor activation induces PI3K activity, the TGF-β receptor and the regulatory subunit of PI3K do not bind directly (18) thereby suggesting several modes of Akt activation mechanisms, including our proposed indirect models.
The role of FOG2 in disease pathophysiology has not been clearly investigated although its physiologic functions have been demonstrated only recently. Previous studies have been mainly focused on the role of FOG2 in hematopoiesis and heart development (42, 43). In addition, FOG2 was found to be down-regulated in lung and prostate cancers, suggesting that it may possess tumor suppressor properties (44, 45). As indicated earlier, a recent study suggested that FOG2 plays a key role in insulin signaling in liver cells and adipocytes, although the physiologic relevance is not fully clear (35). Insulin receptor activation is known to transduce its signal through the PI3K-Akt pathway. FOG2 was shown to act as a negative modulator of the PI3K-Akt pathway by directly binding to p85α, the regulatory subunit of PI3K. Additionally, by targeting FOG2, the miR-200 family was implicated in the down-regulation of FOG2 to facilitate insulin signaling (35). Although these new players, miR-200 and FOG2, have broadened the understanding of physiologic Akt activation mechanisms in insulin signaling, the role of FOG2 in disease states is less understood. The results of this study reveal a novel new protective role for FOG2 against pathologic PI3K-Akt activation and hypertrophy in the glomerular mesangium in a disease state such as DN. In addition, they demonstrate that down-regulation of FOG2 can augment TGF-β-mediated signaling and Akt activation.
Interestingly, a recent transcriptome analysis of human renal glomeruli and tubular tissue from patients with diabetic kidney disease showed that FOG2 (also known as ZFPM2) transcript expression was significantly decreased in renal glomeruli of patients with DN compared with glomeruli from control healthy kidneys. However, FOG2 expression levels did not differ in tubular tissue from DN patients compared with healthy controls (46). This report supports the significance of FOG2 down-regulation in diabetic glomerulopathy and our observation that FOG2 levels are lower in the glomeruli of both type 1 and type 2 diabetic mice. It also suggests that FOG2 might not play a significant role in renal tubular pathophysiology under diabetic conditions. Furthermore, the decreased FOG2 transcript expression in glomeruli from human subjects with DN suggests that the proposed miR-200-FOG2-Akt pathway may be significant not only in experimental animal models but also in human diabetic kidney disease as well.
It is possible that TGF-β induced in mesangial cells under diabetic conditions can up-regulate miR-200b/c via Smad3. A recent report demonstrated that Smad3 directly binds to a Smad-binding element located in the promoter region of miR-200b, functioning as a transcriptional activator in gastric cancer cells (47). In addition, our previous results have shown that miR-192 induced by TGF-β can target and down-regulate Zeb1/2 (E-box repressors) and thereby enhance the expression of miR-200b/c probably through E-boxes in their promoters (27). Moreover, miR-200 family also targets Zeb1/2, further enhancing the expression of miR-200 family itself through a positive feedback loop under diabetic conditions (27). miR-200b was reported to be up-regulated not only in mesangial cells but also in endothelial cells and podocytes treated with high glucose (28). In addition, increased levels of the miR-200 family members were also observed in human kidneys from hypertensive nephrosclerosis, IgA nephropathy, and lupus nephritis patients, suggesting a key role for miR-200 in renal diseases and TGF-β actions (48–50). We recently demonstrated a pro-fibrotic role for miR-200b/c in enhancing the expression of TGF-β, collagen type I α-2, and collagen type IV α-1, by targeting Zeb1/2, repressors that bind to the promoters of these genes (27). In this study, we found that miR-200b/c can down-regulate FOG2, an inhibitor of PI3K. Our observation that there is a more rapid decrease in FOG2 protein levels compared with mRNA levels after TGF-β treatment in MMC (Fig. 3, A and B) further supports the operation of this post-transcriptional regulation. The current results suggest that, in addition to accelerating renal fibrosis, miR-200b/c play a role in transducing TGF-β signals by activating the PI3K-Akt pathway, thereby promoting glomerular mesangial hypertrophy. It is also noteworthy that a single miRNA (miR-200) family can act on multiple targets (Zeb1/2 and FOG2), which work in conjunction to manifest the pathologic changes seen in the kidney under diabetic conditions.
miR-200a has also been reported to be decreased in some models of increased renal fibrosis and epithelial to mesenchymal transition (32), which could be due to differences in the models and experimental conditions used as well as cell type specificity in the actions of miR-200 family members. However, Kim et al. (51) showed that miR-200a and miR-141 are not efficiently extracted because of low GC content. Therefore, it is possible that in some instances, the levels of low GC content miRNAs like miR-200a may be underestimated even though they are not decreased (and likely even increased). miR-200b (not affected by extraction methods according to the same paper) was shown to be increased in some reports (27, 28). In this study, we also detected increased levels of miR-200b and miR-200c under our experimental conditions.
It is possible that FOG2 is also regulated by other miRNAs besides miR-200b/c. miRNAs such as miR-103 and miR-183 have potential binding sequences in the 3′UTR of FOG2 (predicted by TargetScan). Several miRNAs that are highly expressed in the kidney have been previously found to be up-regulated in the glomeruli of diabetic animal models compared with corresponding controls (3, 19, 22, 27–29, 34, 52, 53). In addition, some of these miRNAs were also shown to be increased in HG- or TGF-β-treated mesangial cells (27–29, 34). However, in these studies, miRNAs potentially targeting FOG2, other than miR-200b/c, were not found to be differentially expressed in the diabetic environment in the kidney or mesangial cells, thus supporting the notion that miR-200b/c could be the main miRNAs regulating FOG2 in renal glomeruli or MC under diabetic conditions. Nevertheless, the involvement of other miRNAs cannot be fully ruled out.
Akt has been shown to be activated in response to TGF-β signaling in several cell types (15, 19, 54). TGF-β also enhances Akt phosphorylation in multiple renal cells, including glomerular mesangial cells, podocytes, and renal tubular cells (15, 19, 37, 55, 56). However, in hematopoietic cells, TGF-β has been shown to inhibit Akt phosphorylation by inducing the phosphatase SHIP, an inhibitor of Akt activation (57). In addition, in adult hepatocytes, TGF-β failed to activate Akt (58). Therefore, although our results demonstrate that FOG2 can modulate TGF-β-Akt signaling in glomerular mesangial cells, the role of FOG2 in TGF-β signal transduction may also be cell type- as well as disease-specific.
Interestingly, ERK was also activated during miR-200b/c-induced FOG2 down-regulation. ERK activation is known to be involved in TGF-β-induced collagen expression as well as HG-induced cellular hypertrophy in mesangial cells (59–61). Blockage of ERK by specific ERK inhibitors has been shown to attenuate high glucose-induced cellular hypertrophy and fibronectin expression in mesangial cells and renal tubular cells (62, 63), suggesting ERK as one of the signaling pathways in the progression of DN along with Akt (64). However, the molecular mechanisms by which TGF-β activates ERK are not fully understood. The present findings raise the possibility that FOG2 down-regulation by miR-200b/c could be a common pathway in PI3K-dependent activation of both Akt and ERK, regulating both the early hypertrophic features as well as later glomerular fibrotic characteristics of DN. Therefore, the pathologic changes found in mesangial cells under diabetic conditions might be due to the activation of both Akt and ERK through a common effector, PI3K.
The up-regulation of FOG2 by miR-200b/c inhibitors in TGF-β-treated cells was sufficient not only to attenuate Akt activation but also to abrogate TGF-β-induced hypertrophy. Renal hypertrophy is recognized as an early pathologic finding in the course of DN progression (5). In addition, hypertrophic growth precedes fibrotic changes in the kidney under diabetic conditions (6). Therefore, repressing renal hypertrophy by inhibiting miR-200b/c and restoring FOG2 in the early stages of DN could be novel approaches to slow down disease progression. Further in vivo investigations are necessary to evaluate this.
In summary, the current results demonstrate that post-transcriptional regulation of FOG2, a target of miR-200b/c which are induced by TGF-β in MMC, plays a role in activating the PI3K-Akt-ERK pathway under diabetic conditions (Fig. 11). This new link could be an additional novel mechanism by which TGF-β induces cellular hypertrophy and fibrosis in DN, thereby leading to renal disease progression.
Acknowledgments
We are grateful to members of the Natarajan laboratory for their helpful discussions. We also thank Dr. Katalin Susztak (University of Pennsylvania) for information on human DN patient glomeruli gene expression (46).
This work was supported, in whole or in part, by National Institutes of Health Grants DK081705 and DK058191 (to R. N.) and an NIDDK supplement (for N. C.). This work was also supported by a mentor-based post-doctoral fellowship from the American Diabetes Association (to N. C.).
- DN
- diabetic nephropathy
- MMC
- mouse mesangial cell
- PTEN
- Phosphatase and tensin homolog
- miRNA
- MicroRNA
- CON
- nondiabetic control mice
- STZ
- streptozotocin-induced diabetic mice
- LY
- LY-294002
- MK
- MK-2206
- DMSO
- dimethyl sulfoxide
- NG
- normal glucose
- HG
- high glucose
- siFOG2
- FOG2 siRNA
- siNTC
- nontarget control siRNA
- 200b-M
- miR-200b mimic
- 200c-M
- miR-200c mimic
- NC-M
- negative control mimic
- 200b-I
- miR-200b inhibitor
- 200c-I
- miR-200c inhibitor
- NC-I
- negative control inhibitor.
REFERENCES
- 1. Brosius F. C., Khoury C. C., Buller C. L., Chen S. (2010) Abnormalities in signaling pathways in diabetic nephropathy. Expert Rev. Endocrinol. Metab. 5, 51–64 [DOI] [PMC free article] [PubMed] [Google Scholar]
- 2. Kanwar Y. S., Sun L., Xie P., Liu F. Y., Chen S. (2011) A glimpse of various pathogenetic mechanisms of diabetic nephropathy. Annu. Rev. Pathol. 6, 395–423 [DOI] [PMC free article] [PubMed] [Google Scholar]
- 3. Kato M., Park J. T., Natarajan R. (2012) MicroRNAs and the glomerulus. Exp. Cell Res. 318, 993–1000 [DOI] [PMC free article] [PubMed] [Google Scholar]
- 4. Ziyadeh F. N. (1993) The extracellular matrix in diabetic nephropathy. Am. J. Kidney Dis. 22, 736–744 [DOI] [PubMed] [Google Scholar]
- 5. Wolf G., Ziyadeh F. N. (1999) Molecular mechanisms of diabetic renal hypertrophy. Kidney Int. 56, 393–405 [DOI] [PubMed] [Google Scholar]
- 6. O'Bryan G. T., Hostetter T. H. (1997) The renal hemodynamic basis of diabetic nephropathy. Semin. Nephrol. 17, 93–100 [PubMed] [Google Scholar]
- 7. García Z., Kumar A., Marqués M., Cortés I., Carrera A. C. (2006) Phosphoinositide 3-kinase controls early and late events in mammalian cell division. EMBO J. 25, 655–661 [DOI] [PMC free article] [PubMed] [Google Scholar]
- 8. Gewin L., Zent R. (2012) How does TGF-β mediate tubulointerstitial fibrosis? Semin. Nephrol. 32, 228–235 [DOI] [PMC free article] [PubMed] [Google Scholar]
- 9. Sharma K., Ziyadeh F. N. (1994) Renal hypertrophy is associated with up-regulation of TGF-β1 gene expression in diabetic BB rat and NOD mouse. Am. J. Physiol. 267, F1094–F1001 [DOI] [PubMed] [Google Scholar]
- 10. Sharma K., Ziyadeh F. N. (1995) Hyperglycemia and diabetic kidney disease. The case for transforming growth factor-β as a key mediator. Diabetes 44, 1139–1146 [DOI] [PubMed] [Google Scholar]
- 11. Yamamoto T., Nakamura T., Noble N. A., Ruoslahti E., Border W. A. (1993) Expression of transforming growth factor β is elevated in human and experimental diabetic nephropathy. Proc. Natl. Acad. Sci. U.S.A. 90, 1814–1818 [DOI] [PMC free article] [PubMed] [Google Scholar]
- 12. Hoffman B. B., Sharma K., Zhu Y., Ziyadeh F. N. (1998) Transcriptional activation of transforming growth factor-β1 in mesangial cell culture by high glucose concentration. Kidney Int. 54, 1107–1116 [DOI] [PubMed] [Google Scholar]
- 13. Zhu Y., Casado M., Vaulont S., Sharma K. (2005) Role of upstream stimulatory factors in regulation of renal transforming growth factor-β1. Diabetes 54, 1976–1984 [DOI] [PubMed] [Google Scholar]
- 14. Ziyadeh F. N., Hoffman B. B., Han D. C., Iglesias-De La Cruz M. C., Hong S. W., Isono M., Chen S., McGowan T. A., Sharma K. (2000) Long-term prevention of renal insufficiency, excess matrix gene expression, and glomerular mesangial matrix expansion by treatment with monoclonal antitransforming growth factor-β antibody in db/db diabetic mice. Proc. Natl. Acad. Sci. U.S.A. 97, 8015–8020 [DOI] [PMC free article] [PubMed] [Google Scholar]
- 15. Ghosh Choudhury G., Abboud H. E. (2004) Tyrosine phosphorylation-dependent PI 3-kinase/Akt signal transduction regulates TGFβ-induced fibronectin expression in mesangial cells. Cell. Signal. 16, 31–41 [DOI] [PubMed] [Google Scholar]
- 16. Mahimainathan L., Das F., Venkatesan B., Choudhury G. G. (2006) Mesangial cell hypertrophy by high glucose is mediated by down-regulation of the tumor suppressor PTEN. Diabetes 55, 2115–2125 [DOI] [PubMed] [Google Scholar]
- 17. Runyan C. E., Schnaper H. W., Poncelet A. C. (2004) The phosphatidylinositol 3-kinase/Akt pathway enhances Smad3-stimulated mesangial cell collagen I expression in response to transforming growth factor-β1. J. Biol. Chem. 279, 2632–2639 [DOI] [PubMed] [Google Scholar]
- 18. Yi J. Y., Shin I., Arteaga C. L. (2005) Type I transforming growth factor β receptor binds to and activates phosphatidylinositol 3-kinase. J. Biol. Chem. 280, 10870–10876 [DOI] [PubMed] [Google Scholar]
- 19. Kato M., Putta S., Wang M., Yuan H., Lanting L., Nair I., Gunn A., Nakagawa Y., Shimano H., Todorov I., Rossi J. J., Natarajan R. (2009) TGF-β activates Akt kinase through a microRNA-dependent amplifying circuit targeting PTEN. Nat. Cell Biol. 11, 881–889 [DOI] [PMC free article] [PubMed] [Google Scholar]
- 20. Bartel D. P. (2009) MicroRNAs: target recognition and regulatory functions. Cell 136, 215–233 [DOI] [PMC free article] [PubMed] [Google Scholar]
- 21. Inui M., Martello G., Piccolo S. (2010) MicroRNA control of signal transduction. Nat. Rev. 11, 252–263 [DOI] [PubMed] [Google Scholar]
- 22. Kato M., Zhang J., Wang M., Lanting L., Yuan H., Rossi J. J., Natarajan R. (2007) MicroRNA-192 in diabetic kidney glomeruli and its function in TGFβ-induced collagen expression via inhibition of E-box repressors. Proc. Natl. Acad. Sci. U.S.A. 104, 3432–3437 [DOI] [PMC free article] [PubMed] [Google Scholar]
- 23. Chung A. C., Huang X. R., Meng X., Lan H. Y. (2010) miR-192 mediates TGF-β/Smad3-driven renal fibrosis. J. Am. Soc. Nephrol. 21, 1317–1325 [DOI] [PMC free article] [PubMed] [Google Scholar]
- 24. Dey N., Das F., Mariappan M. M., Mandal C. C., Ghosh-Choudhury N., Kasinath B. S., Choudhury G. G. (2011) MicroRNA-21 orchestrates high glucose-induced signals to TOR complex 1, resulting in renal cell pathology in diabetes. J. Biol. Chem. 286, 25586–25603 [DOI] [PMC free article] [PubMed] [Google Scholar]
- 25. Kato M., Arce L., Natarajan R. (2009) MicroRNAs and their role in progressive kidney diseases. Clin. J. Am. Soc. Nephrol. 4, 1255–1266 [DOI] [PMC free article] [PubMed] [Google Scholar]
- 26. Kantharidis P., Wang B., Carew R. M., Lan H. Y. (2011) Diabetes complications: the microRNA perspective. Diabetes 60, 1832–1837 [DOI] [PMC free article] [PubMed] [Google Scholar]
- 27. Kato M., Arce L., Wang M., Putta S., Lanting L., Natarajan R. (2011) A microRNA circuit mediates transforming growth factor-β1 autoregulation in renal glomerular mesangial cells. Kidney Int. 80, 358–368 [DOI] [PMC free article] [PubMed] [Google Scholar]
- 28. Long J., Wang Y., Wang W., Chang B. H., Danesh F. R. (2011) MicroRNA-29c is a signature microRNA under high glucose conditions that targets Sprouty homolog 1, and its in vivo knockdown prevents progression of diabetic nephropathy. J. Biol. Chem. 286, 11837–11848 [DOI] [PMC free article] [PubMed] [Google Scholar]
- 29. Kato M., Wang L., Putta S., Wang M., Yuan H., Sun G., Lanting L., Todorov I., Rossi J. J., Natarajan R. (2010) Post-transcriptional up-regulation of Tsc-22 by Ybx1, a target of miR-216a, mediates TGF-β-induced collagen expression in kidney cells. J. Biol. Chem. 285, 34004–34015 [DOI] [PMC free article] [PubMed] [Google Scholar]
- 30. Lorenzen J. M., Haller H., Thum T. (2011) MicroRNAs as mediators and therapeutic targets in chronic kidney disease. Nat. Rev. Nephrol. 7, 286–294 [DOI] [PubMed] [Google Scholar]
- 31. Natarajan R., Putta S., Kato M. (2012) MicroRNAs and diabetic complications. J. Cardiovasc. Transl. Res. 5, 413–422 [DOI] [PMC free article] [PubMed] [Google Scholar]
- 32. Wang B., Koh P., Winbanks C., Coughlan M. T., McClelland A., Watson A., Jandeleit-Dahm K., Burns W. C., Thomas M. C., Cooper M. E., Kantharidis P. (2011) miR-200a prevents renal fibrogenesis through repression of TGF-β2 expression. Diabetes 60, 280–287 [DOI] [PMC free article] [PubMed] [Google Scholar]
- 33. Wang B., Komers R., Carew R., Winbanks C. E., Xu B., Herman-Edelstein M., Koh P., Thomas M., Jandeleit-Dahm K., Gregorevic P., Cooper M. E., Kantharidis P. (2012) Suppression of microRNA-29 expression by TGF-beta1 promotes collagen expression and renal fibrosis. J. Am. Soc. Nephrol. 23, 252–265 [DOI] [PMC free article] [PubMed] [Google Scholar]
- 34. Wang Q., Wang Y., Minto A. W., Wang J., Shi Q., Li X., Quigg R. J. (2008) MicroRNA-377 is up-regulated and can lead to increased fibronectin production in diabetic nephropathy. FASEB J. 22, 4126–4135 [DOI] [PMC free article] [PubMed] [Google Scholar]
- 35. Hyun S., Lee J. H., Jin H., Nam J., Namkoong B., Lee G., Chung J., Kim V. N. (2009) Conserved MicroRNA miR-8/miR-200 and its target USH/FOG2 control growth by regulating PI3K. Cell 139, 1096–1108 [DOI] [PubMed] [Google Scholar]
- 36. Kato M., Dang V., Wang M., Park J. T., Deshpande S., Kadam S., Mardiros A., Zhan Y., Oettgen P., Putta S., Yuan H., Lanting L., Natarajan R. (2013) TGF-β induces acetylation of chromatin and of Ets-1 to alleviate repression of miR-192 in diabetic nephropathy. Sci. Signal. 6, ra43. [DOI] [PMC free article] [PubMed] [Google Scholar]
- 37. Kato M., Yuan H., Xu Z. G., Lanting L., Li S. L., Wang M., Hu M. C., Reddy M. A., Natarajan R. (2006) Role of the Akt/FoxO3a pathway in TGF-β1-mediated mesangial cell dysfunction: a novel mechanism related to diabetic kidney disease. J. Am. Soc. Nephrol. 17, 3325–3335 [DOI] [PubMed] [Google Scholar]
- 38. Hirai H., Sootome H., Nakatsuru Y., Miyama K., Taguchi S., Tsujioka K., Ueno Y., Hatch H., Majumder P. K., Pan B. S., Kotani H. (2010) MK-2206, an allosteric Akt inhibitor, enhances antitumor efficacy by standard chemotherapeutic agents or molecular targeted drugs in vitro and in vivo. Mol. Cancer Ther. 9, 1956–1967 [DOI] [PubMed] [Google Scholar]
- 39. Böttinger E. P. (2007) TGF-β in renal injury and disease. Semin. Nephrol. 27, 309–320 [DOI] [PubMed] [Google Scholar]
- 40. Schnaper H. W., Hayashida T., Poncelet A. C. (2002) It's a Smad world: regulation of TGF-β signaling in the kidney. J. Am. Soc. Nephrol. 13, 1126–1128 [DOI] [PubMed] [Google Scholar]
- 41. Chuang T. D., Guh J. Y., Chiou S. J., Chen H. C., Huang J. S., Yang Y. L., Chuang L. Y. (2007) Phosphoinositide 3-kinase is required for high glucose-induced hypertrophy and p21WAF1 expression in LLC-PK1 cells. Kidney Int. 71, 867–874 [DOI] [PubMed] [Google Scholar]
- 42. Fossett N., Schulz R. A. (2001) Conserved cardiogenic functions of the multitype zinc-finger proteins: U-shaped and FOG-2. Trends Cardiovasc. Med. 11, 185–190 [DOI] [PubMed] [Google Scholar]
- 43. Fossett N., Tevosian S. G., Gajewski K., Zhang Q., Orkin S. H., Schulz R. A. (2001) The friend of GATA proteins U-shaped, FOG-1, and FOG-2 function as negative regulators of blood, heart, and eye development in Drosophila. Proc. Natl. Acad. Sci. U.S.A. 98, 7342–7347 [DOI] [PMC free article] [PubMed] [Google Scholar]
- 44. Nanni S., Priolo C., Grasselli A., D'Eletto M., Merola R., Moretti F., Gallucci M., De Carli P., Sentinelli S., Cianciulli A. M., Mottolese M., Carlini P., Arcelli D., Helmer-Citterich M., Gaetano C., Loda M., Pontecorvi A., Bacchetti S., Sacchi A., Farsetti A. (2006) Epithelial-restricted gene profile of primary cultures from human prostate tumors: a molecular approach to predict clinical behavior of prostate cancer. Mol. Cancer Res. 4, 79–92 [DOI] [PubMed] [Google Scholar]
- 45. Wachi S., Yoneda K., Wu R. (2005) Interactome-transcriptome analysis reveals the high centrality of genes differentially expressed in lung cancer tissues. Bioinformatics 21, 4205–4208 [DOI] [PMC free article] [PubMed] [Google Scholar]
- 46. Woroniecka K. I., Park A. S., Mohtat D., Thomas D. B., Pullman J. M., Susztak K. (2011) Transcriptome analysis of human diabetic kidney disease. Diabetes 60, 2354–2369 [DOI] [PMC free article] [PubMed] [Google Scholar]
- 47. Ahn S. M., Cha J. Y., Kim J., Kim D., Trang H. T., Kim Y. M., Cho Y. H., Park D., Hong S. (2012) Smad3 regulates E-cadherin via miRNA-200 pathway. Oncogene 31, 3051–3059 [DOI] [PubMed] [Google Scholar]
- 48. Dai Y., Sui W., Lan H., Yan Q., Huang H., Huang Y. (2009) Comprehensive analysis of microRNA expression patterns in renal biopsies of lupus nephritis patients. Rheumatol. Int. 29, 749–754 [DOI] [PubMed] [Google Scholar]
- 49. Wang G., Kwan B. C., Lai F. M., Choi P. C., Chow K. M., Li P. K., Szeto C. C. (2010) Intrarenal expression of microRNAs in patients with IgA nephropathy. Lab. Invest. 90, 98–103 [DOI] [PubMed] [Google Scholar]
- 50. Wang G., Kwan B. C., Lai F. M., Choi P. C., Chow K. M., Li P. K., Szeto C. C. (2010) Intrarenal expression of miRNAs in patients with hypertensive nephrosclerosis. Am. J. Hypertens. 23, 78–84 [DOI] [PubMed] [Google Scholar]
- 51. Kim Y. K., Yeo J., Kim B., Ha M., Kim V. N. (2012) Short structured RNAs with low GC content are selectively lost during extraction from a small number of cells. Mol. Cell 46, 893–895 [DOI] [PubMed] [Google Scholar]
- 52. Sun Y., Koo S., White N., Peralta E., Esau C., Dean N. M., Perera R. J. (2004) Development of a micro-array to detect human and mouse microRNAs and characterization of expression in human organs. Nucleic Acids Res. 32, e188. [DOI] [PMC free article] [PubMed] [Google Scholar]
- 53. Tian Z., Greene A. S., Pietrusz J. L., Matus I. R., Liang M. (2008) MicroRNA-target pairs in the rat kidney identified by microRNA microarray, proteomic, and bioinformatic analysis. Genome Res. 18, 404–411 [DOI] [PMC free article] [PubMed] [Google Scholar]
- 54. Bakin A. V., Tomlinson A. K., Bhowmick N. A., Moses H. L., Arteaga C. L. (2000) Phosphatidylinositol 3-kinase function is required for transforming growth factor β-mediated epithelial to mesenchymal transition and cell migration. J. Biol. Chem. 275, 36803–36810 [DOI] [PubMed] [Google Scholar]
- 55. Lee H. T., Kim M., Song J. H., Chen S. W., Gubitosa G., Emala C. W. (2008) Sevoflurane-mediated TGF-β1 signaling in renal proximal tubule cells. Am. J. Physiol. Renal Physiol. 294, F371–F378 [DOI] [PubMed] [Google Scholar]
- 56. Schiffer M., Mundel P., Shaw A. S., Böttinger E. P. (2004) A novel role for the adaptor molecule CD2-associated protein in transforming growth factor-β-induced apoptosis. J. Biol. Chem. 279, 37004–37012 [DOI] [PubMed] [Google Scholar]
- 57. Valderrama-Carvajal H., Cocolakis E., Lacerte A., Lee E. H., Krystal G., Ali S., Lebrun J. J. (2002) Activin/TGF-β induce apoptosis through Smad-dependent expression of the lipid phosphatase SHIP. Nat. Cell Biol. 4, 963–969 [DOI] [PubMed] [Google Scholar]
- 58. Caja L., Ortiz C., Bertran E., Murillo M. M., Miró-Obradors M. J., Palacios E., Fabregat I. (2007) Differential intracellular signalling induced by TGF-β in rat adult hepatocytes and hepatoma cells: implications in liver carcinogenesis. Cell. Signal. 19, 683–694 [DOI] [PubMed] [Google Scholar]
- 59. Goruppi S., Bonventre J. V., Kyriakis J. M. (2002) Signaling pathways and late-onset gene induction associated with renal mesangial cell hypertrophy. EMBO J. 21, 5427–5436 [DOI] [PMC free article] [PubMed] [Google Scholar]
- 60. Hayashida T., Poncelet A. C., Hubchak S. C., Schnaper H. W. (1999) TGF-β1 activates MAP kinase in human mesangial cells: a possible role in collagen expression. Kidney Int. 56, 1710–1720 [DOI] [PubMed] [Google Scholar]
- 61. Wolf G., Reinking R., Zahner G., Stahl R. A., Shankland S. J. (2003) Erk 1,2 phosphorylates p27(Kip1): Functional evidence for a role in high glucose-induced hypertrophy of mesangial cells. Diabetologia 46, 1090–1099 [DOI] [PubMed] [Google Scholar]
- 62. Fujita H., Omori S., Ishikura K., Hida M., Awazu M. (2004) ERK and p38 mediate high-glucose-induced hypertrophy and TGF-β expression in renal tubular cells. Am. J. Physiol. Renal Physiol. 286, F120–F126 [DOI] [PubMed] [Google Scholar]
- 63. Lin C. L., Wang F. S., Kuo Y. R., Huang Y. T., Huang H. C., Sun Y. C., Kuo Y. H. (2006) Ras modulation of superoxide activates ERK-dependent fibronectin expression in diabetes-induced renal injuries. Kidney Int. 69, 1593–1600 [DOI] [PubMed] [Google Scholar]
- 64. Haneda M., Araki S., Togawa M., Sugimoto T., Isono M., Kikkawa R. (1997) Mitogen-activated protein kinase cascade is activated in glomeruli of diabetic rats and glomerular mesangial cells cultured under high glucose conditions. Diabetes 46, 847–853 [DOI] [PubMed] [Google Scholar]


