

Background: NMDA receptors are ion channels activated by glutamate and glycine and inhibited by zinc.
Results: Zinc binding causes a decrease in distance between the amino-terminal domain lower and upper lobes without affecting intersubunit distances.
Conclusion: Zinc induces cleft closure in the amino-terminal domain without causing large scale rearrangements in the upper lobe of the ATD tetramer.
Significance: This work demonstrates zinc-induced conformational changes in a functional NMDA receptor.
Keywords: Allosteric Regulation; Fluorescence Resonance Energy Transfer (FRET); Glutamate Receptors Ionotropic (AMPA, NMDA); Ion Channels; Zinc; LRET; Amino-terminal Domain
Abstract
N-Methyl-d-aspartate (NMDA) receptors mediate excitatory neurotransmission in the mammalian central nervous system. An important feature of these receptors is their capacity for allosteric regulation by small molecules, such as zinc, which bind to their amino-terminal domain (ATD). Zinc inhibition through high affinity binding to the ATD has been examined through functional studies; however, there is no direct measurement of associated conformational changes. We used luminescence resonance energy transfer to show that the ATDs undergo a cleft closure-like conformational change upon binding zinc, but no changes are observed in intersubunit distances. Furthermore, we find that the ATDs are more closely packed than the related AMPA receptors. These results suggest that the stability of the upper lobe contacts between ATDs allow for the efficient propagation of the cleft closure conformational change toward the ligand-binding domain and transmembrane segments, ultimately inhibiting the channel.
Introduction
N-Methyl-d-aspartate (NMDA) receptors mediate rapid excitatory transmission in the central nervous system, and their dysfunction is implicated in a variety of neurological disorders including Alzheimer, Parkinson, and excitotoxicity during ischemic stroke (for review, see Ref. 1). NMDA receptors are obligate heteromers typically composed of glycine-binding GluN1 subunits and glutamate-binding GluN2 subunits. GluN2 subunits have four different subtypes A–D. Each subunit of the NMDA receptor is organized into distinct domains: the intracellular C-terminal domain, the transmembrane pore-forming region, the extracellular ligand-binding domain (LBD)4 and the amino-terminal domain (ATD). The ATD is important for receptor assembly (2), governing open channel probability (3), and allosteric regulation by small molecules (4, 5).
Recently, Karakas et al. reported the structure of the isolated ATDs of a GluN1/GluN2B NMDA receptor in a tetrameric configuration (6). The subunit arrangement in this structure is strikingly more compact than the ATDs in the full-length structure of the homologous AMPA receptor (Fig. 1). When measuring from the first amino-terminal residue in the AMPA receptor structure, the top of the most distal ATDs (subunits A and C) are 127 Å apart whereas the analogous GluN1 positions, according to sequence alignments, are separated by only 97 Å (Fig. 1) (7, 8). The distances between the GluN2 subunits, analogous to the AMPA receptor B and D subunits (Fig. 1), are even shorter with distances of 33 Å and 92 Å for NMDA and AMPA receptors, respectively (6, 7). This disparity raises the question of whether the NMDA receptors are in fact more compact than AMPA receptors or whether this proximity between dimers is due to the loss of lower domains in the isolated ATD structure. To test this, we have used luminescence resonance energy transfer (LRET) to map the tetramer organization in full-length, functional GluN1/GluN2A receptors.
FIGURE 1.

Comparison of intersubunit distances of the AMPA and NMDA receptor ATDs. A, crystal structure of the ATDs from the full-length GluA2 homotetramer is shown (PDB ID code 3KG2 (7)). The B and D subunits are in green, and the A and C subunits are in blue. Stated distances are measured from the α-carbon of Asn-10, shown in red. B, top view of the GluN1/GluN2B isolated ATD structure is shown (PDB ID code 3QEL (6)). The GluN2B subunits (corresponding to the B and D subunits of GluA2) are colored green, and the GluN1 subunits (conforming to the A and C subunits) are colored blue. Distances are measured from the α-carbon of Pro-24 of GluN1 and Pro-32 of GluN2B, shown in red.
The ATDs contain the binding sites of small molecule allosteric inhibitors such as zinc. Although zinc inhibits NMDA receptors through a voltage-dependent pore-blocking action (9), its allosteric inhibition through binding to the ATD is of particular interest. Allosteric inhibition by zinc is subtype-selective, exhibiting micromolar affinity for GluN2B subunits but nanomolar affinity for GluN2A subunits, where zinc binding reduces open channel probability (9–11). Moreover, this inhibition occurs at physiologically relevant zinc levels and/or during co-release of zinc with glutamate (12, 13). Modeling of the GluN2A ATD followed by functional studies of a GluN2A-containing NMDA receptor showed that key negatively charged residues at the “entrance” of the ATD cleft are involved in screening zinc binding to the ATD (4). Additionally, use of the substituted cysteine accessibility method within the ATD cleft first suggested that the ATD cleft may be closing around a ligand, similar to the LBDs or leucine/isoleucine/valine-binding proteins (4). Mutagenesis of the GluN2A ATD and the structure of the zinc-bound GluN2B ATD confirmed that zinc binds within the cleft of the bilobed structure of the ATD (8, 14, 15). Propping the ATD cleft open using thiol-reactive cross-linking agents increases open channel probability, suggesting that zinc binding to the ATD, which reduces open channel probability, proceeds through a cleft closure mechanism (3). Furthermore, molecular dynamics simulations support the premise that the ATD of GluN2A can undergo a cleft closure-type conformational change (16). Taken together, these data provide indirect evidence that zinc inhibits the NMDA receptor by closing the bilobed ATD and allosterically influencing conformational equilibrium between closed and open states. However, this change is not observed in the structure of the zinc-bound ATD of GluN2B (8), and no structural data demonstrating this cleft closure or measuring its extent have been reported (17). We employed LRET to detect these hypothesized zinc-induced conformational changes in the GluN2A ATD and to further determine whether zinc binding induces larger rearrangements between subunits.
EXPERIMENTAL PROCEDURES
Cloning and Mutagenesis
All constructs were in pcDNA3.1 vectors. To specifically label receptors with maleimide-derived fluorophores, all non-disulfide-bonded cysteines, as identified from existing crystal structures and previous work in our laboratory (18, 19), were mutated to serines: C22S and C67S for GluN1 (called GluN1*) and C231S, C395S, and C461S for GluN2A (called GluN2A*). Additionally, to measure distance changes in full-length receptors in intact membranes without protein purification, the thrombin cleavage site (LVPRGS) was introduced between donor and acceptor fluorophores (for sites, see Fig. 2). To label GluN1, Cys-22 was retained, referred to as GluN1*C22 (Fig. 2). To allow for comparison with the crystal structure distances, label sites at the amino terminus of GluN2A were inserted just before the first residue of the crystal structure (PDB ID code 3QEL) (6). Either a hexahistidine tag or cysteine was introduced after Lys-29, referred to as GluN2A*H30 or GluN2A*C30, respectively (Fig. 2). To probe conformational changes within the GluN2A cleft, Cys-231 was retained in the GluN2A*H30 construct, referred to as GluN2A*H30+C231 (Fig. 2). The zinc-insensitive mutant of GluN2A was made in the GluN2A*H30+C231 construct by introducing H44A and H128S mutations, which substantially reduce zinc affinity for the ATD, called GluN2A*H30+C231/DHM (14, 15). Mutations were introduced using traditional PCR methods and verified by sequencing.
FIGURE 2.

Schematic of an individual iGluR subunit showing label sites for LRET studies. The amino acid sequence and number for the label sites with the construct name are shown in addition to the labeled domains of the receptor. Residues that bind fluorophores are highlighted in red with thrombin cleavage sites shown in blue.
Protein Expression and Labeling
Chinese hamster ovary (CHO) cells were maintained in Ham's F12 Nutrient Mix (Invitrogen) supplemented with 10% FBS (Sigma-Aldrich) and penicillin/streptomycin (Invitrogen). Cells were passaged once they reached a confluence of 80–90%, approximately every 2 days. CHO cells were transfected using Lipofectamine 2000 (Invitrogen) with 5–12 μg of DNA/10-cm dish, at a GluN1:GluN2A μg ratio of 1:3 (20), a DNA:Lipofectamine ratio of 1:2, and when cells were 50–80% confluent. To induce expression of the NMDA receptor, cells were maintained in glutamine-free DMEM (Invitrogen) (21) for 1–2 h prior to transfection through their harvest for use in spectroscopic studies. Cells were allowed to express for at least 40 h in the presence of saturating concentrations of the inhibitor dl-2-Amino-5-phosphonopentanoic acid (dl-APV) before being harvested, labeled, and used for LRET studies. Cells were collected in extracellular buffer containing 1 mm CaCl2, 150 mm NaCl, 2.8 mm KCl, 10 mm HEPES, and EDTA-free Complete Protease Inhibitor Mixture (Roche Diagnostics), pH 7.3–7.5. CHO cells were labeled for 1 h at room temperature on a rotator in the dark using 200 nm donor and acceptor fluorophores in a 2–3-ml volume. The donor fluorophore used was always terbium chelate (Invitrogen), and the acceptor fluorophores were either Alexa Fluor 555 (Sigma-Aldrich) or Ni(NTA)2Cy3. Ni(NTA)2Cy3 was prepared as described previously (22) using bis-reactive Cy3 purchased from GE Healthcare. Briefly, free NTA (Dojindo Laboratories) was conjugated to the bis-reactive Cy3 dye in 0.1 m sodium carbonate. The doubly conjugated product was purified using preparative thin layer chromatography (TLC) and then conjugated to nickel.
Full-length receptors were expressed in Xenopus laevis oocytes as described previously (23). Briefly, oocytes were surgically removed from frogs anesthetized with 0.15% Tricaine solution (Sigma-Aldrich). Oocytes were defolliculated in type II collagenase (Worthington), and stage V and VI oocytes were selected and stored in Barth's solution containing 88 mm NaCl, 2.5 mm NaHCO3, 1.1 mm KCl, 0.4 mm CaCl2, 0.3 mm Ca(NO3)2, 0.8 mm MgCl2, 2.5 mm sodium pyruvate, 10 mm HEPES, pH 7.3, and 5 μg/ml gentamicin. RNA was prepared using the Ambion T7 mMessage mMachine Kit to transcribe the linearized DNA template. 20 ng of RNA was injected per oocyte at a GluN1:GluN2 ng ratio of 1:2 (23). Oocytes were allowed to recover at 12 °C for 12–24 h before being induced at 18 °C and preblocked with 1 mm β-maleimidopropionic acid for 1 h, which limited the number of free cysteines on the surface of the oocytes and subsequently helped reduce nonspecific labeling with the thiol-reactive fluorophores. Additionally, upon induction, oocytes were maintained in saturating concentrations of 5,7-dichlorokynurenic acid. 24 h after induction, oocytes were labeled with 2 μm donor and acceptor fluorophores for 1 h at 18 °C and washed three-five times with Barth's solution. Membrane fractions were prepared using a lysis buffer composed of 20 mm Tris-Cl, pH 8.0, 200 mm NaCl, 1% Triton X-100, and EDTA-free Complete Protease Inhibitor Mixture (Roche Diagnostics) in Barth's solution. Oocytes were homogenized using a Douncer, and the cell lysate was centrifuged for 15 min at 13,000 rpm and 4 °C to isolate the soluble membrane fraction. The final volume of the membrane fraction was then brought up to 2–3 ml with Barth's solution and used for LRET analysis.
LRET
Labeled cells or oocyte membrane fractions were probed in a cuvette-based LRET analysis using a QuantaMaster model QM3-SS with Fluorescan software (Photon Technology International). Data were analyzed with Origin 8.6 (OriginLab Corp.). Donor-only samples were excited at 337 nm, and emission was collected at 545 nm. Donor-acceptor-labeled samples were excited at 337 nm, and emission was collected at 565 nm for Alexa Fluor 555-labeled samples and at 575 nm for Ni(NTA)2Cy3-labeled samples. A Peltier TE temperature controller maintained the temperature at 15 °C for all recordings. Terbium chelate was the donor fluorophore used in each case. For the GluN1-GluN2A and the GluN2A ATD intrasubunit measurements, the acceptor fluorophore was Ni(NTA)2Cy3 (R0 = 65Å, with terbium). For the GluN2A-GluN2A and GluN1-GluN1 measurement, the acceptor fluorophore was Alexa Fluor 555 (R0 = 65 Å, with terbium). LRET was used in place of fluorescence resonance energy transfer (FRET) as the luminescent donor terbium chelate provides several advantages. First, terbium has a long, easily quantified lifetime (24). The long lifetime allows us to study selectively the donor-acceptor-labeled protein which has microsecond lifetimes, as donor-only-labeled protein has millisecond lifetimes and acceptor-only-labeled protein has nanosecond lifetimes. Second, terbium has four sharp emission peaks allowing a range of donor-acceptor pairs, useful when measuring a variety of distances (24).
Because these receptors were expressed in nonpurified systems of CHO cells and X. laevis oocytes, we employed a well established technique to subtract background fluorescence from our lifetime measurements (18, 23, 25, 26). Specifically, after obtaining acceptor lifetime measurements, five units of high activity bovine thrombin (Calbiochem) were added to the cuvette and allowed to cleave the receptor; cleavage was complete 1–3 h following addition of thrombin. Any resulting fluorescence detected following thrombin cleavage was considered background fluorescence due to labeling of other surface proteins and was subtracted from measurements obtained before thrombin cleavage.
Paoletti et al. demonstrated that zinc contaminates buffers in the nanomolar range. Considering the high affinity of GluN2A for zinc, it is probable that contaminating zinc would bind to expressed receptors (9). As such, all measurements in CHO cells were also measured in the presence of 10 mm Tricine to ensure any contaminating zinc did not affect our measurements. Zinc-bound measurements were made in the absence of Tricine and in the presence of 5–10 μm zinc chloride (Sigma). This concentration of zinc ensures that zinc-bound conformations of the ATD are maximally populated. Glutamate-glycine measurements were collected by adding glutamate and glycine to a final concentration of 1 mm and 100 μm, respectively, to zinc-bound receptors.
Distances were calculated using the Förster equation,
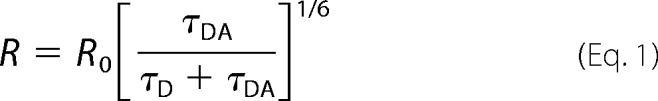 |
where R is the distance between the donor and acceptor fluorophores, R0 is the distance at which energy transfer between a given pair of fluorophores is half-maximal, τD is the lifetime of the donor when bound to the receptor, and τDA is the lifetime of the acceptor in the presence of the donor. Error in measurements was calculated using the Error Propagation Calculator developed by Thomas Huber in the Physics Department of Gustavus Adolphus College, which applies a propagation of errors from the fits of the lifetime decays of the LRET data. Biological repeats of each donor-acceptor lifetime, the n value, are given in parentheses in Tables 1 and 2. Each experiment is an average of at least 290 individual scans.
TABLE 1.
Lifetimes and distances of tetramer organization in GluN1-GluN2A NMDA receptors in CHO cells and oocytes

TABLE 2.
Lifetimes and distances of the GluN2A ATD cleft (∼48 Å in GluN2B ATD crystal structure)
| Ligated state (n) | Zinc-sensitive constructs: GluN1* + GluN2A*H30+C231 |
Zinc-insensitive mutant constructs: GluN1* + GluN2A*H30+C231/DHM |
||||
|---|---|---|---|---|---|---|
| Donor-only lifetime | Donor-acceptor lifetime | Distance | Donor-only lifetime | Donor-acceptor lifetime | Distance | |
| μs | μs | Å | μs | μs | Å | |
| Apo (4–6) | 1546 ± 1.4 | 316 ± 8.1 | 51.6 ± 0.2 | 1539 ± 2.0 | 302 ± 2.8 | 51.4 ± 0.1 |
| Tricine-buffered (2) | 1590 ± 1.3 | 312 ± 5.4 | 51.2 ± 0.1 | 1547 ± 2.7 | 304 ± 3.2 | 51.4 ± 0.1 |
| Zinc (4) | 1592 ± 1.3 | 219 ± 3.4 | 47.7 ± 0.1 | 1591 ± 3.1 | 313 ± 5.5 | 51.4 ± 0.2 |
| Zinc, Glu/Gly (1) | 1610 ± 1.4 | 211 ± 1.6 | 47.4 ± 0.1 | |||
Electrophysiology
CHO cells were transfected using Lipofectamine 2000 with wild-type or mutant GluN1, GluN2A, and enhanced GFP at a μg ratio of 1.25:3.75:1, respectively, with 6 μg of total DNA/10 ml of medium. After a 10–12-h incubation with transfection reagents, cells were plated at low density onto Petri dishes coated with poly-d-lysine. 400 μm dl-APV was present in the medium during and after transfection. Whole cell patch clamp recordings were performed 24–48 h after transfection using borosilicate glass pipettes with 3–5-megohm resistance, coated with dental wax, fire-polished, and filled with the following solution: 135 mm CsF, 33 mm CsOH, 2 mm MgCl2, 1 mm CaCl2, 11 mm EGTA, and 10 mm HEPES, pH 7.4. The external solution was: 140 mm NaCl, 2.8 mm KCl, 1 mm CaCl2, 10 mm HEPES, and 10 Tricine, pH 7.4. Free Zn2+ solutions up to 1 μm were made as described by Paoletti et al. (9), with 10 μm zinc added to an external solution lacking Tricine. Control, agonist, and agonist plus Zn2+ solutions were locally applied to isolated cells using a solenoid valve system (VC-6; Warner Instruments) and modified theta or quad barrel tubing as described by Tang (27). Glycine (100 μm) was present continuously, and glutamate (100 μm) was applied for 12 s every 20 s. To isolate the voltage-independent component of Zn2+ block, glutamate applications were performed at 50 mV with series resistance compensated by 60–80%. All recordings were performed using an Axopatch 200B amplifier (Molecular Devices), acquired at 10 kHz using pCLAMP10 software (Molecular Devices) and filtered online at 3 kHz (8-pole Bessel; Frequency Devices). All experiments were performed at room temperature.
Data Analysis
For Zn2+ dose-response curves, Zn2+ inhibition was calculated as the steady-state current at the end of the glutamate-Zn2+ application (I) divided by the current at the end of the glutamate-only application (Imax). Data from each cell were fit with the following equation,
 |
where a, IC50, and n are the residual, the half-maximal inhibition concentration, and the Hill co-efficient, respectively.
RESULTS
Strategy for LRET Measurements in CHO Cells and X. laevis Oocytes
To probe the orientation and distances between ATDs we measured three intersubunit distances, between the two GluN2A subunits, between GluN2A and GluN1 subunits, and between the two GluN1 subunits. Receptors composed of GluN1 and GluN2A subunits were co-expressed in CHO cells and X. laevis oocytes. To subtract background fluorescence in these systems, we introduced a fluorophore binding sites followed by a thrombin cleavage sequence. Measuring the LRET signal before and after thrombin digestion allows for the quantitative subtraction of the background signal. All constructs used in the LRET measurements were functional with zinc inhibition intact as determined using whole cell current recordings in CHO cells (Fig. 3).
FIGURE 3.

Zinc sensitivity of constructs used for LRET. A, representative whole cell recording from CHO cell expressing GluN1*/GluN2A*H30+C231 receptors in response to 100 μm glutamate alone or with 3, 30, or 300 nm free zinc. B, summary zinc inhibition curves for each construct recorded at 50 mV with 4–8 cells for each point. Note that each construct shows high affinity zinc block with an IC50 between 17 and 45 nm zinc, except for the zinc-insensitive GluN2A*H30+C231/DHM mutant (red circles). Error bars, S.E.
Tetramer Organization of GluN1-GluN2A ATDs
We measured the intersubunit distance between GluN2A ATDs by co-expressing GluN2A*C30 (Fig. 2), with GluN1*, and labeling with a donor: acceptor ratio of 1:1 (maleimide derivatives of terbium chelate and Alexa Fluor 555, respectively). Based on the LRET acceptor and donor only lifetimes (see Figs. 5 and 6), the distances were calculated to be 44.2 ± 0.1 Å and 44.9 ± 0.1 Å in CHO cells and oocytes, respectively (Table 1). The distances measured in standard solutions which may contain trace amounts of zinc and in Tricine-buffered solutions which contain no free zinc are identical, suggesting that any contaminating zinc is not significant enough to influence the LRET measurements. These distances are substantially closer to the distance of 33 Å in the structure of the tetrameric isolated ATDs of the NMDA receptor than the distance of 92 Å for analogous sites in the full-length AMPA receptor (Fig. 1).
FIGURE 5.

Lifetime measurements of intersubunit distances in NMDA receptors expressed in X. laevis oocytes. A, GluN2A-GluN2A LRET lifetimes from co-expressed GluN1* and GluN2A*C30 labeled with terbium chelate and Alexa Fluor 555. B, GluN1-GluN2A LRET lifetimes measured from GluN1*C22 and GluN2A*H30 when labeled with terbium chelate and Ni(NTA)2Cy3. C, GluN1-GluN1 LRET lifetimes obtained from GluN1*C22 co-expressed with GluN2A*H30 and labeled with terbium chelate and Alexa Fluor 555. D, lifetimes for donor-labeled GluN2A*C30 used to calculate GluN2-GluN2 distances. E, donor-only lifetimes for GluN1*C22-labeled receptors to calculate GluN1-GluN2A and GluN1-GluN1 distances. In all panels, the black line represents lifetimes from receptors in extracellular buffer, green shows Tricine-buffered solutions, blue illustrates solutions with saturating zinc, and pink represents solutions with both saturating zinc and glutamate/glycine. All measurements can be fit with a single exponential lifetime decay curve.
FIGURE 6.

Plot of energy transfer efficiency as a function of distance for terbium and Alexa Fluor 555. The red lines indicate the efficiency of energy transfer for the distance between GluN1 subunits in the GluN1-GluN2B ATD tetramer crystal structure (PDB ID code 3QEL (6)).
To measure between the GluN1-GluN2A ATDs, GluN1*C30 was co-expressed with GluN2A*H30 (Fig. 2). The LRET lifetimes for the distance between terbium chelate-labeled GluN1 and Ni(NTA)2Cy3-labeled GluN2A subunits in CHO cells and oocyte membrane fractions are shown in Figs. 4 and 5. The lifetimes can be well represented by a single exponential decay, suggesting that we are measuring only a single distance. The distance is 50.6 ± 0.1 Å and 50.4 ± 0.1 Å in CHO cells and oocytes, respectively (Table 1). This distance is in good agreement with the shortest GluN1-GluN2A distance of 53 Å in the tetrameric crystal structure of the isolated ATDs of the NMDA receptor (see “Discussion”) and the 59 Å between ATD dimers in the full-length GluA2 AMPA receptor structure (Fig. 1).
FIGURE 4.

Lifetime measurements of NMDA receptor intersubunit distances in CHO cells. A, GluN2A-GluN2A LRET lifetimes obtained by co-expressing GluN1* and GluN2A*C30 and labeling with terbium and Alexa Fluor 555 as donor and acceptor fluorophores, respectively. B, GluN1-GluN2A LRET lifetimes labeled with terbium and Ni(NTA)2Cy3 as donor and acceptor fluorophores, respectively. C, GluN1-GluN1 LRET measurements labeled with terbium and Alexa Fluor 555 as donor and acceptor fluorophores, respectively. D, donor-only lifetimes for the GluN2A-GluN2A measurements. E, donor-only lifetimes for measurements between GluN1-GluN2A and GluN1-GluN1. In all panels, the black line represents lifetimes from receptors in extracellular buffer, green shows Tricine-buffered solutions, blue illustrates solutions with saturating zinc, and pink represents solutions with both saturating zinc and glutamate/glycine. All measurements can be fit with a single exponential lifetime decay curve.
Similar LRET measurements of GluN1-GluN1 intersubunit distances in NMDA receptors in CHO cells were made by expressing GluN1*C22 with GluN2A*H30 (Fig. 2). No LRET was detectable when the construct was labeled with maleimide derivatives of terbium chelate and Alexa Fluor 555 in both CHO cells and X. laevis oocytes (Figs. 4 and 5). The lack of LRET suggests that the intersubunit distance between Cys-22 on GluN1 subunits is >95 Å (corresponding to energy transfer efficiencies of <0.1, Fig. 6), consistent with the 97 Å distance in the tetrameric crystal structure of isolated ATDs of the NMDA receptor (Fig. 1). This measurement does not rule out the configuration in the crystal structure of the full-length AMPA receptor, which shows a distance of 127 Å for analogous sites. However, all three distances taken together suggest that the ATDs in the NMDA receptor are indeed more compactly arranged and our measurements are consistent with the crystal structure of the isolated ATDs (6). The NMDA receptor ATDs do not seem to be as splayed apart as the ATDs in the full-length AMPA receptor structure.
Conformational Changes Induced by Zinc Binding
Measurements similar to those used to probe the tetramer organization were used to characterize intersubunit distances upon zinc binding and subsequent binding of the agonists glutamate and glycine. The LRET lifetimes that probe the intersubunit distances show no change in the presence of zinc either alone or with saturating glutamate and glycine in both CHO cells (Fig. 4) and in oocytes (Fig. 5). As such, the distances between subunits in these ligated states are indistinguishable from the apo state (Table 1). Importantly, these constructs all retain high affinity voltage-independent zinc inhibition with IC50values of 17 ± 2 and 45 ± 2 nm for GluN1*C22/GluN2A*H30 and GluN1*/GluN2A*C30, respectively (Fig. 3), in good agreement with previously reported values for wild-type NMDA receptors composed of GluN1/GluN2A subunits (15, 28, 29).
To study the conformational changes within the ATD of GluN2A subunits upon binding zinc, LRET lifetimes were obtained using the GluN2A*H30+C231 construct, which retains Cys-231, located in the lower lobe of the ATD (Fig. 2). The receptor composed of GluN1*/GluN2A*H30+C231 retains high affinity zinc inhibition with an IC50 of 35 ± 2 nm (Fig. 3), which is consistent with previously reported wild-type affinities (15, 28, 29). GluN2A*H30+C231 was co-expressed with GluN1* in CHO cells, and receptors were labeled with a maleimide derivative of terbium chelate, which binds to Cys-231 and a Ni-NTA conjugate of Cy3, which binds the His6 tag. This labeling strategy eliminated energy transfer between the amino termini of GluN2A subunits within the tetramer, allowing us to measure the GluN2A ATD cleft directly. The sensitized acceptor- and donor-only lifetime measurements (Fig. 7) yield a distance of 51.6 ± 0.2 Å and 51.2 ± 0.1Å in CHO cells using standard solutions or Tricine-buffered solutions, respectively (Table 2). Zinc binding induced a 3.5–4 Å decrease in distance between the donor and acceptor sites relative to the unligated states, with the distance being 47.7 ± 0.1 Å (Fig. 7 and Table 2). This result suggests that a cleft closure conformational change takes place in the ATD upon zinc binding. Subsequent binding of the agonists glutamate and glycine does not alter the intrasubunit distance of the GluN2A ATD cleft (Fig. 7).
FIGURE 7.

LRET lifetime measurements of the GluN2A ATD cleft. A, LRET lifetimes measured across the intrasubunit ATD cleft of GluN2A, obtained by co-expressing GluN1* and GluN2A*H30+C231 and labeling with terbium chelate and Ni(NTA)2Cy3. B, same lifetime measurement as in A performed on a zinc-insensitive GluN2A with mutations H44A and H128S. This measurement was obtained by co-expressing GluN1* and GluN2A*H30+C231/DHM and labeling with terbium chelate and Ni(NTA)2Cy3. C and D, donor-only lifetimes for the cleft measurements from constructs in A and B, respectively. In all panels, the black line represents lifetimes from receptors in extracellular buffer, green shows Tricine-buffered solutions, blue illustrates solutions with saturating zinc, and pink represents solutions with both saturating zinc and glutamate/glycine.
To confirm that the cleft closure was caused by zinc binding to the ATD, we combined two mutations in the ATD (H44A and H128S), which individually reduce zinc inhibition (14, 15) onto the background of our GluN2A*H30+C231 construct used for cleft closure measurements, called GluN2A*H30+C231/DHM. Electrophysiology experiments confirm that this construct shows no substantial voltage-independent inhibition by zinc at concentrations as high as 10 μm (Fig. 3). These experiments reveal that the cleft closure is zinc-dependent because acceptor- and donor-only lifetimes of receptors in the apo state, receptors in Tricine-buffered solutions, and receptors in zinc-added solutions all yielded distances that were identical, 51.4 ± 0.1 Å (Fig. 7 and Table 2). The distance matches the cleft distance in the apo receptor with wild-type zinc binding (Table 2). These experiments demonstrate that zinc induces a cleft closure conformational change in the bilobed ATD structure of GluN2A.
DISCUSSION
Our results corroborate that the tetramer organization of the NMDA receptor at the ATD is quite distinct from that of the AMPA receptor. In the full-length crystal structure, the AMPA receptor subunits are organized as a dimer of dimers with the dimer pairs relatively far apart from each other. This separation is evident in the distances measured between the α-carbons of the amino-terminal residues of the ATD (Fig. 1). In contrast, the NMDA receptor dimer pairs are much more compact. Furthermore, the closest contact between dimer pairs in the AMPA receptor occurs at the carboxyl terminus of the ATD, between the subunits labeled as B and D (Fig. 1). The GluN2A subunits occupy these B and D positions at the ATD, but unlike the AMPA receptor, it is their amino termini that are angled toward each other (6). This angling results in a much shorter intersubunit gap than seen between the B and D subunits of the AMPA receptor (Fig. 1 for the distance). Interestingly, the GluN2B-GluN2B distance in the crystal structure is ∼33 Å, whereas the experimentally measured GluN2A-GluN2A distance is consistently around 44 Å in both CHO cells and X. laevis oocytes. It is possible that the difference arises from a difference in orientation of the fluorophores. However, it is also possible that the larger distance arises from the GluN2A subunits being angled slightly further away from each other than in the GluN1/GluN2B isolated ATD crystal structure. In support of this latter idea, there are two sets of distances between GluN1 and GluN2B: within a dimer (61 Å) and between dimers (53 Å) (Fig. 1). However our data are very well fit by a single exponential yielding a distance of 51 Å, suggesting that the interdimer and intradimer distances are very close together, near 51 Å. This situation would arise if the upper lobes of GluN2A ATDs were positioned further away from each other than seen in the GluN1/GluN2B structure (6).
Using atomic force microscopy, Suzuki et al. found that the height of the NMDA receptor decreases ∼1 nm when both agonists glutamate and glycine are bound to the receptor (30). The LRET data, on the other hand, show no change in intersubunit distances in the presence of glutamate and glycine, suggesting that the upper lobes of the ATDs do not move apart during gating or desensitization. To integrate these two observations, we speculate that LBD closure around the ligand results in rearrangement of the LBD dimer interface (31) and a general downward pulling on the ATDs, without altering the orientation of the ATD subunits at the top. Essentially, the “shortening” of the receptor upon agonist binding stems predominantly or exclusively from closure motions of the LBD. Further experiments will be required to examine the motions of the ATD-LBD linker during agonist and modulator binding.
NMDA receptors differ from the AMPA and kainate receptor subtypes in their ability to bind small molecule allosteric inhibitors at their ATD. Cross-linking and cleft-locking experiments provide indirect evidence for a cleft closure conformational change induced by these small molecules (3, 32). However, the crystal structures of the isolated GluN2B ATD in the apo- and zinc-bound forms (PDB ID codes 3JPW and 3JPY) are both in the closed-cleft conformation, with only a 0.3 Å difference between the α-carbons of residues labeled in our experiments (8). The LRET data presented here show that on average the GluN2A ATD cleft is more closed in the zinc-bound state relative to the cleft in the absence of zinc. This is further confirmed by the absence of this change in the zinc-insensitive mutant (Fig. 7).
In both the absence and presence of zinc, crystal structures capture a closed-cleft state of the ATD, suggesting that this domain samples a range of conformations from an open to a closed-cleft state (8). A similar situation occurs with the LBD of AMPA receptors where single molecule FRET (smFRET) studies show that the LBD samples a spectrum of open- and closed-cleft conformations in both apo- and agonist-bound states (33, 34), with the agonist-bound forms on average being more closed. Similar NMR and smFRET studies such as those performed on the AMPA receptor LBD may be able to provide insight into the role of such dynamics in zinc modulation of the receptor function (33–36).
GluN1/GluN2 interactions may also play a role in zinc modulation. Recent work by Zhu et al. argues that the GluN1 ATD undergoes both twisting and cleft closure conformational changes as well as interacting with the GluN2B ATD to influence glutamate binding at the LBD (37). However, any such interactions would arise without causing large scale motions between the upper lobes in intact functional receptors (Figs. 4 and 5). These findings and recent computational studies suggest that the NTDs of both GluN1 (37) and GluN2B undergo lateral twisting motions (16, 38) as well as cleft closure movements (16, 37). Our data demonstrate that zinc induces a cleft closure motion in GluN2A, but further work will be needed to explore and measure any three-dimensional twisting motions of these domains and the role of any GluN1/2A interactions in allosteric modulation.
Footnotes
- LBD
- ligand-binding domain
- ATD
- amino-terminal domain
- CHO
- Chinese hamster ovary
- LRET
- luminescence resonance energy transfer
- PDB
- Protein Data Bank
- dl-APV
- dl-2-amino-5-phosphonopentanoic acid
- Tricine
- N-[Tris-(hydroxymethyl) methyl] glycine.
REFERENCES
- 1. Traynelis S. F., Wollmuth L. P., McBain C. J., Menniti F. S., Vance K. M., Ogden K. K., Hansen K. B., Yuan H., Myers S. J., Dingledine R. (2010) Glutamate receptor ion channels: structure, regulation, and function. Pharmacol. Rev. 62, 405–496 [DOI] [PMC free article] [PubMed] [Google Scholar]
- 2. Meddows E., Le Bourdelles B., Grimwood S., Wafford K., Sandhu S., Whiting P., McIlhinney R. A. (2001) Identification of molecular determinants that are important in the assembly of N-methyl-d-aspartate receptors. J. Biol. Chem. 276, 18795–18803 [DOI] [PubMed] [Google Scholar]
- 3. Gielen M., Siegler Retchless B., Mony L., Johnson J. W., Paoletti P. (2009) Mechanism of differential control of NMDA receptor activity by NR2 subunits. Nature 459, 703–707 [DOI] [PMC free article] [PubMed] [Google Scholar]
- 4. Paoletti P., Perin-Dureau F., Fayyazuddin A., Le Goff A., Callebaut I., Neyton J. (2000) Molecular organization of a zinc binding N-terminal modulatory domain in an NMDA receptor subunit. Neuron 28, 911–925 [DOI] [PubMed] [Google Scholar]
- 5. Masuko T., Kashiwagi K., Kuno T., Nguyen N. D., Pahk A. J., Fukuchi J., Igarashi K., Williams K. (1999) A regulatory domain (R1–R2) in the amino terminus of the N-methyl-d-aspartate receptor: effects of spermine, protons, and ifenprodil, and structural similarity to bacterial leucine/isoleucine/valine binding protein. Mol. Pharmacol. 55, 957–969 [DOI] [PubMed] [Google Scholar]
- 6. Karakas E., Simorowski N., Furukawa H. (2011) Subunit arrangement and phenylethanolamine binding in GluN1/GluN2B NMDA receptors. Nature 475, 249–253 [DOI] [PMC free article] [PubMed] [Google Scholar]
- 7. Sobolevsky A. I., Rosconi M. P., Gouaux E. (2009) X-ray structure, symmetry and mechanism of an AMPA-subtype glutamate receptor. Nature 462, 745–756 [DOI] [PMC free article] [PubMed] [Google Scholar]
- 8. Karakas E., Simorowski N., Furukawa H. (2009) Structure of the zinc-bound amino-terminal domain of the NMDA receptor NR2B subunit. EMBO J. 28, 3910–3920 [DOI] [PMC free article] [PubMed] [Google Scholar]
- 9. Paoletti P., Ascher P., Neyton J. (1997) High affinity zinc inhibition of NMDA NR1–NR2A receptors. J. Neurosci. 17, 5711–5725 [DOI] [PMC free article] [PubMed] [Google Scholar]
- 10. Rachline J., Perin-Dureau F., Le Goff A., Neyton J., Paoletti P. (2005) The micromolar zinc-binding domain on the NMDA receptor subunit NR2B. J. Neurosci. 25, 308–317 [DOI] [PMC free article] [PubMed] [Google Scholar]
- 11. Amico-Ruvio S. A., Murthy S. E., Smith T. P., Popescu G. K. (2011) Zinc effects on NMDA receptor gating kinetics. Biophys. J. 100, 1910–1918 [DOI] [PMC free article] [PubMed] [Google Scholar]
- 12. Assaf S. Y., Chung S. H. (1984) Release of endogenous Zn2+ from brain tissue during activity. Nature 308, 734–736 [DOI] [PubMed] [Google Scholar]
- 13. Howell G. A., Welch M. G., Frederickson C. J. (1984) Stimulation-induced uptake and release of zinc in hippocampal slices. Nature 308, 736–738 [DOI] [PubMed] [Google Scholar]
- 14. Choi Y. B., Lipton S. A. (1999) Identification and mechanism of action of two histidine residues underlying high-affinity Zn2+ inhibition of the NMDA receptor. Neuron 23, 171–180 [DOI] [PubMed] [Google Scholar]
- 15. Fayyazuddin A., Villarroel A., Le Goff A., Lerma J., Neyton J. (2000) Four residues of the extracellular N-terminal domain of the NR2A subunit control high-affinity Zn2+ binding to NMDA receptors. Neuron 25, 683–694 [DOI] [PubMed] [Google Scholar]
- 16. Dutta A., Shrivastava I. H., Sukumaran M., Greger I. H., Bahar I. (2012) Comparative dynamics of NMDA- and AMPA-glutamate receptor N-terminal domains. Structure 20, 1838–1849 [DOI] [PMC free article] [PubMed] [Google Scholar]
- 17. Furukawa H. (2012) Structure and function of glutamate receptor amino-terminal domains. J. Physiol. 590, 63–72 [DOI] [PMC free article] [PubMed] [Google Scholar]
- 18. Rambhadran A., Gonzalez J., Jayaraman V. (2010) Subunit arrangement in N-methyl-d-aspartate (NMDA) receptors. J. Biol. Chem. 285, 15296–15301 [DOI] [PMC free article] [PubMed] [Google Scholar]
- 19. Furukawa H., Singh S. K., Mancusso R., Gouaux E. (2005) Subunit arrangement and function in NMDA receptors. Nature 438, 185–192 [DOI] [PubMed] [Google Scholar]
- 20. Brimecombe J. C., Potthoff W. K., Aizenman E. (1999) A critical role of the N-methyl-d-aspartate (NMDA) receptor subunit (NR) 2A in the expression of redox sensitivity of NR1/NR2A recombinant NMDA receptors. J. Pharmacol. Exp. Ther. 291, 785–792 [PubMed] [Google Scholar]
- 21. Chazot P. L., Cik M., Stepenson F. A. (1999) in NMDA Receptor Protocols (Li M., ed) (pp. 33–42), Humana Press, Totowa, NJ [Google Scholar]
- 22. Kapanidis A. N., Ebright Y. W., Ebright R. H. (2001) Site-specific incorporation of fluorescent probes into protein: hexahistidine tag-mediated fluorescent labeling with (Ni2+-nitrilotriacetic acid)n-fluorochrome conjugates. J. Am. Chem. Soc. 123, 12123–12125 [DOI] [PubMed] [Google Scholar]
- 23. Gonzalez J., Rambhadran A., Du M., Jayaraman V. (2008) LRET investigations of conformational changes in the ligand binding domain of a functional AMPA receptor. Biochemistry 47, 10027–10032 [DOI] [PMC free article] [PubMed] [Google Scholar]
- 24. Selvin P. R., Hearst J. E. (1994) Luminescence energy transfer using a terbium chelate: improvements on fluorescence energy transfer. Proc. Natl. Acad. Sci. U.S.A. 91, 10024–10028 [DOI] [PMC free article] [PubMed] [Google Scholar]
- 25. Rambhadran A., Gonzalez J., Jayaraman V. (2011) Conformational changes at the agonist binding domain of the N-methyl-d-aspartic acid receptor. J. Biol. Chem. 286, 16953–16957 [DOI] [PMC free article] [PubMed] [Google Scholar]
- 26. Gonzalez J., Du M., Parameshwaran K., Suppiramaniam V., Jayaraman V. (2010) Role of dimer interface in activation and desensitization in AMPA receptors. Proc. Natl. Acad. Sci. U.S.A. 107, 9891–9896 [DOI] [PMC free article] [PubMed] [Google Scholar]
- 27. Tang C. M. (2001) Rapid solution application methods. Curr. Protocols Neurosci. 5, 6.9.1–6.9.17 [DOI] [PubMed] [Google Scholar]
- 28. Erreger K., Traynelis S. F. (2005) Allosteric interaction between zinc and glutamate binding domains on NR2A causes desensitization of NMDA receptors. J. Physiol. 569, 381–393 [DOI] [PMC free article] [PubMed] [Google Scholar]
- 29. Zheng F., Erreger K., Low C. M., Banke T., Lee C. J., Conn P. J., Traynelis S. F. (2001) Allosteric interaction between the amino-terminal domain and the ligand binding domain of NR2A. Nat. Neurosci. 4, 894–901 [DOI] [PubMed] [Google Scholar]
- 30. Suzuki Y., Goetze T. A., Stroebel D., Balasuriya D., Yoshimura S. H., Henderson R. M., Paoletti P., Takeyasu K., Edwardson J. M. (2013) Visualization of structural changes accompanying activation of N-methyl-d-aspartate (NMDA) receptors using Fast-scan atomic force microscopy imaging. J. Biol. Chem. 288, 778–784 [DOI] [PMC free article] [PubMed] [Google Scholar]
- 31. Borschel W. F., Murthy S. E., Kasperek E. M., Popescu G. K. (2011) NMDA receptor activation requires remodelling of intersubunit contacts within ligand-binding heterodimers. Nat. Commun. 2, 498. [DOI] [PMC free article] [PubMed] [Google Scholar]
- 32. Gielen M., Le Goff A., Stroebel D., Johnson J. W., Neyton J., Paoletti P. (2008) Structural rearrangements of NR1/NR2A NMDA receptors during allosteric inhibition. Neuron 57, 80–93 [DOI] [PMC free article] [PubMed] [Google Scholar]
- 33. Landes C. F., Rambhadran A., Taylor J. N., Salatan F., Jayaraman V. (2011) Structural landscape of isolated agonist-binding domains from single AMPA receptors. Nat. Chem. Biol. 7, 168–173 [DOI] [PMC free article] [PubMed] [Google Scholar]
- 34. Ramaswamy S., Cooper D., Poddar N., MacLean D. M., Rambhadran A., Taylor J. N., Uhm H., Landes C. F., Jayaraman V. (2012) Role of conformational dynamics in α-amino-3-hydroxy-5-methylisoxazole-4-propionic acid (AMPA) receptor partial agonism. J. Biol. Chem. 287, 43557–43564 [DOI] [PMC free article] [PubMed] [Google Scholar]
- 35. Maltsev A. S., Ahmed A. H., Fenwick M. K., Jane D. E., Oswald R. E. (2008) Mechanism of partial agonism at the GluR2 AMPA receptor: measurements of lobe orientation in solution. Biochemistry 47, 10600–10610 [DOI] [PMC free article] [PubMed] [Google Scholar]
- 36. Maltsev A. S., Oswald R. E. (2010) Hydrophobic side chain dynamics of a glutamate receptor ligand binding domain. J. Biol. Chem. 285, 10154–10162 [DOI] [PMC free article] [PubMed] [Google Scholar]
- 37. Zhu S., Stroebel D., Yao C. A., Taly A., Paoletti P. (2013) Allosteric signaling and dynamics of the clamshell-like NMDA receptor GluN1 N-terminal domain. Nat. Struct. Mol. Biol. 20, 477–485 [DOI] [PubMed] [Google Scholar]
- 38. Burger P. B., Yuan H., Karakas E., Geballe M., Furukawa H., Liotta D. C., Snyder J. P., Traynelis S. F. (2012) Mapping the binding of GluN2B-selective N-methyl-d-aspartate receptor negative allosteric modulators. Mol. Pharmacol. 82, 344–359 [DOI] [PMC free article] [PubMed] [Google Scholar]