Background: miR-200s have been shown to control growth by regulating PI3K, but the role of miR-200s in the development of hepatic insulin resistance remains unclear.
Results: IL-6 inhibited the phosphorylation of AKT and GSK through down-regulation of miR-200s.
Conclusion: IL-6 may impair activation of the PI3K/AKT/GSK pathway via down-regulating miR-200s while augmenting FOG2 expression.
Significance: These findings provide mechanistic insight into regulation of the PI3K/AKT pathway by miR-200s.
Keywords: AKT, Glycogen, Glycogen Synthase Kinase 3, Interleukin, MicroRNA
Abstract
By influencing the activity of the PI3K/AKT pathway, IL-6 acts as an important regulator of hepatic insulin resistance. miR-200s have been shown to control growth by regulating PI3K, but the role of miR-200s in the development of hepatic insulin resistance remains unclear. The present study showed that elevated serum concentration of IL-6 is associated with decreased levels of miR-200s, impaired activation of the AKT/glycogen synthase kinase (GSK) pathway, and reduced glycogenesis that occurred in the livers of db/db mice. As shown in the murine NCTC 1469 hepatocytes and the primary hepatocytes treated with 10 ng/ml IL-6 for 24 h and in 12-week-old male C57BL/6J mice injected with 16 μg/ml IL-6 by pumps for 7 days, IL-6 administration induced insulin resistance through down-regulation of miR-200s. Moreover, IL-6 treatment inhibited the phosphorylation of AKT and GSK and decreased the glycogenesis. The effects of IL-6 could be diminished by suppression of FOG2 expression. We concluded that IL-6 treatment may impair the activities of the PI3K/AKT/GSK pathway and inhibit the synthesis of glycogen, perhaps via down-regulating miR-200s while augmenting FOG2 expression.
Introduction
Insulin resistance, defined as a diminished ability of cells, such as adipocytes, skeletal muscle cells, and hepatocytes, to respond to the action of insulin, plays a central role in the development of several metabolic abnormalities and diseases, such as obesity, type 2 diabetes, and the metabolic syndrome (1, 2). Decreased glycogen levels are the hallmark of insulin resistance in the hepatocytes. Underlying mechanisms of insulin resistance in the hepatocytes include decreased glycogen synthesis and failure to suppress glucose production (3).
IL-6 has been recognized as an important mediator of insulin resistance by impairing the insulin signaling pathway. It has been well demonstrated that IL-6 may lead to block the PI3K/AKT pathway (4). Moreover, both in vitro evidence and in vivo observations suggest that elevated levels of IL-6 selectively induce insulin resistance in the liver, whereas systemic depletion of IL-6 improves hepatic insulin action in an obese mouse model (5–7). However, molecular mechanisms linking IL-6 to hepatic insulin resistance remained poorly understood.
MicroRNAs (miRNAs)3 are small, noncoding 20–24-nucleotide RNAs that negatively regulate their target gene expression at the posttranscriptional level by binding to specific, partially complementary regions in the 3′-UTR of the target mRNAs (8). Recent studies have shown the involvement of miRNAs in the pathogenesis of type 2 diabetes. For instance, miR-375, miR-29, miR-9, and Let-7 could regulate insulin secretion (9, 10). miR-375 and miR-124a also participated in the pancreatic islet development (11, 12) and beta cell differentiation (13). In addition, Let-7, miR-33, miR-122, and miR-143 could indirectly control the metabolism of glucose and lipid (14–17). Moreover, miR-146a was involved in secondary complications associated with diabetes (19). Although it was reported that miR-126 was actively involved in the development of insulin resistance induced by mitochondrial dysfunction in the hepatocytes (20), the role of miRNAs in hepatic insulin resistance is not understood well. The miR-200 family, including miR-200a, miR-200b, miR-200c, miR-141, and miR-429, is highly conserved in the bilateral animals and up-regulated in the endometrial carcinoma (21). A previous study (22) showed that miR-200s and their target FOG2 could control growth by regulating PI3K. However, the role of miR-200s in the development of hepatic insulin resistance has not been reported.
The present study identified a group of miRNAs (e.g. miR-200a, miR-200b, and miR-200c (so-called miR-200s)) that contribute to IL-6-induced insulin resistance in the hepatocytes. For the first time, this study has discovered new experimental evidence that IL-6 impairs the activation of the PI3K/AKT pathway and the synthesis of glycogen via down-regulating miR-200s, accompanied by up-regulating the expression of FOG2.
EXPERIMENTAL PROCEDURES
Animals
We obtained db/db mice (C57BL/KsJ) from the Peking University Health Science Center (originally purchased form Jackson Laboratory). Briefly, db/db mice (n = 5) and age-matched wild-type (WT) mice (n = 5) were fed a standard laboratory diet for 12 weeks.
12-week-old male C57BL/6J mice were provided from the Peking University Health Science Center. The mice (n = 10) were separated into two groups and fed a standard laboratory diet. For all experiments examining chronic IL-6 exposure, Alzet osmotic pumps (Durect, Cupertino, CA) with a 7-day pumping capacity and infusion rate of 1 μl/h were used. Pumps were filled to capacity with 16 μg/ml hIL-6 diluted in carrier (0.9% NaCl and 0.1% BSA) (6). Following induction of the halothane general anesthesia, pumps were implanted into the intrascapular subcutaneous space. Incisions were closed with interrupted absorbable sutures.
All animal procedures were performed in accordance with the National Institutes of Health Animal Care and Use Guidelines. All animal protocols were approved by the Animal Ethics Committee at the Beijing Institute of Geriatrics.
Microarray Analysis for miRNAs
To profile the expression of miRNAs between two groups of mice, the miRNAs in the liver samples from five db/db mice and five control mice were analyzed by the miRCURYLNA Array (version 14.0) system. Total RNA was harvested using TRIzol (Invitrogen) and an RNeasy minikit (Qiagen) according to the manufacturers' instructions. The samples were labeled using the miRCURYTMHy3TM/Hy5TM Power labeling kit and hybridized on the miRCURYTM LNA Array (version 14.0). Scanning was performed with an Axon GenePix 400B microarray scanner. GenePix pro version 6.0 was used to read image raw intensity.
Measurement of Serum Glucose, Free Fatty Acids (FFA), and IL-6
The levels of serum FFA, glucose, and IL-6 were examined using a kit from Sigma.
Cell Culture
NCTC 1469 cells derived from mouse liver cells (American Type Culture Collection) were cultured in low glucose Dulbecco's modified Eagle's medium (Invitrogen) supplemented with 10% horse serum (Hyclone), 100 units/ml penicillin (Invitrogen), and 0.1 mg/ml streptomycin (Invitrogen) at 37 °C in a humidified atmosphere of 95% O2, 5% CO2.
Isolation of Mouse Primary Hepatocytes
Male C57BL/6J mice (12 weeks old) were provided from the Peking University Health Science Center. Primary hepatocytes were isolated by a two-step collagenase perfusion (0.2 mg/ml type IV collagenase (Sigma) in Hanks' balanced salt solution), as described previously (23). The hepatocytes were collected by centrifugation at 800 rpm for 8 min. Immediately after harvesting, the cells were suspended in prewarmed William's E medium (Sigma) supplemented with 10% fetal bovine serum, 20 ng/ml dexamethasone (Sigma), ITS (5 mg/liter insulin, 5 mg/liter transferrin, 5 μg/liter sodium selenate) (Sigma), and 10 μg/ml gentamicin (Invitrogen). The hepatocytes were plated in collagen-coated 25-cm2 flasks at 1 × 10⁶ cells/flask.
Transfection of miRNA Mimics and Inhibitors
The mimics and inhibitors of miR-200s were purchased from Genepharm. The miRNA mimic control and inhibitor control were used as negative controls. Hiperfect transfection reagent (Qiagen) was used for the transfection of miR-200 mimics and inhibitors. 48 h after transfection, the expression of miR-200s was detected by real-time PCR.
RNA Isolation and Real-time PCR
Enriched miRNA was isolated using an miRNA isolation kit (TaKaRa). A stem-loop reverse transcription-polymerase chain reaction (RT-PCR) was also executed on samples to detect and quantify mature miRNAs by using stem-loop antisense primer mix and avian myeloblastosis virus transcriptase (TaKaRa).
The cDNA preparations were routinely tested by real-time PCR based on the SYBR Green I method, according to the manufacturer's instructions (TaKaRa). The amplification and detection of specific products were performed according to the manufacturer's protocol with the ABI PRISM 7500 system (Applied Biosystems). The U6 small nucleolar RNA was used as the housekeeping small RNA reference gene. The relative gene expression was normalized to U6 small nucleolar RNA. Each reaction was performed in triplicate, and analysis was performed by the 2−ΔΔCT method. Nucleotide primers used for reverse transcription were as follows (5′-3′): miR-200a, GTCGTATCCAGTGCAGGGTCCGAGGTATTCGCACTGGATACGACACATCG; miR-200b, GTCGTATCCAGTGCAGGGTCCGAGGTATTCGCACTGGATACGACTCATCA; miR-200c, GTCGTATCCAGTGCAGGGTCCGAGGTATTCGCACTGGATACGACTCCATC; U6, GTCGTATCCAGTGCAGGGTCCGAGGTATTCGCACTGGATACGACAAAATATG. The nucleotide primers used for real-time PCR were as follows (5′-3′): miR-200a forward, GCTAACACTGTCTGGTAACGATGT; miR-200b forward, GCGTAATACTGCCTGGTAATGATG; miR-200c forward, GTAATACTGCCGGGTAATGATGGA; U6 forward, GCGCGTCGTGAAGCGTTC; universal reverse primer, GTGCAGGGTCCGAGGT.
Western Blot Analysis
Cell lysates (15–30 μg of protein) were separated by 10% SDS-PAGE, transferred to PVDF membrane (Millipore), blocked with 8% nonfat dry milk, and probed with the antibodies at 4 °C overnight. The blots were incubated with HRP-conjugated anti-IgG, followed by detection with ECL (Millipore). The antibodies against AKT, phosphorylation of AKT (Ser473), glycogen synthase kinase (GSK), and phosphorylation of GSK (Ser9) were purchased from Cell Signaling. The antibodies to FOG2 and β-actin were obtained from Santa Cruz Biotechnology, Inc. (Dallas, TX).
Measurement of Glycogen Content
The glycogen levels were measured in the cells or liver tissues incubated for 3 h in the presence of 1 nmol/liter insulin (Usbio), using a glycogen assay kit (Biovision).
Statistical Analysis
All values are represented as means ± S.E. of the indicated number of measurements. A one-way analysis of variance test was used to determine significance, with values of p < 0.05 indicating statistical significance.
RESULTS
Expression of miR-200s Is Inhibited in the Livers of db/db Mice
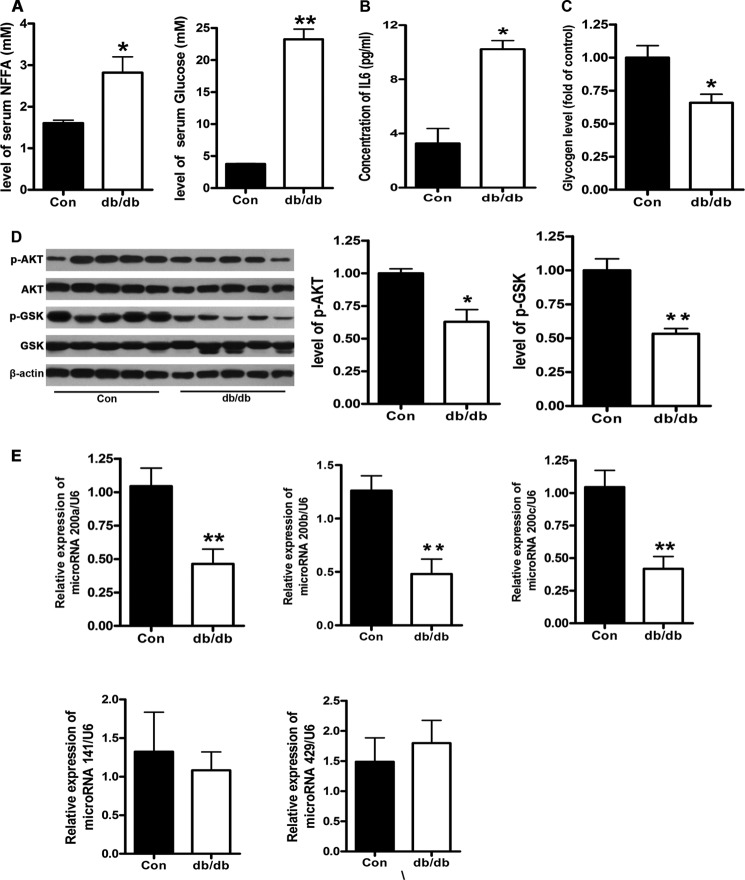
The levels of serum glucose and FFA were significantly increased in the db/db mice (Fig. 1A). The concentration of IL-6 in serum was also elevated in the db/db mice (Fig. 1B). Moreover, the glycogen levels in the livers of db/db mice were significantly decreased, demonstrating a state of insulin resistance (Fig. 1C). It is noteworthy that the phosphorylation of AKT and GSK was reduced in the livers of db/db mice, indicating impaired activation of AKT/GSK pathway (Fig. 1D). To examine the expression of the miR-200 family, including miR-200a, miR-200b, miR-200c, miR-141, and miR-429, in the livers of db/db mice, the miRNAs of the livers of db/db mice (n = 5) and control mice (n = 5) were analyzed by miRNA microarray. The results of the miRNA microarray showed that the levels of miR-200a and miR-200b were decreased, whereas the expression of miR-200c was increased, and there was no difference in the expression of miR-141 and miR-429 (Table 1). The results of the miRNA microarray were verified by real-time PCR. As shown in Fig. 1E, the levels of miR-200a, miR-200b, and miR-200c were reduced. The result of miR-200c was not consistent with that from the microarray. The microarray was used for genome-wide profiling of miRNAs. However, the results of the miRNA microarray were affected by many factors. Therefore, the results of the microarray need to be further validated by real-time PCR. These in vivo observations suggest that decreased expression of miR-200s probably contributes to hepatic insulin resistance.
FIGURE 1.
miR-200s are down-regulated in the livers of db/db mice. The db/db mice were fed with a standard diet for 12 weeks. The levels of serum FFA and glucose (A), IL-6 (B), and glycogen (C) and the activation of the AKT/GSK pathway (D) were measured. The levels of miR-200 family were analyzed by real-time PCR (E). Data represent the means ± S.E. (error bars), n = 5. *, p < 0.05 versus control; **, p < 0.01 versus control.
TABLE 1.
The results of microRNA microarray analysis
| Name | Change (D/C) | Foreground |
Foreground − background |
Normalized |
|||
|---|---|---|---|---|---|---|---|
| C | D | C | D | C | D | ||
| -fold | |||||||
| miR-200a | 0.11 | 168.5 | 77 | 104 | 11 | 0.41 | 0.04 |
| miR-200b | 0.48 | 298 | 179.5 | 228.5 | 109.5 | 0.90 | 0.40 |
| miR-200c | 1.37 | 108.5 | 123 | 41 | 56.5 | 0.16 | 0.22 |
| miR-141 | NAa | 142 | 61.5 | 76.5 | −10 | 0.3 | NA |
| miR-429 | NA | 67.5 | 57 | −2.5 | −22 | NA | NA |
a NA, not available.
IL-6 Treatment Down-regulates the Expression of miR-200s
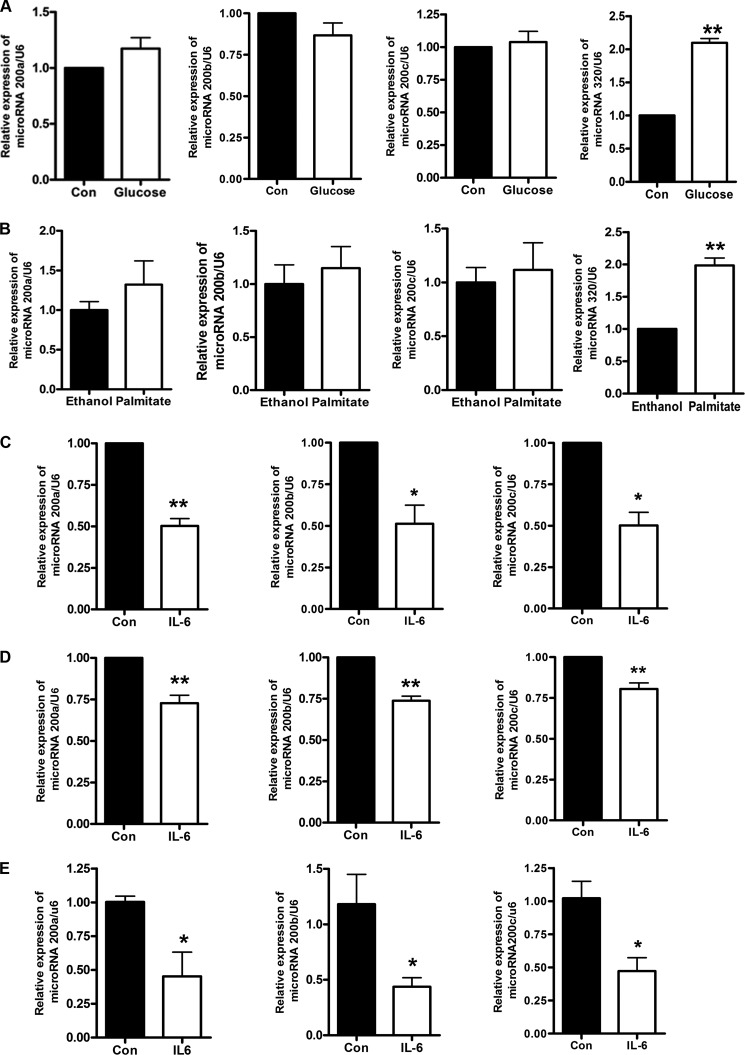
These observations in the db/db mice were extended to a cellular model of insulin resistance. Mouse NCTC 1469 hepatocytes were treated with 33.3 mmol/liter glucose for 48 h and 0.25 mmol/liter palmitate for 24 h, respectively, to induce insulin resistance, as described previously (24). In addition, NCTC 1469 cells were treated with different concentrations of IL-6 (10, 20, and 40 ng/ml) for different times (12, 24, and 48 h) to induce insulin resistance (data not shown). The treatment of 10 ng/ml IL-6 for 24 h was chosen for the following experiments. The expression of miR-200s was analyzed by real-time PCR. The results showed that IL-6, but not glucose and palmitate, can suppress the expression of miR-200s (Fig. 2, A–C). We also analyzed the effect of glucose and palmitate on the expression of other microRNAs, such as miR-320. Our results showed that the miR-320 level was increased in the NCTC 1469 cells treated with glucose and palmitate for 48 h. Therefore, miR-320 could be used as a positive control in experiments with glucose and palmitate (Fig. 2, A and B). Moreover, down-regulation of miR-200s by IL-6 was assessed in the exposure of mouse primary hepatocytes to 10 ng/ml IL-6 for 24 h (Fig. 2D).
FIGURE 2.
IL-6 reduces the expression of miR-200s. The levels of miR-200s were analyzed in the mouse NCTC 1469 hepatocytes treated with 33.3 mmol/liter glucose for 48 h (A), 0.25 mmol/liter palmitate for 24 h (B), or 10 ng/ml IL-6 for 24 h (C) and in the mouse primary hepatocytes treated with 10 ng/ml IL-6 for 24 h (D) as well as in the livers of mice injected by IL-6 (E). miR-320 was used as positive control in experiments with glucose and palmitate. Data represent the means ± S.E. (error bars), n = 5 independent experiments. *, p < 0.05 versus control; **, p < 0.01 versus control.
In order to confirm the effect of IL-6 on the expression of miR-200s in vivo, 12-week-old male C57BL/6J mice were injected with 16 μg/ml IL-6 by pumps for 7 days, and the livers of mice were collected. As shown in Fig. 2E, the expression of miR-200s was also significantly decreased in the livers of mice injected with IL-6. Our results suggest that IL-6 could down-regulate the expression of miR-200s in vitro and in vivo.
IL-6 Inactivates the AKT/GSK Pathway and Reduces Glycogenesis in Hepatocytes
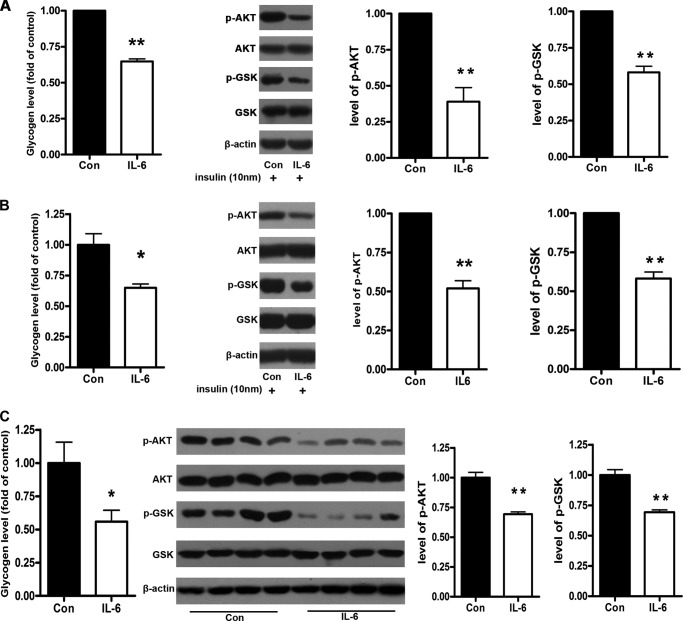
To determine the effect of IL-6 on glycogenesis, NCTC 1469 cells and mouse primary hepatocytes were treated with 10 ng/ml IL-6 for 24 h. The IL-6 treatment significantly decreased the glycogen levels in both NCTC 1469 cells and mouse primary hepatocytes (Fig. 3, A and B). Moreover, we analyzed the effect of IL-6 on the phosphorylation of AKT and GSK3 in insulin-treated and untreated NCTC1469 cells and primary hepatocytes. In parallel with decreased phosphorylation of AKT, the phosphorylation of GSK was reduced in both NCTC 1469 cells and primary hepatocytes exposed to IL-6 (Fig. 3, A and B).
FIGURE 3.
IL-6 suppresses the activation of AKT/GSK pathway and the glycogenesis in the hepatocytes. The glycogen content and the activation of the AKT/GSK pathway were measured in the NCTC 1469 cells treated with 10 ng/ml IL-6 for 24 h (A) and mouse primary hepatocytes exposed to 10 ng/ml IL-6 for 24 h (B) and in the livers of mice injected with IL-6 for 7 days (C). Data represent the means ± S.E. (error bars), n = 3 independent experiments in the NCTC 1469 cells and the mouse primary hepatocytes; n = 4 independent experiments in the mice injected with IL-6). *, p < 0.05 versus control; **, p < 0.01 versus control. p-AKT and p-GSK, phospho-AKT and -GSK, respectively.
Next, the synthesis of glycogen and the activation of AKT/GSK pathway in the livers of C57BL/6J mice injected with IL-6 were analyzed. As shown in Fig. 3C, the levels of glycogen were dramatically decreased, accompanied by impaired phosphorylation of AKT and GSK in the livers of mice injected with IL-6. These results suggest that IL-6 could suppress activation of the AKT/GSK pathway and glycogenesis in the hepatocytes of mice.
miR-200s Regulate Activation of the AKT/GSK Pathway and Glycogenesis in the Hepatocytes
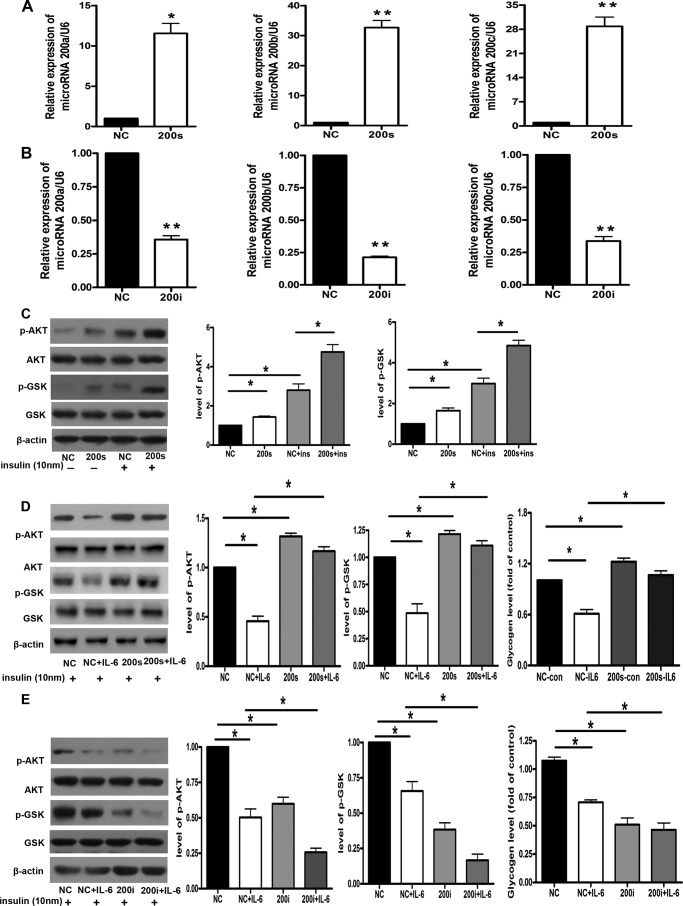
We tested the notion that miR-200s serve as a link between IL-6 and hepatic insulin resistance. Therefore, we next observed the effect of miR-200s on activation of the AKT/GSK pathway and glycogenesis in the hepatocytes. First, the mimics of miR-200a, miR-200b, and miR-200c were transfected into the NCTC 1469 cells for 48 h. The results of real-time PCR showed that the levels of miR-200s were increased to 15–30-fold in the NCTC 1469 cells transfected with the mimics of miR-200s compared with those transfected with the negative miRNA mimic control (Fig. 4A). Moreover, overexpression of miR-200s rescued IL-6-induced suppression of glycogenesis in the NCTC 1469 cells. Second, the inhibitors of miR-200a, miR-200b, and miR-200c were transfected into the NCTC 1469 cells for 48 h. The levels of miR-200s were decreased by 20–30% compared with those transfected with negative miRNA inhibitor control (Fig. 4B). Next, we examined the effects of miR-200s on the phosphorylation of AKT and GSK3 in both insulin-treated and -untreated NCTC1469 cells. The results showed that miR-200s could improve insulin sensitivity in both insulin-treated and -untreated NCTC1469 cells (Fig. 4C). Importantly, the transfection of miR-200 mimics could rescue IL-6-induced impaired phosphorylation of AKT and GSK and reduced glycogenesis (Fig. 4D). As shown in Fig. 4E, down-regulation of miR-200s induced impaired activation of AKT and GSK, accompanied by reduced glycogenesis in the NCTC 1469 cells. Taken together, these results suggest miR-200s as a link between IL-6 and hepatic insulin resistance. miR-200s modulate activation of the AKT/GSK pathway and glycogenesis in the hepatocytes.
FIGURE 4.
miR-200s modulate the activation of AKT/GSK pathway and the glycogenesis in the hepatocytes. The levels of miR-200s were detected in the NCTC 1469 cells (negative control (NC)) transfected with miR-200 mimics (A) and miR-200 inhibitors (B). The effects of miR-200s on the phosphorylation of AKT and GSK3 in both insulin-treated and -untreated NCTC1469 cells were analyzed (C). The activation of the AKT/GSK pathway and the content of glycogen were measured in the NCTC 1469 cells transfected with miR-200 mimics (D) and miR-200 inhibitors (E). Data represent the means ± S.E. (error bars), n = 3 independent experiments. *, p < 0.05 versus control; **, p < 0.01 versus control. p-AKT and p-GSK, phospho-AKT and -GSK, respectively.
miR-200s Regulate the Expression of FOG2 in NCTC 1469 Cells
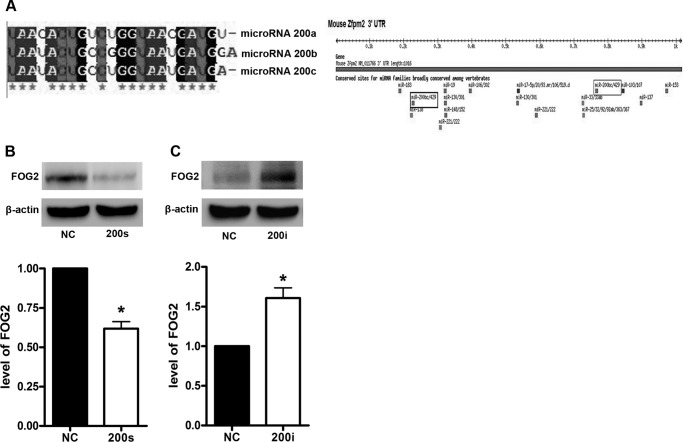
miR-200s was highly conserved in the mammals (Fig. 5A). It has been reported that there are several target sites for the miR-200 family in the 3′-UTR of FOG2, and the miR-200 family down-regulates the expression of FOG2 (22). To further assess whether FOG2 is regulated by miR-200s, NCTC 1469 cells were transfected with the mimics and inhibitors of miR-200s, respectively. The results showed that the expression of FOG2 was down-regulated in the NCTC 1469 cells transfected with the mimics of miR-200s (Fig. 5B). In contrast, the transfection of NCTC 1469 cells with the inhibitors of miR-200s up-regulated the expression of FOG2 (Fig. 5C).
FIGURE 5.
miR-200s regulate FOG2 expression in NCTC 1469 cells. The sequence of miR-200s and miR-200s binding sites of FOG2 were analyzed by picTar (A). The levels of FOG2 in the NCTC 1469 cells (negative control (NC)) transfected with miR-200 mimics (B) and miR-200 inhibitors (C) were tested by Western blot. Data represent the means ± S.E. (error bars), n = 3 independent experiments. *, p < 0.05 versus control.
FOG2 Participates in IL-6-induced Hepatic Insulin Resistance
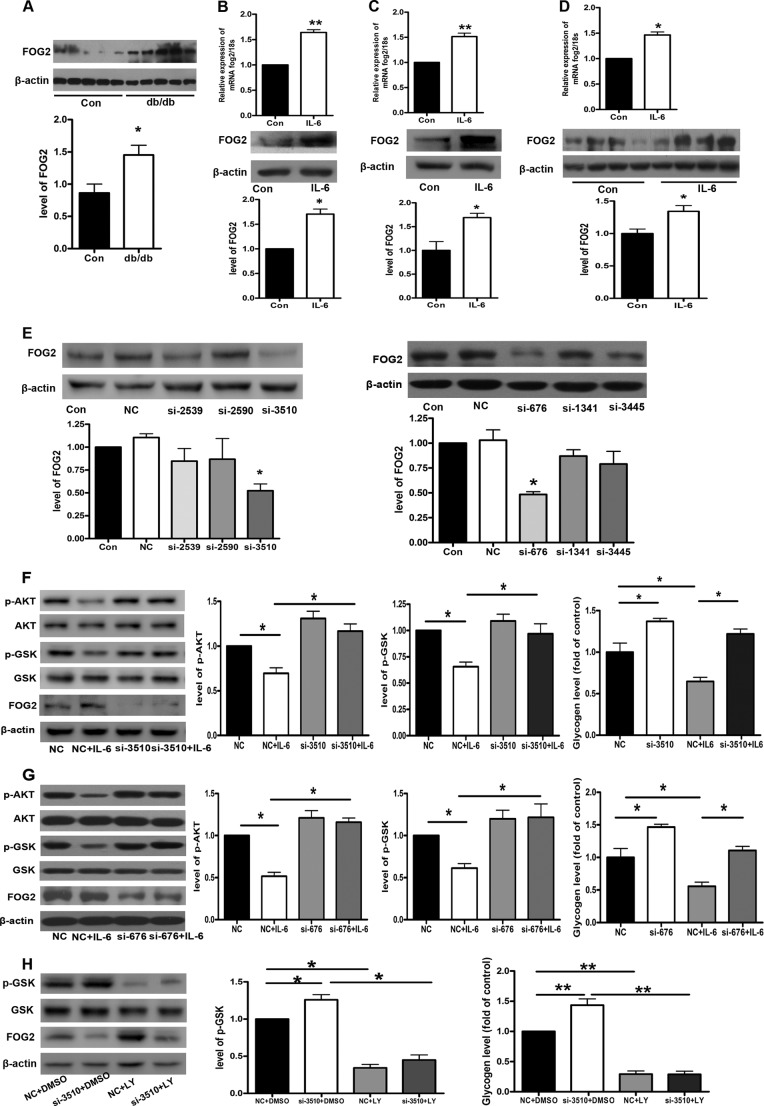
In the present study, we found that the expression of FOG2 was significantly increased in the db/db mice (Fig. 6A). As shown in Fig. 6, B and C, IL-6 increased the levels of FOG2 mRNA and protein in both NCTC 1469 cells and mouse primary hepatocytes. Moreover, the levels of FOG2 mRNA and protein were enhanced in the livers of mice injected with IL-6 (Fig. 6D). These observations indicate that FOG2 may be involved in IL-6-induced insulin resistance.
FIGURE 6.
FOG2 participates in IL-6-induced hepatic insulin resistance. The levels of FOG2 protein were measured in the livers of db/db mice (A). The levels of FOG2 mRNA and protein were also analyzed in the NCTC 1469 cells treated with 10 ng/ml IL-6 for 24 h (B), the mouse primary hepatocytes exposed to 10 ng/ml IL-6 for 24 h (C), and the livers of mice injected with IL-6 for 7 days (D). Six siRNAs (si-676, si-1341, 3445, si-2530, si-2590, and si-3510) targeting FOG2 mRNA were transfected into the NCTC 1469 cells. The NCTC 1469 cells (negative control (NC)) were transfected with six siRNAs (si-676, si-1341, 3445, si-2530, si-2590, and si-3510) targeting FOG2 mRNA for 48 h followed by 10 ng/ml IL-6 treatment for 24 h. The FOG2 expression was determined by Western blots (E). The activation of the AKT/GSK pathway and the glycogen content (F and G) were analyzed in the NCTC 1469 cells transfected with si-3510-FOG2 and si-676-FOG2 for 48 h followed by 10 ng/ml IL-6 treatment for 24 h. The level of GSK phosphorylation and the content of glycogen (H) were measured in the NCTC1469 cells transfected with si-3510-FOG2 for 48 h, followed by treatment with 30 μm LY294002 for 24 h. Data represent the means ± S.E., n = 5 independent experiments in the db/db mice; n = 3 independent experiments in both NCTC 1469 cells and mouse primary hepatocytes; n = 4 independent experiments in the mice injected with IL-6. *, p < 0.05 versus control. p-AKT and p-GSK, phospho-AKT and -GSK, respectively.
To further assess the role of FOG2 in IL-6-induced hepatic insulin resistance, six siRNAs (si-676, si-1341, 3445, si-2530, si-2590, and si-3510) targeting FOG2 mRNA were transfected into the NCTC 1469 cells. Western blot analysis indicated that both si-676-FOG2 and si-3510-FOG2 significantly down-regulated the expression of FOG2 (Fig. 6E). The effects of IL-6 on the phosphorylation of AKT and GSK were rescued by the transfection of si-3510-FOG2 and si-676-FOG2 into the NCTC 1469 cells (Fig. 6, F and G). Furthermore, FOG2 down-regulation reversed IL-6-induced impaired glycogenesis in the NCTC 1469 cells (Fig. 6, F and G). In order to determine whether the inhibitory effect of FOG2 should point toward PI3K pathway, we used PI3K inhibitor LY294002 to block the PI3K pathway in NCTC1469 cells transfected by siRNA-FOG2. The results showed that FOG2 could not affect the glycogenesis after treatment with 10 nm PI3K inhibitor LY294002 for 24 h (Fig. 6H). Taken together, these results suggest that suppression of FOG2 substantially blocked IL-6-induced impaired activation of the PI3K/AKT/GSK pathway and glycogenesis in the hepatocytes.
DISCUSSION
There is increasing evidence that miRNAs play a role in many aspects of insulin resistance and hence may be involved in the pathogenesis of type 2 diabetes. In the present study, we found that the expression of miR-200s was decreased in the livers of db/db mice, accompanied by an elevated level of IL-6. Because db/db mice are complex and accompanied by other factors, such as elevated levels of serum FFA and glucose, it is difficult to determine the contribution of IL-6 to down-regulation of miR-200s. Therefore, we extended these observations from db/db mice to a mouse hepatocyte cell line, NCTC 1469. The results show that the treatment of 10 ng/ml IL-6 for 24 h suppressed the expression of miR-200s, whereas there was no change in the expression of miR-200s in the NCTC 1469 cells treated with either 33.3 mmol/liter glucose or 0.25 mmol/liter palmitate. Similarly, down-regulation of miR-200s by IL-6 was assessed in the mouse primary hepatocytes exposed to 10 ng/ml IL-6 for 24 h and in the livers of C57BL/6J mice injected with IL-6. Moreover, we found that IL-6 suppressed the expression of miR-200s, accompanied by down-regulation of miR-152 in the NCTC 1469 hepatocytes and the primary hepatocytes treated with 10 ng/ml IL-6 for 24 h and in 12-week-old male C57BL/6J mice injected with 16 μg/ml IL-6 by pumps for 7 days. Importantly, the transfection by miR-152 inhibitor led to reduced expression of miR-200s in the NCTC 1469 hepatocytes, suggesting that miR-152 could regulate miR-200 expression (data not shown). Our study demonstrates for the first time that IL-6 suppresses the expression of miR-200s in hepatocytes.
Accordingly, it has been proposed that IL-6 contributes to the pathogenesis of insulin resistance in type 2 diabetes (4). Both in vitro evidence and in vivo observations suggest that elevated levels of IL-6 selectively induce insulin resistance in the liver, whereas systemic depletion of IL-6 improves hepatic insulin action in an obese mouse model (5–7). In the liver, insulin activates the PI3K/AKT signaling cascade, leading to the phosphorylation and inactivation of GSK. Hence, glycogen synthase, the target of GSK, is freed of inhibitory phosphorylation, and glycogen synthesis is induced upon insulin stimulation (25). In our study, we found that the levels of phosphorylation of AKT and GSK were reduced in both NCTC 1469 cells and primary hepatocytes exposed to 10 ng/ml IL-6 for 24 h. Similarly, the levels of glycogen were dramatically decreased, accompanied by impaired phosphorylation of AKT and GSK in the livers of mice injected with IL-6. These results suggest that IL-6 induces hepatic insulin resistance by suppression of the AKT/GSK pathway.
What is the link between IL-6 and hepatic insulin resistance? Accumulating evidence has suggested that miRNAs are involved in glucose and fat uptake in the livers of type 2 diabetes individuals (26). A previous study showed that miR-200s promote cell proliferation in human cell lines. The mice lacking the miR-200 family, including miR-200a, miR-200b, miR-200c, miR-141, and miR-429, display reduced body size, indicating that miR-200s control growth by regulating PI3K (22). Moreover, it is reported that miR-200s are expressed in various adult organs, including liver, pancreatic islet, testes, prostate, and ovary (27). Recently, Reddy et al. (28) reported the proinflammatory role of miR-200 in vascular smooth muscle cells from diabetic mice. However, the role of miR-200s in the development of hepatic insulin resistance has not been reported to date. In the present study, we found impaired activity of the PI3K/AKT pathway and a reduced level of glycogen, accompanied by decreased expression of miR-200s in the lever and elevated concentration of IL-6 in serum of db/db mice. We transfected the mimics and inhibitors of miR-200s into the NCTC 1469 cells to further investigate the role of miR-200s in IL-6-induced insulin resistance. Our results suggest miR-200s as a link between IL-6 and hepatic insulin resistance. miR-200s can modulate the activation of the AKT/GSK pathway and the glycogenesis in the hepatocytes.
Next, we looked for a correlation between the expression of FOG2 and miR-200s in hepatic insulin resistance. FOG2 is expressed in many tissues, such as liver, heart, brain, testes, lung, and skeletal muscle. Despite its relatively broad expression in adult tissues, little is known about the function of FOG2 beyond its role in embryonic heart development. Previous studies suggested that FOG2 may function as either transcriptional coactivators or corepressors by partnering with various GATA transcription factors. FOG2 is involved in the control of adipocyte proliferation and differentiation (29). FOG2 also acts as a negative modulator of the PI3K/AKT pathway. Hyun et al. (22) found that FOG2 binds p85α, a regulatory subunit of PI3K, thereby inhibiting formation of the IRS-1/p85α/p110 complex and, consequently, PI3K activation. Moreover, FOG2 has at least three predicted sites for miR-200s. These predicted sites in the 3′-UTR of FOG2 are therefore responsible for miR-200-mediated FOG2 regulation. In the present study, we found that there is generally a negative correlation between miR-200s and FOG2 in the livers of db/db mice and C57BL/6J mice injected with IL-6 and in both NCTC 1469 cells and primary hepatocytes exposed to IL-6, consistent with a suppressive role for miR-200 in FOG2 regulation. We next sought to confirm the repression of FOG2 by miR-200s. The transfection of miR-200 mimics significantly reduced the levels of FOG2, whereas miR-200 inhibitors increased the expression of FOG2 in the NCTC 1469 cells. These data demonstrate that FOG2 is an authentic target of endogenous miR-200s. To further assess the role of FOG2 in IL-6-induced hepatic insulin resistance, siRNA targeting FOG2 mRNA was transfected into the NCTC 1469 cells. The results show that the effects of IL-6 on the phosphorylation of AKT and GSK were rescued by transfection of siRNA-FOG2 into the NCTC 1469 cells. FOG2 down-regulation reversed IL-6-induced impaired glycogenesis in the NCTC 1469 cells. Furthermore, FOG2 could not affect the glycogenesis after treatment with PI3K inhibitor LY294002. These results suggest that FOG2 regulated glycogenesis through the PI3K pathway.
Our results show that overexpression of miR-200s and FOG2 knockdown could improve glycogenesis in the NCTC1469 cells. However, in the present study, we did not investigate the effects of miR-200 overexpression and FOG2 knockdown in the livers of db/db mice or FOG2 overexpression in the normal mice on glucose metabolism. It is a limitation in the present study.
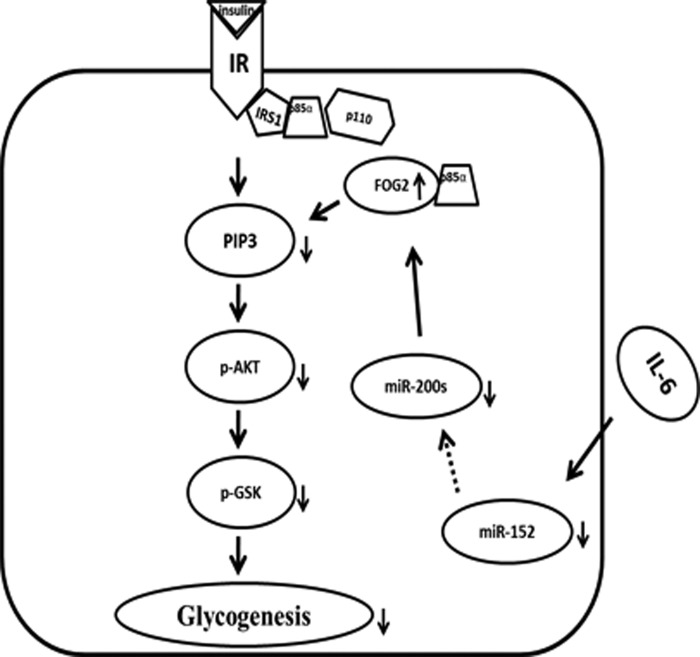
In conclusion, as shown in Fig. 7, this study provides novel data to show that miR-200s contribute to hepatic insulin resistance induced by IL-6. Our study suggests that IL-6 impairs the activation of the PI3K/AKT/GSK pathway and the synthesis of glycogen via down-regulation of miR-200s, accompanied by up-regulation of the expression of FOG2. These findings provide mechanistic insight into the effects of miR-200 on the regulation of the PI3K/AKT pathway and the synthesis of glycogen in hepatocytes.
FIGURE 7.
The proposed mechanisms by which miR-200s contribute to IL-6-induced insulin resistance in the hepatocytes. IL-6 impairs activation of the PI3K/AKT/GSK pathway and the synthesis of glycogen via down-regulation of miR-200s, accompanied by up-regulation of the expression of FOG2. p-AKT and p-GSK, phospho-AKT and -GSK, respectively.
Acknowledgment
We thank Prof. Youfei Guan (Peking University Health Science Center) for providing db/db mice.
This work was supported by National Basic Research Program of China Grant 2012CB517502 and National Natural Science Foundation of China Grants 81270887, 81070634, and 81270495.
- miRNA
- microRNA
- FFA
- free fatty acids
- GSK
- glycogen synthase kinase.
REFERENCES
- 1. Petersen K. F., Shulman G. I. (2006) New insights into the pathogenesis of insulin resistance in humans using magnetic resonance spectroscopy. Obesity 14, 34S–40S [DOI] [PMC free article] [PubMed] [Google Scholar]
- 2. Hirabara S. M., Silveira L. R., Abdulkader F., Carvalho C. R., Procopio J., Curi R. (2007) Time-dependent effects of fatty acids on skeletal muscle metabolism. J. Cell. Physiol. 210, 7–15 [DOI] [PubMed] [Google Scholar]
- 3. Leclercq I. A., Da Silva Morais A., Schroyen B., Van Hul N., Geerts A. (2007) Insulin resistance in hepatocytes and sinusoidal liver cells. Mechanisms and consequences. J. Hepatol. 47, 142–156 [DOI] [PubMed] [Google Scholar]
- 4. Allen T. L., Febbraio M. A. (2010) IL6 as a mediator of insulin resistance. Fat or fiction? Diabetologia 53, 399–402 [DOI] [PubMed] [Google Scholar]
- 5. Klover P. J., Clementi A. H., Mooney R. A. (2005) Interleukin-6 depletion selectively improves hepatic insulin action in obesity. Endocrinology 146, 3417–3427 [DOI] [PubMed] [Google Scholar]
- 6. Klover P. J., Zimmers T. A., Koniaris L. G., Mooney R. A. (2003) Chronic exposure to interleukin-6 causes hepatic insulin resistance in mice. Diabetes 52, 2784–2789 [DOI] [PubMed] [Google Scholar]
- 7. Kim J. H., Bachmann R. A., Chen J. (2009) Interleukin-6 and insulin resistance. Vitam. Horm. 80, 613–633 [DOI] [PubMed] [Google Scholar]
- 8. Bartel D. P. (2004) MicroRNAs. Genomics, biogenesis, mechanism, and function. Cell 116, 281–297 [DOI] [PubMed] [Google Scholar]
- 9. Frost R. J., Olson E. N. (2011) Control of glucose homeostasis and insulin sensitivity by the Let-7 family of microRNAs. Proc. Natl. Acad. Sci. U.S.A. 108, 21075–21080 [DOI] [PMC free article] [PubMed] [Google Scholar]
- 10. Ramachandran D., Roy U., Garg S., Ghosh S., Pathak S., Kolthur-Seetharam U. (2011) Sirt1 and mir-9 expression is regulated during glucose-stimulated insulin secretion in pancreatic beta-islets. FEBS J. 278, 1167–1174 [DOI] [PubMed] [Google Scholar]
- 11. Kloosterman W. P., Lagendijk A. K., Ketting R. F., Moulton J. D., Plasterk R. H. (2007) Targeted inhibition of miRNA maturation with morpholinos reveals a role for miR-375 in pancreatic islet development. PLoS Biol. 5, e203. [DOI] [PMC free article] [PubMed] [Google Scholar]
- 12. Joglekar M. V., Parekh V. S., Hardikar A. A. (2011) Islet-specific microRNAs in pancreas development, regeneration and diabetes. Indian J. Exp. Biol. 49, 401–408 [PubMed] [Google Scholar]
- 13. Poy M. N., Hausser J., Trajkovski M., Braun M., Collins S., Rorsman P., Zavolan M., Stoffel M. (2009) miR-375 maintains normal pancreatic α- and beta-cell mass. Proc. Natl. Acad. Sci. U.S.A. 106, 5813–5818 [DOI] [PMC free article] [PubMed] [Google Scholar]
- 14. Zhu H., Shyh-Chang N., Segrè A. V., Shinoda G., Shah S. P., Einhorn W. S., Takeuchi A., Engreitz J. M., Hagan J. P., Kharas M. G., Urbach A., Thornton J. E., Triboulet R., Gregory R. I., DIAGRAM Consortium, MAGIC Investigators, Altshuler D., Daley G. Q. (2011) The Lin28/let-7 axis regulates glucose metabolism. Cell 147, 81–94 [DOI] [PMC free article] [PubMed] [Google Scholar]
- 15. Ono K. (2011) MicroRNA links obesity and impaired glucose metabolism. Cell Res. 21, 864–866 [DOI] [PMC free article] [PubMed] [Google Scholar]
- 16. Jordan S. D., Krüger M., Willmes D. M., Redemann N., Wunderlich F. T., Brönneke H. S., Merkwirth C., Kashkar H., Olkkonen V. M., Böttger T., Braun T., Seibler J., Brüning J. C. (2011) Obesity-induced overexpression of miRNA-143 inhibits insulin-stimulated AKT activation and impairs glucose metabolism. Nat. Cell Biol. 13, 434–446 [DOI] [PubMed] [Google Scholar]
- 17. Moore K. J., Rayner K. J., Suárez Y., Fernández-Hernando C. (2011) The role of microRNAs in cholesterol efflux and hepatic lipid metabolism. Annu. Rev. Nutr. 31, 49–63 [DOI] [PMC free article] [PubMed] [Google Scholar]
- 18.Delete in proof
- 19. Shantikumar S., Caporali A., Emanueli C. (2012) Role of microRNAs in diabetes and its cardiovascular complication. Cardiovasc. Res. 93, 583–593 [DOI] [PMC free article] [PubMed] [Google Scholar]
- 20. Ryu H. S., Park S. Y., Ma D., Zhang J., Lee W. (2011) The induction of microRNA targeting IRS-1 is involved in the development of insulin resistance under conditions of mitochondrial dysfunction in hepatocytes. PLoS One 6, e17343. [DOI] [PMC free article] [PubMed] [Google Scholar]
- 21. Snowdon J., Zhang X., Childs T., Tron V. A., Feilotter H. (2011) The microRNA-200 family is upregulated in endometrial carcinoma. PLoS One 6, e22828. [DOI] [PMC free article] [PubMed] [Google Scholar]
- 22. Hyun S., Lee J. H., Jin H., Nam J., Namkoong B., Lee G., Chung J., Kim V. N. (2009) Conserved MicroRNA miR-8/miR-200 and its target USH/FOG2 control growth by regulating PI3K. Cell 139, 1096–1108 [DOI] [PubMed] [Google Scholar]
- 23. Ulvila J., Arpiainen S., Pelkonen O., Aida K., Sueyoshi T., Negishi M., Hakkola J. (2004) Regulation of Cyp2a5 transcription in mouse primary hepatocytes. Roles of hepatocyte nuclear factor 4 and nuclear factor I. Biochem. J. 381, 887–894 [DOI] [PMC free article] [PubMed] [Google Scholar]
- 24. Gao D., Nong S., Huang X., Lu Y., Zhao H., Lin Y., Man Y., Wang S., Yang J., Li J. (2010) The effects of palmitate on hepatic insulin resistance are mediated by NADPH oxidase 3-derived reactive oxygen species through JNK and p38MAPK pathways. J. Biol. Chem. 285, 29965–29973 [DOI] [PMC free article] [PubMed] [Google Scholar]
- 25. Oh Y. S., Lee Y. J., Park E. Y., Jun H. S. (2011) Interleukin-6 treatment induces beta-cell apoptosis via STAT-3-mediated nitric oxide production. Diabetes Metab. Res. Rev. 27, 813–819 [DOI] [PubMed] [Google Scholar]
- 26. David M. (2010) Interferons and microRNAs. J. Interferon Cytokine Res. 30, 825–828 [DOI] [PubMed] [Google Scholar]
- 27. Landgraf P., Rusu M., Sheridan R., Sewer A., Iovino N., Aravin A., Pfeffer S., Rice A., Kamphorst A. O., Landthaler M., Lin C., Socci N. D., Hermida L., Fulci V., Chiaretti S., Foà R., Schliwka J., Fuchs U., Novosel A., Müller R. U., Schermer B., Bissels U., Inman J., Phan Q., Chien M., Weir D. B., Choksi R., De Vita G., Frezzetti D., Trompeter H. I., Hornung V., Teng G., Hartmann G., Palkovits M., Di Lauro R., Wernet P., Macino G., Rogler C. E., Nagle J. W., Ju J., Papavasiliou F. N., Benzing T., Lichter P., Tam W., Brownstein M. J., Bosio A., Borkhardt A., Russo J. J., Sander C., Zavolan M., Tuschl T. (2007) A mammalian microRNA expression atlas based on small RNA library sequencing. Cell 129, 1401–1414 [DOI] [PMC free article] [PubMed] [Google Scholar]
- 28. Reddy M. A., Jin W., Villeneuve L., Wang M., Lanting L., Todorov I., Kato M., Natarajan R. (2012) Pro-inflammatory role of microrna-200 in vascular smooth muscle cells from diabetic mice. Arterioscler. Thromb. Vasc. Biol. 32, 721–729 [DOI] [PMC free article] [PubMed] [Google Scholar]
- 29. Jack B. H., Crossley M. (2010) GATA proteins work together with friend of GATA (FOG) and C-terminal binding protein (CTBP) co-regulators to control adipogenesis. J. Biol. Chem. 285, 32405–32414 [DOI] [PMC free article] [PubMed] [Google Scholar]


