

Background: Physiological evidences have linked phosphate and iron nutrition in plants.
Results: Both PHR1 and PHL1 interact with AtFer1 promoter region and regulate its expression in an iron-independent manner.
Conclusion: A molecular link exists between the control of iron and of phosphate homeostasis.
Significance: PHR1 and PHL1 play a critical role in the regulation of both phosphate and iron homeostasis.
Keywords: Iron, Iron Metabolism, Metal Homeostasis, Plant, Redox
Abstract
A yeast one-hybrid screening allowed the selection of PHR1 as a factor that interacted with the AtFer1 ferritin gene promoter. In mobility shift assays, PHR1 and its close homologue PHL1 (PHR1-like 1) interact with Element 2 of the AtFer1 promoter, containing a P1BS (PHR1 binding site). In a loss of function mutant for genes encoding PHR1 and PHL1 (phr1 phl1 mutant), the response of AtFer1 to phosphate starvation was completely lost, showing that the two transcription factors regulate AtFer1 expression upon phosphate starvation. This regulation does not involve the IDRS (iron-dependent regulatory sequence) present in the AtFer1 promoter and involved in the iron-dependent regulation. The phosphate starvation response of AtFer1 is not linked to the iron status of plants and is specifically initiated by phosphate deficiency. Histochemical localization of iron, visualized by Perls DAB staining, was strongly altered in a phr1 phl1 mutant, revealing that both PHR1 and PHL1 are major factors involved in the regulation of iron homeostasis.
Introduction
Because of its redox properties, iron is a major cofactor for numerous proteins involved in many biological processes such as photosynthesis or respiration. On the other hand, its ability to easily gain or lose electrons makes it highly reactive with oxygen and potentially toxic. This duality of iron imposes a tight regulation of its homeostasis to allocate a sufficient amount for metabolism and to prevent an excess deleterious for cell integrity. Plants have evolved many strategies to maintain iron homeostasis, including checkpoints of its absorption, allocation, and chelation. In this context, the recent identification of several transcription factor cascades activating iron uptake in response to iron deficiency represented a major breakthrough (1). In contrast, much less is known concerning the regulation of expression of genes involved in the buffering and storage of iron when in excess.
In plants, ferritins are plastid-located proteins able to form a holosphere, which can contain up to 4500 Fe atoms. This process allows us to buffer free iron, making it available under a safe form (2), and reveals a key role for ferritin in iron homeostasis and protection against iron-mediated oxidative stress (3). Ferritins are encoded by a multigene family of four members in Arabidopsis thaliana. Among them, the AtFer1 gene is the most expressed in response to iron excess (3). Therefore, to study the mechanisms involved in the establishment of iron homeostasis, AtFer1 is the model of iron-overload regulated gene. The up-regulation of AtFer1 expression in response to an iron excess treatment is regulated at the transcriptional level (4). Under standard iron nutrition conditions, AtFer1 expression is repressed, and this repression is lost when an iron excess treatment is applied to the plants (4, 5). A cis element, named IDRS (iron-dependent regulatory sequence)2 (4) has been characterized within the proximal promoter region of AtFer1 gene, and is the terminal target of this repressive pathway (4). AtFer1 gene is also regulated independently of the IDRS cis-regulatory element by a second repressive pathway involving the time for coffee (TIC) gene, the circadian clock, and the diurnal cycles (6). A genetic screening aiming to identify circadian clock regulators has first identified the tic-1 mutant (7). In this genetic background, ferritins were over-accumulated, which could explain the chlorotic phenotype of the tic-1 mutant plants. The involvement of TIC in AtFer1 regulation, independently of any exogenous iron treatment, pointed out the fact that ferritins are not only regulated by iron. This result integrates the regulation of iron homeostasis in a broader context, in interaction with other signals such as light and the circadian clock.
Recently, a bioinformatic analysis of all known plant ferritin genes pointed out several conserved short sequences that might play a role in signaling pathways for the expression of plant ferritin genes (8). To look for trans-acting factors able to interact with these putative cis-elements, we performed a yeast one-hybrid screening with AtFer1 promoter fragments as baits. One of the positive yeast clones selected was expressing a cDNA encoding phosphate starvation response 1 (PHR1) transcription factor, a major regulator of phosphate starvation response, belonging to the Myb-like transcription factor family (9, 10). Further studies enabled us to show that PHR1 and its close homologue PHL1 directly regulate AtFer1 expression. PHR1 and PHL1 are necessary for AtFer1 induction of expression under phosphate starvation, in a phosphate-specific manner. Results are discussed in a context of cross-talk between phosphate and iron homeostasis, and we propose that PHR1 and PHL1 act as integrators of both iron and phosphate nutritional signaling pathways.
EXPERIMENTAL PROCEDURES
Plant Material and Growth Conditions
All Arabidopsis plants used in this study, including mutants and transgenic plants were based on the Columbia 0 accession (Col 0). phr1-3 and phl1-2 mutants were obtained from the SALK collection: SALK_067629 and SALK_079505, respectively. These two alleles were crossed to obtain the phr1-3 phl1-2, named phr1 phl1 afterward, phr1-1, phl1-1 and phr1-1 phl1-1 mutants were provided by J. Paz-Ares (10). The primers used for genotyping these plants are given in supplemental Table S1. Plants were grown under long day conditions (16 h of light, 200 μE) on hydroponic growth medium containing: 1.5 mm Ca(NO3)2, 1.5 mm KNO3, 750 μm MgSO4, 750 μm KH2PO4, 50 μm FeEDTA, 50 μm KCl, 10 μm MnSO4, 1.5 μm CuSO4, 2 μm ZnSO4, 50 μm H3BO3, 0.075 μm (NH4)6Mo7O24, MES 0.5g.l-1, pH 5.7. Plants were grown for 10 days under complete medium, then washed twice with distilled water for 5 min and transferred to Pi-deficient medium, or alternately kept in complete medium. The phosphate-deficient medium was made by replacing KH2PO4 by equimolar amounts of KCl. Iron excess treatments were made by spraying 500 μm Fe-citrate on leaves. Rosettes were harvested 3 h after the treatment.
Production of Transgenic Plants
A fragment of 1.3 kbp of AtFer1 promoter, including the 5′-UTR region, was amplified by PCR, then digested with SalI and NcoI restriction enzymes, and ligated in a pBbluescript vector (Stratagene) containing the LUC+ reporter gene (Promega), cloned with NcoI and XbaI restriction site. The plasmid obtained served as a DNA matrix to produce mutations in Element 2 and IDRS sequences using a PCR-based method (primers given in supplemental Table S1) (11). The mutated DNA fragment obtained were digested with SalI and NcoI and ligated into the LUC+ containing pBluescript vector. All the cassettes generated were digested with SalI and XbaI and ligated into the pBib-Hygro binary vector (12). Plants were then transformed using the standard floral dip method (13). The lines carrying wild type AtFer1 promoter fused to LUC+ reporter gene, AtFer1 promoter mutated in element 2 fused to LUC+, AtFer1 promoter mutated in IDRS fused to LUC+, and AtFer1 promoter mutated in both IDRS and Element 2 were named pAtFer1::LUC, pElem2*::LUC, pIDRS*::LUC, and pIDRS*-Elem2*::LUC, respectively.
Yeast One-hybrid Screening
The yeast one-hybrid screening, including reporter construction generation, cDNA synthesis, and yeast transformation was performed with the Mathmaker-Gold Yeast One hybrid kit from Clontech. This screening is based on Aureobasidin A resistance, given by integration of the AUR1-C gene, fused to a minimal promoter, into the yeast genome. The −170 to −132 region of the AtFer1 promoter was tetramerized and ligated into the pAbAi vector. To make cDNA libraries, A. thaliana plants were grown under iron sufficiency, deficiency, or excess conditions. Total RNA was extracted from these various plants and then pooled before poly(A) mRNA purification using the PolyATtract® mRNA Isolation Systems (Promega). 1 μg of purified mRNA was used for cDNA synthesis.
Electrophoretic Mobility Shift Assay
Truncated versions of PHR1 and PHL1 proteins were produced using The TNT® T7 Quick Coupled Transcription/Translation System (Promega) as described (4, 10). A fragment of 160 bp of the AtFer1 promoter was generated by PCR (primers given in supplemental Table S1) and purified by Wizard® gel and PCR clean-up system (Promega). This fragment (100 ng) was labeled with [γ-32P]ATP using T4 polynucleotide kinase (NEB), precipitated, washed, and resuspended in 100 μl of water. Binding reactions were performed in a buffer containing: 10 mm Tris-HCl, pH 8, 100 mm NaCl, 2 mm EDTA, 4 mm DTT, 0.15 μg of denatured herring sperm, 0.5 μg poly(dIdC), and 10% glycerol, in a final volume of 20 μl. The labeled probe (10,000 counts·min−1) was incubated with 2 μl of the TNT reaction, with or without unlabeled probe (100× molar excess), mutated or not in Element 2. The binding reaction was performed at room temperature for 30 min prior to loading onto a 4% nondenaturing polyacrylamide gel. Electrophoresis was run for 6 h at 120 V at room temperature. After migration, the gel was dried at 80 °C for 2 h and exposed overnight to a Fuji Medical x-ray film Super RX (Fujifilm).
Real Time Quantitative PCR
All RT-qPCR analysis were performed with a LC480 lightCycler® (Roche). Total RNA was extracted using the Tri-Reagent method (Invitrogen) according to the manufacturer's instructions (14). Three rosettes were pooled for each point, and the mean of RTL from 3 points was calculated to obtain the presented values. RTL were calculated for each point with the 2−ΔΔCP method, using At1g13320 as reference gene (15). Crossing point values were calculated with the 2nd derivative max method, included in the LC480 software.
Luciferase Activity Measurement
Four plants were ground in liquid nitrogen and suspended in 400 μl of lysis buffer (25 mm NaPO4, pH 7.8, 2 mm DTT, 10% glycerol, 0.1% Triton X-100). The mixture was incubated for 10 min at room temperature, then centrifuged for 15 min at 13,000 × g at 4 °C. The supernatant (50 μl) was added to 50 μl of Steady-Glo® Luciferase Assay Buffer (Promega). Luminescence was measured for 1 s every minute for 10 min. The maximum value obtained was normalized to the protein content, quantified with Bradford reagent (Bio-Rad).
Histochemical Iron Localization
Leaves were vacuum infiltrated with fixation solution containing 2% (w/v) paraformaldehyde, 1% (v/v) glutaraldehyde, 1% (w/v) caffeine in 100 mm phosphate buffer (pH 7) for 30 min as described (16), and dehydrated in successive baths of 50, 70, 90, 95, and 100% ethanol, butanol/ethanol 1:1 (v/v), and 100% butanol. Leaves were embedded in the Technovit 7100 resin (Kulzer) according to the manufacturer's instructions, and thin sections (4 μm) were made. The sections were deposited on glass slides and were incubated for 45 min in Perls stain solution (16). The intensification procedure was then applied as described (17).
ICP-MS Analysis
Samples of dried shoots were digested with concentrated HNO3 at 200 °C for 30 min and then diluted with ultrapure water to 1% HNO3. The metal concentration was then measured by ICP-MS as described in Ref. 18.
RESULTS
PHR1 and PHL1 Interact with the AtFer1 Promoter Region
The only functional cis-acting element characterized in the AtFer1 promoter region is the IDRS, a 14-bp element involved in AtFer1 repression in absence of iron (4, 5). Although gel shift experiments indicate that protein(s) interact with the IDRS, they were not identified (4, 5). Comparative analysis of the nucleotide sequences of plant ferritin genes allowed the identification of conserved elements present in their promoter regions (8). Four elements were identified surrounding the IDRS (Fig. 1A): two upstream, and two downstream. Among the four Arabidopsis ferritin genes promoters, elements 2 and 3 were specific of AtFer1, whereas elements 5 and 6 were localized in the 4 gene promoter sequences. To identify transcription factors regulating AtFer1 gene expression, we performed a yeast one-hybrid screening using DNA fragments encompassing the IDRS, or elements 2 and 3 as baits. Elements were used as tetramers. The yeast one-hybrid screening with the DNA fragment containing the IDRS failed to isolate any positive yeast clone, because the construct used was self-activated in yeast (data not shown). With the tetrameric DNA fragment containing elements 2 and 3, 43 clones were isolated, and confirmed after retransformation. Among the positive clones, one containing a sequence encoding a part of the PHR1 transcription factor was selected. The full-length PHR1 ORF was cloned in-frame with the GAL4 activation domain and reintroduced in yeast to confirm the interaction with the bait (Fig. 1B). Interestingly, a P1BS sequence (GNATATNC) initially characterized in the promoter region of the AtIPS1 gene (9), was found within the element 2 sequence (bases in capital letters in Fig. 1A). To confirm this interaction, PHR1 binding on the AtFer1 promoter sequence was assayed by electrophoretic mobility shift assay (EMSA). PHR1-like 1 (PHL1), a close homologue of PHR1, was also included in the assay. Truncated forms of both proteins were produced in the TNT system according to Ref. 10. A 32P-labeled promoter fragment of 160 bp (corresponding to the fragment indicated in Fig. 1A) was incubated with both recombinant truncated proteins. Shifts were observed with both PHR1 and PHL1 (Fig. 1C). In competition experiments with a 100 molar excess of the wild type cold DNA fragment, the signal was not present. When competitions were performed with a mutated version of element 2, a shift signal was still detected, showing that both PHR1 and PHL1 interact in vitro with the Element 2 of the AtFer1 promoter region, likely the P1BS.
FIGURE 1.
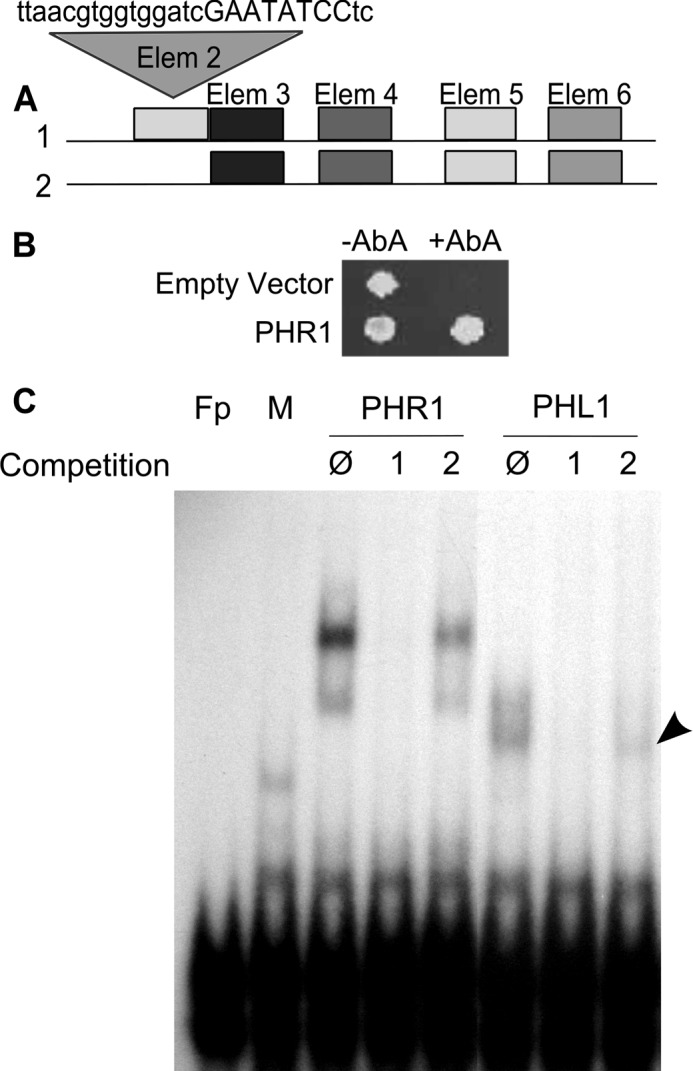
PHR1 and PHL1 interact with the AtFER1 promoter region. A, structure of AtFer1 minimal promoter. The IDRS is involved in AtFer1 repression under −Fe conditions. Alignments of plant ferritin genes promoter regions allowed the identification of conserved elements (8). Element 2 sequence is indicated, and the putative P1BS is in capital letters. B, yeast one-hybrid revealed interaction between PHR1 and Element 2. The yeast strain contains the AUR1-C gene, conferring resistance to aureobasidin A, fused to GAL4 minimal promoter and a tetramer of elements 2 and 3 of AtFer1 promoter. The strain was transformed with pGAD T7 AD vector (empty) of pGAD T7 AD-PHR1 (PHR1) containing full-length PHR1 ORF cloned in-frame with the GAL4 activation domain. Yeasts were plated on medium containing (+AbA) or not (−AbA) aureobasidin A. C, PHR1 and PHL1 interact with Element 2. PHR1 and PHL1 were produced using the TNT system. A fragment of 160 bp, containing all elements presented in A was radiolabeled and used as a probe in EMSA. Competitions were performed with a 100-fold molar excess of unlabeled wild type or mutated in Element 2 (fragments 1 and 2, respectively). O indicates absence of competition. Fp: free probe, M: mock. A mock translation mixture was used as control.
AtFer1 Expression Is Altered in the phr1-3 Mutant upon Phosphate Starvation
PHR1 has been extensively studied and shown to be a major regulator of plant responses to phosphate starvation (9, 10, 19, 20). To determine whether PHR1 could be involved in AtFer1 gene expression in planta, we isolated a PHR1 loss-of-function mutant. This mutant, named phr1-3, was obtained from the Salk (line SALK_067629) and was previously characterized (19). Accumulation of AtFER1, −3, and −4 ferritin gene transcripts was determined in wild type and phr1-3 backgrounds. AtFer2 was not included, since this gene is not expressed in leaves (3). Plants were hydroponically grown for 10 days in a complete medium and subjected to phosphate starvation for 9 days. Efficiency of phosphate starvation was estimated using the accumulation of the AtIPS1 transcript as a control (9, 10). Under our conditions, AtIPS1 mRNA abundance was strongly increased in wild type plants (18-fold increase) after 9 days of phosphate deficiency, and this response was strongly altered in phr1-3 plants (Fig. 2A). AtFer3 and AtFer4 mRNA abundance were similar in wild type and phr1-3 mutant plants and were not affected by phosphate starvation. By contrast, AtFer1 mRNA accumulation was increased in wild type plants after 9 days of starvation. In leaves of phr1-3 plants, AtFer1 mRNA abundance was still increased after phosphate starvation, but to a lower extent when compared with wild type plants. AtFer3 and AtFer4 mRNA levels remained unchanged in phr1-3 when compared with wild type plants (Fig. 2A).
FIGURE 2.
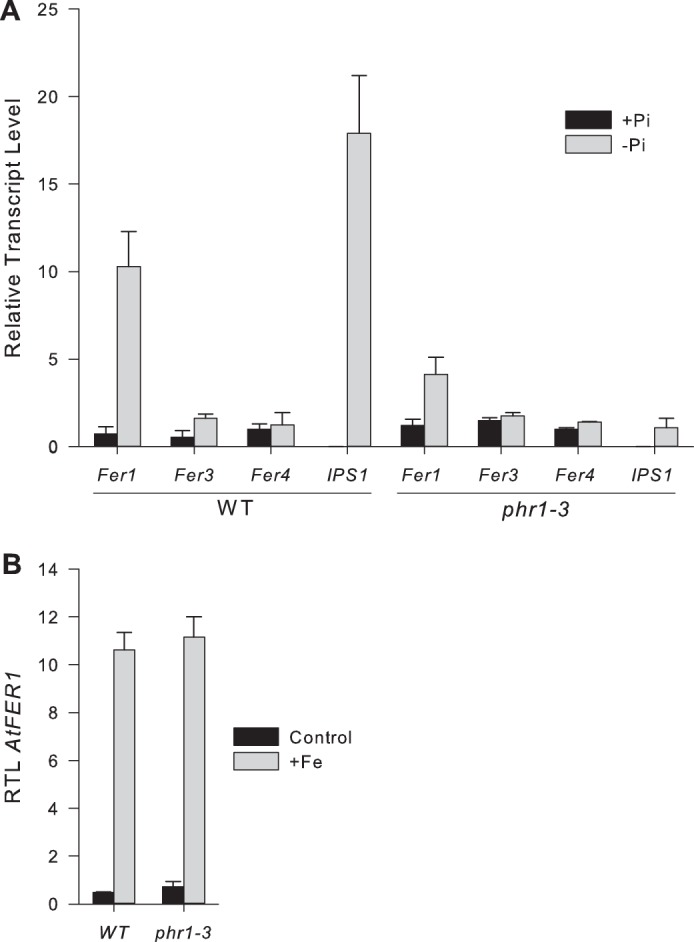
AtFer1 expression is altered in phr1-3 mutant in response to phosphate starvation. In both experiments, relative transcript levels were assayed by RT-qPCR relative to an internal control (At1g13320) using the 2−ΔΔCP method. Values are presented as the means of 3 points ± S.D. A, plants were grown for 10 days under complete medium and then transferred to Pi-deficient medium (−Pi) for 7 days or kept under complete medium (+Pi). B, plants were grown on soil for 15 days (control). A solution of 500 μm Fe-citrate was sprayed on rosettes 3 h before harvest (+Fe).
Phosphate starvation has been correlated to a modification of iron distribution and to an increase of iron content in plant tissues (21, 22). Thus, the alteration of AtFer1 mRNA accumulation in response to phosphate starvation in phr1-3 plants could be related to an alteration of the response of this gene to an iron excess in this genetic background. To challenge this hypothesis, the ability of AtFer1 gene to be up-regulated in response to iron overload was assayed in the phr1-3 background (Fig. 2B). Plants were grown for 19 days in a control medium and treated for 3 h with 500 μm Fe-citrate. This treatment was previously shown to de-repress the expression of the AtFer1 gene and leads to a strong increase in abundance of its transcript (4, 5, 23). In phr1-3 mutant, AtFer1 mRNA transcript abundance was strongly increased, and the level reached was close to the one observed in wild type plants, indicating that the effect of PHR1 on AtFer1 gene expression is not linked to a defect of the gene response to iron overload under phosphate starvation.
These results show that phosphate starvation leads to an increase of AtFer1 mRNA abundance, and that this response is PHR1 dependent. By contrast, expression of other ferritin genes is not altered by phosphate deficiency, which is consistent with the lack of P1BS sequence in their promoter. Furthermore, the PHR1-dependent Pi-deficiency response of AtFer1 is unrelated to an alteration of the iron responsiveness of this gene.
PHR1 and PHL1 Regulation of AtFer1 Expression Is Independent of the Plant Iron Status
As observed in Fig. 2, PHR1 regulates only partially the AtFer1 response to phosphate starvation. Since gel shift experiments (Fig. 1C) showed that PHL1 was also able to bind to Element 2 in the AtFer1 promoter region, we hypothesized that the residual level of AtFer1 transcript observed in the phr1-3 mutant in response to phosphate starvation could be due to PHL1 activity. To challenge this hypothesis, a PHL1 loss of function mutant, phl1-2 (SALK_079505), was isolated and crossed with phr1-3 mutant plants. AtFer1 mRNA abundance was monitored during a time course after phosphate starvation in wild type, phr1-3, phl1-2, and in the phr1 phl1 double mutant. Plants were grown hydroponically for 10 days in a complete medium and transferred to a phosphate-free medium. Shoots and roots were collected 3 to 9 days after transfer to the −Pi medium. AtIPS1 was used as a positive control of the efficiency of phosphate starvation (data not shown).
In leaves (Fig. 3A) of both wild type and phl1-2 plants, AtFer1 mRNA abundance was low during the 5 first days of phosphate starvation, and was strongly increased (by 15-fold) after 7 and 9 days. In phr1-3 leaves, an increase of AtFer1 transcript abundance was still observed, but to a lower extent than in wild type leaves. This result is consistent with those presented in Fig. 2A. AtFer1 mRNA increase in abundance was completely abolished in the leaves of the phr1 phl1 double mutant (Fig. 3A). In roots (Fig. 3B), the profile of AtFer1 mRNA abundance was reminiscent of those observed in leaves for both wild type and phl1-2 plants, nevertheless with a higher increase in abundance (by 25-fold after 7 days). In both phr1-3 and phr1 phl1 mutant plants, the AtFer1 response to phosphate starvation was completely abolished (Fig. 3B). We performed a similar analysis with two additional mutants in PHR1 and PHL1 genes: phr1-1, phl1-1, and phr1-1 phl1-1 mutants (10). Results obtained are similar to those presented on Fig. 3 for phr1-3 and phl1-2 (Fig. 4). These results indicated that PHR1 and PHL1 are both necessary to obtain the full response of AtFer1 gene expression to phosphate starvation in leaves, whereas PHR1 activity was sufficient to obtain a complete response in roots.
FIGURE 3.
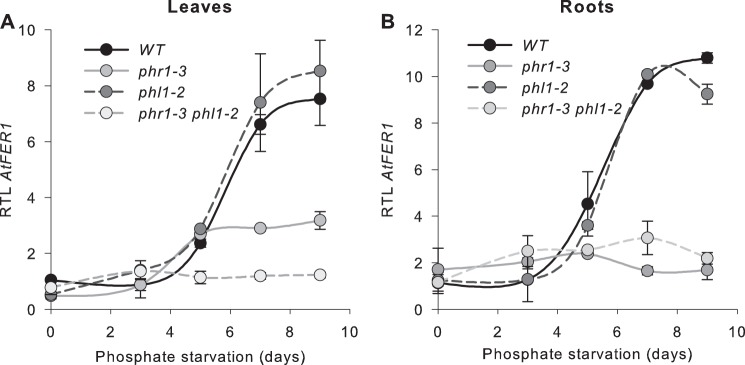
AtFer1 response to phosphate starvation. Plants were grown on hydroponic complete medium for 10 days and then transferred to Pi-deficient medium. leaves (A) and roots (B) were harvested 0, 3, 5, 7, and 9 days after transfer. Relative transcript levels were assayed by RT-qPCR relative to an internal control (At1g13320) using 2−ΔΔCP method. Values are presented as the mean of 3 points, ± S.D. Wild type (black line), phl1-2 (dark gray dotted line), phr1-3 (gray line), phr1-3/phl1-2 (gray dotted line).
FIGURE 4.
AtFer1 response to phosphate starvation. Plants were grown on complete medium for 10 days and then transferred on Pi-deficient medium (gray bars), or kept in complete medium (black bars) for 7 days. RNA was prepared from leaves. Relative transcript levels were assayed by RT-qPCR relative to an internal control (At1g13320) using the 2−ΔΔCP method. Values are presented as the mean of 3 points ± S.D.
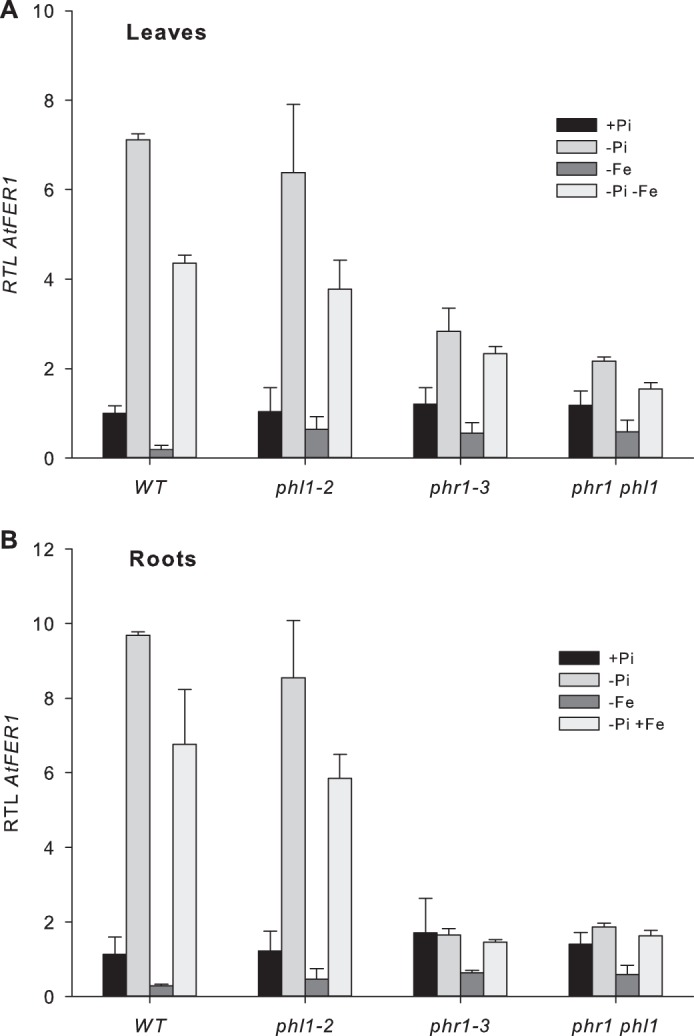
To determine whether the effect observed during the time course of phosphate starvation reported above was specific for phosphate starvation per se, or indirectly due to an iron excess generated by phosphate starvation (21, 22), a phosphate starvation treatment was applied in the presence or absence of iron in the culture medium of wild type, phr1-3 phl1-2, and phr1 phl1 plants. Plants were grown for 10 days in a complete medium containing 50 μm iron, and transferred for 5 days in the same medium without phosphate. Finally, plants were transferred for two additional days in a phosphate-free medium in the presence (−Pi treatment) or in the absence (−Pi -Fe treatment) of iron, or in an iron-free medium in the presence of phosphate (−Fe treatment). Control plants were grown for 17 days in a complete medium. Roots and shoots were collected, and AtFer1 mRNA abundance was determined. In the presence of iron during all the growth period, phosphate starvation led to an increase of AtFer1 mRNA abundance, partially compromised in phr1-3 leaves, completely abolished in phr1-3 roots and in phr1 phl1 leaves and roots, which is consistent with experiments reported above (Fig. 5). Transfer of plants to the iron-free medium led to a decrease in AtFer1 mRNA abundance, a behavior expected for this gene known to be repressed under −Fe conditions (3, 4). However, combination of both iron and phosphate starvation led to an increase of AtFer1 abundance, indicating that activation of AtFer1 expression in response to phosphate starvation is independent of the iron nutrition conditions of the plant (Fig. 5). Induction factors by phosphate starvation were about 15- and 10-fold in wild type leaves and roots, respectively. It was only 8-fold in phr1-3 and 1.8-fold in phr1 phl1 leaves, and there was no response to phosphate starvation in roots. In iron-free medium, −Pi induction factors of AtFer1 gene expression were 18 and 24 in wild type leaves and roots, 5.5 and 2 in phr1-3 leaves and roots, respectively, and 2.5 and 2.7 in phr1 phl1 leaves and roots, respectively. Under all conditions, both in leaves and roots, phl1-2 exhibited a behavior similar to wild type. These results show that activation of AtFer1 gene expression by phosphate starvation is not linked to an indirect effect related to an increase in iron accumulation into the plant, and is mostly independent of the iron status of the plant.
FIGURE 5.

Effect of iron on AtFer1 response to phosphate starvation. Plants were grown on complete medium for 10 days and then transferred on Pi-deficient medium (−Pi), or kept in complete medium (+Pi) for 7 days. Iron starvation was applied 2 days before harvesting. Relative transcript levels were assayed by RT-qPCR relative to an internal control (At1g13320) using the 2−ΔΔCP method. Values presented are the means of 3 points ± S.D. A, expression in leaves. B, expression in roots.
Element 2 of the AtFer1 Promoter Is Necessary for the −Pi Response
To assess the role of Element 2 in the AtFer1 promoter upon phosphate starvation, the promoter region of the gene was fused upstream of the LUC reporter gene (pAtFer1::LUC). The 1.3-kb region upstream from the start codon, previously found to be sufficient for a correct expression of the AtFer1 gene (4, 6) was used. Additional constructs with mutated versions of cis-acting elements were prepared including pElem2*::LUC (a mutated version of the Element 2 in Fig. 1A); pIDRS*::LUC (a mutated version of the IDRS) and pIDRS*-Elem2*::LUC (a construct with mutations in both elements). After transformation of wild type plants with these three constructs, two independent homozygous lines for each construction, containing one copy of the transgene, were selected.
Luciferase activity in two independent transgenic lines was measured for each construct under control conditions, after 9 days of Pi starvation or after 3 h of iron overload as described above. In pAtFer1::LUC plants, iron overload led to an increase of LUC activity, as previously described (6). Phosphate starvation led also to an increase of LUC activity, showing that this condition regulates AtFer1 expression at the transcriptional level (Fig. 6). In pIDRS*::LUC lines, LUC activity was strongly increased when compared with pAtFer1::LUC lines, as expected from lines with a mutation in the cis-acting element involved in repression under low iron conditions (4, 6). Iron addition did not modify LUC activity in these two lines comparative to the control. Phosphate starvation led to a strong increase of luciferase activity of pIDRS*::LUC lines, indicating that IDRS is not involved in the phosphate starvation response of AtFer1. Surprisingly, in both pElem2*::LUC lines, LUC activity was dramatically decreased. Neither iron overload, nor phosphate starvation could significantly increase LUC activity in these lines. This indicates that Element 2 from the AtFer1 promoter is critical for the transcriptional activity of the gene. When the mutated version of Element 2 was combined with the mutated version of the IDRS (pIDRS*-Elem2*::LUC lines), LUC activity was restored, but to a much lower level than in pIDRS*::LUC lines. In both lines, LUC activity in iron-treated or phosphate-starved plants was close to LUC activity measured in control conditions. This result shows that mutation within Element 2 abolished the transcriptional activation of AtFer1 by phosphate starvation. Taken together, our results using mutants in trans (Figs. 2 & 3) or in cis (Fig. 6) demonstrate that the expression of the AtFer1 gene is transcriptionally regulated by the closely related PHR1 and PHL1 transcription factors, and that this regulation occurs on Element 2 of the AtFer1 promoter.
FIGURE 6.
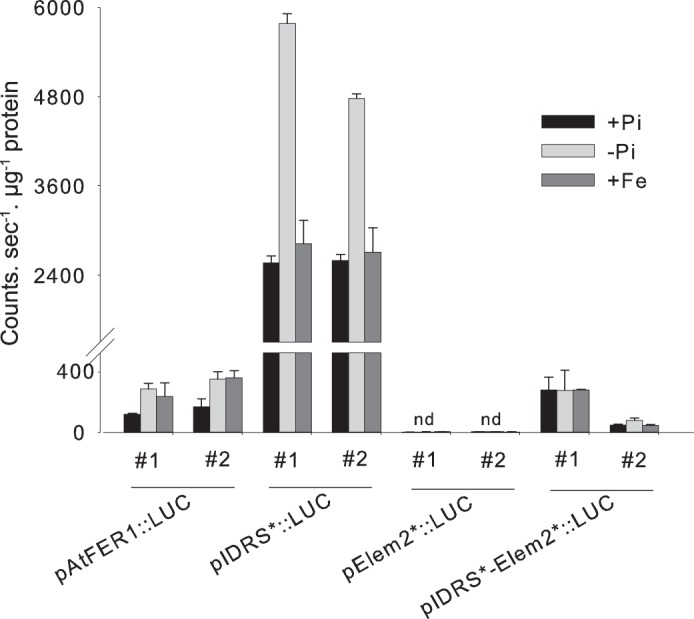
Role of element 2 in the regulation of AtFer1. Luciferase activity measurement from 2 independent homozygous monolocus lines are presented for each construction. Plants were grown on complete medium for 10 days and then transferred on Pi-deficient medium (−Pi), or kept in complete medium (+Pi) for 7 days. Iron shoots were performed on plants grown for 17 days on complete medium. A solution of 500 μm Fe-citrate was sprayed on rosettes 24 h before harvest. Values are means of 3 points ± S.D., nd: not detectable.
Alteration of Iron Homeostasis in the phr1 phl1 Mutant
Results presented above show that AtFer1 gene is a direct target of the two transcription factors PHR1 and PHL1, previously reported as regulators of the plant responses to phosphate deficiency. This suggests a molecular link between iron and phosphate homeostasis, since two major factors of phosphate starvation responses (PHR1 and PHL1) regulate AtFer1, a major gene involved in iron homeostasis. To determine whether PHR1 and PHL1 could be involved in the control of iron homeostasis in a broader way than regulating AtFer1 gene expression, we first determined metal concentration in leaves of wild type and phr1 phl1 mutant grown hydroponically in control and Pi-starved conditions (Fig. 7A). In wild type plants, phosphate starvation led to a slight decrease of total Mn and Mg concentrations, whereas total Fe and Cu concentrations were not modified. When compared with wild type, only Fe concentration were strongly altered in phr1 phl1 mutant, suggesting that mutation of these two factors alters strongly iron uptake, transport, and distribution within the plant. For the other metals investigated, no strong effects were observed. Expression of additional iron-related genes was analyzed in both wild type and mutant, under control and Pi-starved conditions. YSL8, NAS3, and NRAMP4, three iron-regulated genes, and FIT1, a major regulator of iron starvation response, were selected (Fig. 7B). NAS3 mRNA accumulation was increased by phosphate starvation, and its expression was not strongly altered in the phr1 phl1 mutant. Expression of YSL8 was reminiscent of AtFer1, with an increase of transcript accumulation after Pi starvation, compromised in phr1 phl1 mutant. NRAMP4 expression was not modified by phosphate status, but its expression is altered in phr1 phl1 mutant. Regarding the iron-starvation regulated gene FIT1, neither phosphate starvation nor PHR1 and PHL1 mutations altered mRNA accumulation. Taken together, these results show that besides AtFer1, the expression of other iron-related genes is modified by phosphate starvation and/or by mutations in PHR1 and PHL1 genes.
FIGURE 7.

Metal content and iron-related genes expression in phr1phl1. Plants were grown on complete medium for 10 days and then transferred on Pi-deficient medium (−Pi), or kept in complete medium (+Pi) for 7 days. A, leaves were dried, digested with HNO3, and diluted with ultrapure water to 1% HNO3. Metal content was then measured by ICPMS. Values are means of 3 points ± S.D., nd: not detectable. B, plants were grown on complete medium for 10 days and then transferred on Pi-deficient medium (black bars), or kept in complete medium (gray bars) for 7 days. RNA was prepared from leaves. Relative transcript levels were assayed by RT-qPCR relative to an internal control (At1g13320) using the 2−ΔΔCP method. Values are presented as the mean of 3 independent biological repeats ± S.D.
We then examined whether iron distribution was altered in leaf tissues of phr1-3 and phr1 phl1 mutant plants, comparatively to wild type plants. Iron was visualized using the Perls DAB staining method (17). Plants were grown in complete medium for 10 days and then transferred in phosphate-deficient medium for 7 days, or kept on complete medium. Mature leaves were collected, fixed, dehydrated, and embedded in resin. Thin sections were made and stained using the Perls DAB method. In wild type plants grown under control conditions, iron staining was undetectable (Fig. 8A). After phosphate starvation, iron depositions were only observed in the vascular tissues, and to a lower extent in chloroplasts of cells surrounding the vessels (Fig. 8B), consistent with results previously reported (21). The same pattern was observed in phr1-3, both in control (Fig. 8C) and phosphate starvation (Fig. 8D) conditions. By contrast, iron depositions were strongly detected in phr1 phl1 leaves grown in control conditions (Fig. 8E). This pattern is reminiscent of those observed in wild type and phr1-3 leaves grown in phosphate-starved conditions. These results show that iron distribution is altered in phosphate-starved plants. Moreover, both PHR1 and PHL1 are involved in the control of iron homeostasis, since under control conditions, iron localization is altered in the phr1 phl1 double mutant.
FIGURE 8.
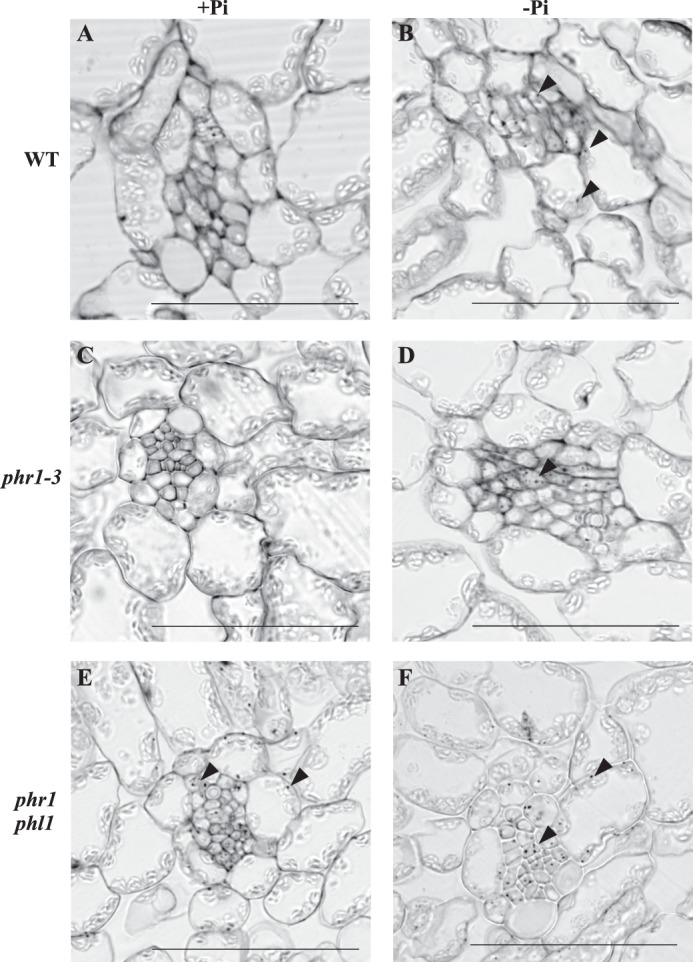
PHR1 and PHL1 control iron distribution. Plants were grown on complete medium for 10 days and then transferred on Pi-deficient medium (−Pi), or kept in complete medium (+Pi) for 7 days. Leaves were fixed, embedded in resin, and thin sections (5–8 μm) were made. Iron localization was revealed using the Perls DAB staining. Iron spots are indicated by arrows. A & B: wild type; C & D: phr1-3; E & F: phr1phl1. Scale bar: 50 μm.
DISCUSSION
Searching for transcription factors binding to the Arabidopsis AtFer1 ferritin promoter allowed us to identify the Myb-like transcription factor PHR1, a major regulator of phosphate starvation response (9, 10). The regulation of AtFer1 gene expression by PHR1 and its close homolog PHL1 was assessed and revealed a direct molecular link between iron and phosphate homeostasis.
PHR1, PHL1, and Element 2 Are Required for AtFer1 Ferritin Gene Expression
Our results allowed the identification of two trans- (PHR1 and PHL1) and one cis-acting (Element 2) component involved in the regulation of AtFer1. Both PHR1 and PHL1 are involved in the regulation of AtFer1 expression in response to phosphate starvation in shoots, whereas PHR1 alone is sufficient to set up the response in roots. This result confirms that functional heterodimeric interactions as well as the possibility of partial functional redundancy occur between these two factors (9, 10). PHR1 and PHL1 transcription factors interact in EMSA experiments with Element 2 of the AtFer1 promoter, which contains a P1BS sequence (Fig. 1). In transgenic lines expressing LUC gene under the control of the AtFer1 promoter harboring a mutated version of Element 2 (pElem2*::LUC), the luciferase activity was completely abolished (Fig. 6). This lack of luciferase activity in pElem2*::LUC was intriguing, but a similar result has been described for the PLDZ2 gene promoter (24). The authors reported that deletion of the P1BS sequence leads to a complete loss of PLDZ2 gene expression, even under control condition, similarly to the observation with the pElem2*::LUC lines. To confirm that Element 2 is involved in induction of expression of AtFer1 in response to phosphate starvation, transgenic lines expressing luciferase under the control of the AtFer1 promoter mutated in both IDRS and Element 2 were generated. When mutation in Element 2 was combined with mutation in the IDRS repressive element, the luciferase activity was recovered. In these lines, under −Pi conditions, luciferase activity was not increased, indicating that the cis-acting Element 2 contains a sequence necessary for the phosphate starvation: PHR1- and PHL1-dependent regulation of AtFer1 gene expression. Moreover, Element 2 appears to play a crucial role in AtFer1 promoter activity under both standard and phosphate deficiency conditions.
Pi/Fe Interactions and the Regulation of AtFer1 Expression
Several studies highlighted the physiological link existing between iron and phosphate (21, 22). Iron and phosphate can interact in soils, at the root surface and within plant cells. In soils, phosphate, and iron form precipitates, decreasing phosphate and iron availability for plants, and consequently promoting activation of the root iron uptake under phosphate excess conditions (22). Moreover, phosphate starvation leads to metal accumulation in plants, mainly aluminum and iron (21, 22, 25), and a decrease of primary root growth under phosphate deficiency is, at least partly, linked to iron toxicity (22, 26). Iron promotes Pi retention in roots and reduces Pi translocation to the shoots (27, 28). During seed loading, iron is stored in the vacuole, precipitated in globoids of Fe-Pi complexes (29, 30). In leaves, high Pi content could lead to chlorosis (even with normal Fe content) by making iron unavailable for the chloroplasts (31). Basically, these studies revealed that phosphate displays high affinity for iron and thus, manipulating phosphate homeostasis has a strong effect on iron availability. Several authors hypothesized that the induction of AtFer1 expression in leaves reflected the plant response to iron overload induced by phosphate deficiency, such a deficiency increasing Fe availability in soils. This statement was mainly based on transcriptomic data obtained with phosphate deficient plants showing an increase in abundance of transcripts from iron excess responsive genes, and a decrease in abundance of transcripts from iron deficiency responsive genes (25, 32, 33). Our study reveals a more complex picture since increase in abundance of AtFer1 mRNA under phosphate starvation is mediated by PHR1 and PHL1, two major regulators of the −Pi response (Figs. 3 and 4). This response is independent of the iron nutrition of the plant (Fig. 5) and does not involve the Fe-dependent IDRS cis-acting element (Fig. 6) involved in AtFer1 regulation by iron. Moreover, AtFer3 and AtFer4 ferritins genes, lacking the Element 2 in their promoter and known to be induced by iron excess (3), are not altered by phosphate starvation (Fig. 2). In addition, the induction of AtFer1 in response to iron excess is not altered in the phr1-3 mutant plants. Taken together, these results demonstrate that AtFer1 expression in response to phosphate starvation is not related to an excess of iron caused by phosphate deficiency, but to a direct effect of the lack of phosphate.
Why Is AtFer1 Expression Regulated by the Phosphate Status of Plants ?
The regulation of AtFer1 expression by phosphate starvation independently of iron was quite intriguing. In plants, phosphate is part of the mineral core of ferritins, and the ratio is about 1 phosphate for 3 iron atoms (34). An attractive hypothesis would be that ferritins are necessary to regulate phosphate homeostasis in plastids, since these proteins store phosphate as well as iron. However, phosphate concentration in the chloroplast is about 10 mm (35), or about 200 μg.g-1 DW in leaves, assuming that DW is 10% of FW (35). The iron content in the stroma is about 19 μg.g-1 DW (36). Considering that all the chloroplast soluble iron is stored into ferritins, the ferritin phosphate content would be 19/3 = 6.33 μg.g-1 DW. It represents less than 1% of the chloroplast phosphate content. Thus, ferritin cannot be considered as a major actor in the control of phosphate homeostasis in the chloroplast.
Recently, in vitro iron loading into horse spleen ferritin in the presence of phosphate has been achieved (37). This work reported that Fe-Pi complexes were a poor iron source for ferritins, since greater the amount of phosphate in the medium was, the less iron was loaded into ferritins. These experiments were done at a phosphate concentration of 10 mm, which corresponds to the amount of phosphate present in a chloroplast (35). Assuming that most of soluble iron in chloroplast is phosphate iron, iron would be poorly available for ferritins. Under phosphate starvation, the chloroplast phosphate content decreases, and causes the release of “free” iron, which would become available for ferritins. In such a situation, it makes sense to anticipate the regulation of ferritin synthesis through a phosphate specific pathway, because the main requirement would be to trap any “free” iron to avoid toxicity, rather than dealing with an increase in total iron content. The main sink of iron in leaves is the chloroplast, where oxygen is produced. In such an environment, mastering iron speciation is critical to protect the chloroplast against oxidative stress generated by free iron, and ferritins have been described to participate to this process (3). This hypothesis highlights that anticipating changes in iron speciation could also promote transient up-regulation of ferritin gene expression, in addition to the already established regulations acting in response to an iron overload. It replaces iron in a broader context, in interaction with other mineral elements, which should better reflect plant nutritional status.
PHR1 and PHL1 Regulate Iron Homeostasis
Our results show that AtFer1 is a direct target of PHR1 and PHL1, and that iron distribution around the vessels is abnormal in phr1 phl1 mutant under control conditions, as observed by Perls DAB staining (Fig. 8). Indeed, an over-accumulation of iron around the vessels was observed in the mutant and not in the wild type plants. These results suggest that PHR1 and PHL1 may have a broader function than the sole regulation of phosphate deficiency response, and that the two factors are not only active under phosphate starvation.
To decipher signaling pathways in response to phosphate starvation, several transcriptomic analysis were performed in wild type (25, 32, 33), and in phr1 and phl1 mutants (10). All these studies revealed an increase of AtFer1 expression under phosphate starvation, and a decreased expression of AtFer1 in phr1-1 phl1-1 double mutant in response to phosphate starvation, in agreement with our results. Interestingly, these genome-wide analysis revealed other genes related to iron homeostasis induced upon phosphate starvation in wild type, and displaying a decreased induction in phr1-1 phl1-2 double mutant plants, such as NAS3 and YSL8. Moreover, iron deficiency responsive genes, such as FRO3, IRT2, IRT1, and NAS1 were repressed upon phosphate starvation in wild type and mis-regulated in the phr1-1 phl1-1 double mutant plants. Our results are consistent with these studies, since we observed a modification of the expression of several iron-related genes (Fig. 7B) including YSL8. We did not observe alteration of NAS3 expression, probably because our plant growth conditions (hydroponics) were different from previous studies (in vitro cultures; 10, 24, 31). These observations led us to hypothesize that AtFer1 is not the only iron-related target of PHR1 and PHL1, and that these two factors could control iron homeostasis globally. Consistent with this hypothesis, iron distribution in the double phr1 phl1 mutant plant is abnormal when compared with wild type plants, as observed by Perls DAB staining (Fig. 8). Several studies showed that phosphate starvation led to an increase of iron content (21, 22, 25). Surprisingly, in our experimental conditions, Fe concentration was not affected in wild type after 7 days of phosphate starvation. This difference could arise from differences in growth conditions, and points out that iron distribution could be altered independently of a modification of total iron content. Indeed, such a discrepancy between total iron content and iron distribution has been described in several cases, including for example the tomato chloronerva mutant, with leaves harboring iron starvation symptoms and exhibiting an increase of total iron content (38).
To adapt to phosphate starvation, plants establish a set of coordinated responses in time and in space. In this context, it is likely that PHR1 and PHL1 play a critical role in the plant response to phosphate starvation, by coordinating transcriptional regulation of phosphate-related genes (10, 32), but also iron-related genes (this work) and sulfate metabolism (39). Functions of PHR1 and PHL1 independent of Pi starvation have been evoked (10). Our study strengthens this hypothesis since iron distribution is altered in phr1 phl1 mutant under control conditions. Indeed, besides iron homeostasis, sulfate transport, enzymes involved in ROS scavenging and detoxication, genes encoding proteins involved in light reactions of photosynthesis and in photorespiration were shown to be directly or indirectly controlled by PHR1 and PHL1 (10, 25, 39). Our work revealed for the first time a direct molecular link between iron and phosphate homeostasis and shows how different signals coming from different mineral element are integrated by plants to adapt their metabolism and growth.
Acknowledgments
We thank Carine Alcon for help with Perls DAB staining experiments, Laurent Ouerdane and Paulina Flis (IPREM, CNRS Pau, France) for ICP-MS analysis, Javier Paz-Ares (CSIC, Madrid, Spain) for phr1-1, phl1-1 and phr1-1 phl1-1 mutants, the Salk Institute Genomic Analysis Laboratory (SIGNAL) for providing the sequence indexed Arabidopsis T-DNA insertion mutants, and the Nottingham Arabidopsis Stock Centre for providing seeds.
This work was supported by the Centre National de la Recherche Scientifique (CNRS) (to M. B.).

This article contains supplemental Table S1.
- IDRS
- iron-dependent regulatory sequence
- PHR
- phosphate starvation response
- PHL
- PHR1-like.
REFERENCES
- 1. Hindt M. N., Guerinot M. L. (2012) Getting a sense for signals: regulation of the plant iron deficiency response. Biochim. Biophys. Acta 1823, 1521–1530 [DOI] [PMC free article] [PubMed] [Google Scholar]
- 2. Briat J. F., Duc C., Ravet K., Gaymard F. (2010) Ferritins and iron storage in plants. Biochim. Biophys. Acta 1800, 806–814 [DOI] [PubMed] [Google Scholar]
- 3. Ravet K., Touraine B., Boucherez J., Briat J. F., Gaymard F., Cellier F. (2009) Ferritins control interaction between iron homeostasis and oxidative stress in Arabidopsis. Plant J. 57, 400–412 [DOI] [PubMed] [Google Scholar]
- 4. Petit J. M., van Wuytswinkel O., Briat J. F., Lobréaux S. (2001) Characterization of an iron-dependent regulatory sequence involved in the transcriptional control of AtFer1 and ZmFer1 plant ferritin genes by iron. J. Biol. Chem. 276, 5584–5590 [DOI] [PubMed] [Google Scholar]
- 5. Arnaud N., Murgia I., Boucherez J., Briat J. F., Cellier F., Gaymard F. (2006) An iron-induced nitric oxide burst precedes ubiquitin-dependent protein degradation for Arabidopsis AtFer1 ferritin gene expression. J. Biol. Chem. 281, 23579–23588 [DOI] [PubMed] [Google Scholar]
- 6. Duc C., Cellier F., Lobréaux S., Briat J. F., Gaymard F. (2009) Regulation of iron homeostasis in Arabidopsis thaliana by the clock regulator time for coffee. J. Biol. Chem. 284, 36271–36281 [DOI] [PMC free article] [PubMed] [Google Scholar]
- 7. Hall A., Bastow R. M., Davis S. J., Hanano S., McWatters H. G., Hibberd V., Doyle M. R., Sung S., Halliday K. J., Amasino R. M., Millar A. J. (2003) The TIME FOR COFFEE gene maintains the amplitude and timing of Arabidopsis circadian clocks. Plant Cell 15, 2719–2729 [DOI] [PMC free article] [PubMed] [Google Scholar]
- 8. Strozycki P. M., Szymanski M., Szczurek A., Barciszewski J., Figlerowicz M. (2010) A new family of ferritin genes from Lupinus luteus–comparative analysis of plant ferritins, their gene structure, and evolution. Mol. Biol. Evol. 27, 91–101 [DOI] [PubMed] [Google Scholar]
- 9. Rubio V., Linhares F., Solano R., Martín A. C., Iglesias J., Leyva A., Paz-Ares J. (2001) A conserved MYB transcription factor involved in phosphate starvation signaling both in vascular plants and in unicellular algae. Genes Dev. 15, 2122–2133 [DOI] [PMC free article] [PubMed] [Google Scholar]
- 10. Bustos R., Castrillo G., Linhares F., Puga M. I., Rubio V., Pérez-Pérez J., Solano R., Leyva A., Paz-Ares J. (2010) A central regulatory system largely controls transcriptional activation and repression responses to phosphate starvation in Arabidopsis. PLoS Genet. 6, e1001102. [DOI] [PMC free article] [PubMed] [Google Scholar]
- 11. Van Wuytswinkel O., Savino G., Briat J. F. (1995) Purification and characterization of recombinant pea-seed ferritins expressed in Escherichia coli: influence of N-terminus deletions on protein solubility and core formation in vitro. Biochem. J. 305, 253–261 [DOI] [PMC free article] [PubMed] [Google Scholar]
- 12. Becker D. (1990) Binary vectors which allow the exchange of plant selectable markers and reporter genes. Nucleic Acids Res. 18, 203. [DOI] [PMC free article] [PubMed] [Google Scholar]
- 13. Bent A. F. (2000) Arabidopsis in planta transformation. Uses, mechanisms, and prospects for transformation of other species. Plant Physiol. 124, 1540–1547 [DOI] [PMC free article] [PubMed] [Google Scholar]
- 14. Chomczynski P., Sacchi N. (2006) The single-step method of RNA isolation by acid guanidinium thiocyanate-phenol-chloroform extraction: twenty-something years on. Nature Protocols 1, 581–585 [DOI] [PubMed] [Google Scholar]
- 15. Czechowski T., Stitt M., Altmann T., Udvardi M. K., Scheible W. R. (2005) Genome-wide identification and testing of superior reference genes for transcript normalization in Arabidopsis. Plant Physiol. 139, 5–17 [DOI] [PMC free article] [PubMed] [Google Scholar]
- 16. Roschzttardtz H., Conéjéro G., Curie C., Mari S. (2009) Identification of the endodermal vacuole as the iron storage compartment in the Arabidopsis embryo. Plant Physiol. 151, 1329–1338 [DOI] [PMC free article] [PubMed] [Google Scholar]
- 17. Roschzttardtz H., Conéjéro G., Curie C., Mari S. (2010) Straightforward histochemical staining of Fe by the adaptation of an old-school technique: identification of the endodermal vacuole as the site of Fe storage in Arabidopsis embryos. Plant Signal Behav. 5, 56–57 [DOI] [PMC free article] [PubMed] [Google Scholar]
- 18. Schaumloffel D., Ouerdane L., Bouyssiere B., Lobinski R. (2003) Speciation analysis of nickel in the latex of a hyperaccumulating tree Sebertia acuminata by HPLC and CZE with ICP MS and electrospray MS-MS detection. J. Anal. At. Spectrom. 18, 120–127 [Google Scholar]
- 19. Nilsson L., Müller R., Nielsen T. H. (2007) Increased expression of the MYB-related transcription factor, PHR1, leads to enhanced phosphate uptake in Arabidopsis thaliana. Plant Cell Environ. 30, 1499–1512 [DOI] [PubMed] [Google Scholar]
- 20. Nilsson L., Lundmark M., Jensen P. E., Nielsen T. H. (2012) The Arabidopsis transcription factor PHR1 is essential for adaptation to high light and retaining functional photosynthesis during phosphate starvation. Physiol. Plant 144, 35–47 [DOI] [PubMed] [Google Scholar]
- 21. Hirsch J., Marin E., Floriani M., Chiarenza S., Richaud P., Nussaume L., Thibaud M. C. (2006) Phosphate deficiency promotes modification of iron distribution in Arabidopsis plants. Biochimie 88, 1767–1771 [DOI] [PubMed] [Google Scholar]
- 22. Ward J. T., Lahner B., Yakubova E., Salt D. E., Raghothama K. G. (2008) The effect of iron on the primary root elongation of Arabidopsis during phosphate deficiency. Plant Physiol. 147, 1181–1191 [DOI] [PMC free article] [PubMed] [Google Scholar]
- 23. Ravet K., Reyt G., Arnaud N., Krouk G., Djouani el-B., Boucherez J., Briat J. F., Gaymard F. (2012) Iron and ROS control of the DownSTream mRNA decay pathway is essential for plant fitness. EMBO J. 31, 175–186 [DOI] [PMC free article] [PubMed] [Google Scholar]
- 24. Oropeza-Aburto A., Cruz-Ramírez A., Acevedo-Hernández G. J., Pérez-Torres C. A., Caballero-Pérez J., Herrera-Estrella L. (2012) Functional analysis of the Arabidopsis PLDZ2 promoter reveals an evolutionarily conserved low-Pi-responsive transcriptional enhancer element. J. Exp. Bot. 63, 2189–2202 [DOI] [PMC free article] [PubMed] [Google Scholar]
- 25. Misson J., Raghothama K. G., Jain A., Jouhet J., Block M. A., Bligny R., Ortet P., Creff A., Somerville S., Rolland N., Doumas P., Nacry P., Herrerra-Estrella L., Nussaume L., Thibaud M. C. (2005) A genome-wide transcriptional analysis using Arabidopsis thaliana Affymetrix gene chips determined plant responses to phosphate deprivation. Proc. Natl. Acad. Sci. U.S.A. 102, 11934–11939 [DOI] [PMC free article] [PubMed] [Google Scholar]
- 26. Ticconi C. A., Lucero R. D., Sakhonwasee S., Adamson A. W., Creff A., Nussaume L., Desnos T., Abel S. (2009) ER-resident proteins PDR2 and LPR1 mediate the developmental response of root meristems to phosphate availability. Proc. Natl. Acad. Sci. U.S.A. 106, 14174–14179 [DOI] [PMC free article] [PubMed] [Google Scholar]
- 27. Cumbus I. P., Hornsey D. J., Robinson L. W. (1977) The influence of phosphorus, zinc and manganese on absorption and translocation of iron in watercress. Plant Soil 48, 651–660 [Google Scholar]
- 28. Mathan K. K., Amberger A. (1977) Influence of iron on the uptake of phosphorous by maize. Plant Soil 48, 413–422 [Google Scholar]
- 29. Otegui M. S., Capp R., Staehelin L. A. (2002) Developing seeds of Arabidopsis store different minerals in two types of vacuoles and in the endoplasmic reticulum. Plant Cell 14, 1311–1327 [DOI] [PMC free article] [PubMed] [Google Scholar]
- 30. Lanquar V., Lelièvre F., Bolte S., Hamès C., Alcon C., Neumann D., Vansuyt G., Curie C., Schröder A., Krämer U., Barbier-Brygoo H., Thomine S. (2005) Mobilization of vacuolar iron by AtNRAMP3 and AtNRAMP4 is essential for seed germination on low iron. EMBO J. 24, 4041–4051 [DOI] [PMC free article] [PubMed] [Google Scholar]
- 31. Dekock P. C., Hall A., Inkson R. H. E. (1978) Active Iron in Plant Leaves. Ann. Bot. 43, 737–740 [Google Scholar]
- 32. Thibaud M. C., Arrighi J. F., Bayle V., Chiarenza S., Creff A., Bustos R., Paz-Ares J., Poirier Y., Nussaume L. (2010) Dissection of local and systemic transcriptional responses to phosphate starvation in Arabidopsis. Plant J. 64, 775–789 [DOI] [PubMed] [Google Scholar]
- 33. Müller R., Morant M., Jarmer H., Nilsson L., Nielsen T. H. (2007) Genome-wide analysis of the Arabidopsis leaf transcriptome reveals interaction of phosphate and sugar metabolism. Plant Physiol. 143, 156–171 [DOI] [PMC free article] [PubMed] [Google Scholar]
- 34. Wade V. J., Treffry A., Laulhère J. P., Bauminger E. R., Cleton M. I., Mann S., Briat J. F., Harrison P. M. (1993) Structure and composition of ferritin cores from pea seed (Pisum sativum). Biochim. Biophys. Acta 1161, 91–96 [DOI] [PubMed] [Google Scholar]
- 35. Pratt J., Boisson A. M., Gout E., Bligny R., Douce R., Aubert S. (2009) Phosphate (Pi) starvation effect on the cytosolic Pi concentration and Pi exchanges across the tonoplast in plant cells: an in vivo 31P-nuclear magnetic resonance study using methylphosphonate as a Pi analog. Plant Physiol. 151, 1646–1657 [DOI] [PMC free article] [PubMed] [Google Scholar]
- 36. Shikanai T., Müller-Moulé P., Munekage Y., Niyogi K. K., Pilon M. (2003) PAA1, a P-type ATPase of Arabidopsis, functions in copper transport in chloroplasts. Plant Cell 15, 1333–1346 [DOI] [PMC free article] [PubMed] [Google Scholar]
- 37. Hilton R. J., David Andros N., Watt R. K. (2012) The ferroxidase center is essential for ferritin iron loading in the presence of phosphate and minimizes side reactions that form Fe(III)-phosphate colloids. Biometals 25, 259–273 [DOI] [PubMed] [Google Scholar]
- 38. Pich A., Scholz G. (1991) Nicotianamine and the Distribution of Iron into Apoplast and Symplast of Tomato (Lycopersicon esculentum Mill.). J. Exp. Bot. 42, 1517–1523 [Google Scholar]
- 39. Rouached H., Secco D., Arpat B., Poirier Y. (2011) The transcription factor PHR1 plays a key role in the regulation of sulfate shoot-to-root flux upon phosphate starvation in Arabidopsis. BMC Plant Biol. 11, 19. [DOI] [PMC free article] [PubMed] [Google Scholar]