

Background: Branched-chain keto acid dehydrogenase kinase (BDK) deficiency reduces branched chain amino acids and causes epilepsy with autistic features.
Results: Loss of general control nonderepressible 2 (GCN2) in BDK−/− mice results in a fatal leukodystrophy.
Conclusion: GCN2 is essential for protecting glial cells during amino acid deficiency.
Significance: This study contributes novel information toward understanding the heterogeneous basis of white matter diseases.
Keywords: Amino Acid, Brain, Endoplasmic Reticulum Stress, Epilepsy, Gene Knock-out, Glia, Myelin, Translation Initiation Factors, Leukodystrophy
Abstract
Branched-chain amino acid (BCAA) catabolism is regulated by branched-chain α-keto acid dehydrogenase, an enzyme complex that is inhibited when phosphorylated by its kinase (BDK). Loss of BDK function in mice and humans causes BCAA deficiency and epilepsy with autistic features. In response to amino acid deficiency, phosphorylation of eukaryotic initiation factor 2α (eIF2∼P) by general control nonderepressible 2 (GCN2) activates the amino acid stress response. We hypothesized that GCN2 functions to protect the brain during chronic BCAA deficiency. To test this idea, we generated mice lacking both Gcn2 and Bdk (GBDK) and examined the development of progeny. GBDK mice appeared normal at birth, but they soon stopped growing, developed severe ataxia, tremor, and anorexia, and died by postnatal day 15. BCAA levels in brain were diminished in both Bdk−/− and GBDK pups. Brains from Bdk−/− pups exhibited robust eIF2∼P and amino acid stress response induction, whereas these responses were absent in GBDK mouse brains. Instead, myelin deficiency and diminished expression of myelin basic protein were noted in GBDK brains. Genetic markers of oligodendrocytes and astrocytes were also reduced in GBDK brains in association with apoptotic cell death in white matter regions of the brain. GBDK brains further demonstrated reduced Sod2 and Cat mRNA and increased Tnfα mRNA expression. The data are consistent with the idea that loss of GCN2 during BCAA deficiency compromises glial cell defenses to oxidative and inflammatory stress. We conclude that GCN2 protects the brain from developing a lethal leukodystrophy in response to amino acid deficiencies.
Introduction
In mammals, the branched-chain amino acids (BCAA)2 leucine, isoleucine, and valine are classified as nutritionally indispensable (i.e. dietary essential) amino acids. BCAA include about 40% of the indispensable amino acid intake. Leucine in particular can stimulate protein synthesis and can also regulate satiety and glucose metabolism through peripheral and central mechanisms. Given the physiological importance of the BCAA in regulating protein and energy metabolism, it is a cellular priority to maintain plasma and tissue concentrations of BCAA within a relatively narrow range. This is accomplished through a highly regulated catabolic pathway involving the branched-chain ketoacid dehydrogenase (BCKD) enzyme complex. Loss-of-function mutations in BCKD result in excess levels of BCAA that are neurotoxic, as demonstrated in maple syrup urine disease (1).
Chronically elevated BCAA oxidation is also problematic. BCKD enzyme activity is strongly inhibited by phosphorylation of its E1α subunit. This mode of regulation is physiologically important, as verified by an ∼50% decrease in plasma and tissue BCAA levels in BCKD kinase (BDK) knock-out mice (2). Bdk null (Bdk−/−) mice exhibit impaired growth and neurological symptoms that include hindlimb clasping early in life and epilepsy later in life (2). Interestingly, loss-of-function mutations in the BDK gene in humans reduce plasma BCAA and cause intellectual disability and epilepsy in consanguineous families with autism spectrum disorders (3). These reported neurological abnormalities in mice and humans indicate that properly regulated BCAA metabolism is essential for healthy brain development and function.
Mammalian cells respond to amino acid deficiencies by activating the amino acid stress response (AAR) featuring phosphorylation of the α subunit of eukaryotic initiation factor 2 (eIF2) by the protein kinase GCN2 (4). Phosphorylation of eIF2α (eIF2∼P) triggers a reduction in the guanine nucleotide exchange activity of eIF2B, stalling delivery of the initiator tRNA to the ribosome. As a consequence, general protein synthesis is repressed, lowering expenditure of nutrients and energy. Coincident with a global reduction in protein synthesis, eIF2∼P also leads to preferential translation of select mRNAs encoding transcription factors, such as activating transcription factor 4 (ATF4). ATF4 directly enhances the transcriptional expression of genes involved in the synthesis, transport, and metabolism of amino acids and boosts antioxidant defense capacity, providing cells the means to restore a healthy state (5). Studies of Gcn2 null (Gcn2−/−) mice demonstrate essential roles of the GCN2-mediated AAR in food selection, growth, and survival (6–9), hepatic lipid metabolism (10), and immune function (11, 12). Additionally, GCN2 facilitates the ability of single amino acid deprivation to mediate resistance to ischemic damage in renal and liver tissues elicited by surgical reperfusion in mice (13).
In response to enhanced BCAA catabolism in Bdk−/− mice, eIF2∼P is markedly elevated in brain but not in other tissues (2). Given the role of GCN2 in cellular protection during amino acid deficiency, we hypothesized that eIF2∼P and the AAR serve to alleviate cellular stress and potential injury caused by BCAA deprivation. Consequently, a loss of GCN2 function would be detrimental to the Bdk−/− mouse brain. To test this hypothesis, we crossed Gcn2−/− mice with those deleted for Bdk to generate GCN2-BDK double knock-out (GBDK) mice. We found that the GCN2-initiated AAR was active in the brain of Bdk−/− mice but not in GBDK mice. Although born normal in size and appearance, GBDK mice soon declined in neurological function and locomotor control, exhibiting tremor, ataxia, and a general failure to develop and thrive. In this study, we reveal the mechanism for the neurological deterioration observed in GBDK mice. These discoveries reflect the essential role of GCN2 to protect the cell types and processes necessary for postnatal myelin formation and brain development. The genetic mouse model and cellular pathways described herein contributes novel information toward understanding the heterogeneous mechanisms responsible for leukodystrophy and other white matter diseases.
EXPERIMENTAL PROCEDURES
Animals
The following study protocol was approved by the Institutional Care and Use Committees at the Indiana University School of Medicine-Evansville and at Rutgers, State University of New Jersey. Mice were housed in plastic shoebox cages with soft bedding and provided social enrichment. Mice were given unrestricted access to standard commercial rodent food (7017 NIH-31 Open Formula Mouse/Rat Sterilizable diet, Harlan Teklad) and tap water and maintained on a 12 h light/dark cycle. To generate GBDK mice, Gcn2−/− female mice were mated with Bdk−/− male mice (both on C57BL/6J genetic background for at least eight generations), generating Gcn2+/−·Bdk+/− offspring. These offspring were brother-sister-mated, and progeny expressing Gcn2−/−·Bdk+/− were again brother-sister-mated to generate litters containing GBDK pups. In addition, Gcn2+/+·Bdk+/− males and females were mated to produce Gcn2+/+·Bdk+/+ wild type (WT) mice and Gcn2+/+·Bdk−/− (Bdk−/−) mice. Blood samples were collected after decapitation, and whole brains were quickly removed and snap-frozen in liquid nitrogen.
Whole Blood Measurements
Blood glucose was measured using the CardioChekTM system (Polymer Technology Systems, Inc., Indianapolis, IN). Hematocrit was determined by collecting whole blood in a capillary tube and calculating the percentage of packed red blood cell volume following centrifugation.
Amino Acid Analyses
Whole pups at postnatal day (P) 1 and 7 were euthanized, and the gastrointestinal tract of pups at P1 and P7 were removed. Pups were snap-frozen and ground to a fine powder with a mortar and pestle under liquid nitrogen. Frozen powder was weighed and extracted with 3 volumes of 6% (w/v) perchloric acid for deproteinization. Precipitated proteins were removed by centrifugation, and the supernatants were neutralized with 20% potassium hydroxide. Concentrations of BCAA and total amino acids in whole body were measured using high performance liquid chromatography (HPLC) as described previously (14). Concentrations of amino acids in whole brain were analyzed by Kristine C. Olson under the supervision of Dr. Christopher J. Lynch (15). Free amino acids were pre-column-derivatized using Phenomenex EZ-fast reagent and analyzed by ultra performance liquid chromatography-MS using a Waters Synapt HDMS hybrid quantitative TOF with ion mobility, located at the Pennsylvania State College of Medicine Macromolecular Core Facility.
Immunoblot Analysis
Tissues were processed for SDS-PAGE and immunoblotting as described previously (6, 16). Primary antibody for eIF2α phosphorylated at serine 51 was purchased from Cell Signaling Technology (Beverly, MA). Antibody for total eIF2α was purchased from Santa Cruz Biotechnology. Eukaryotic initiation factor 4E-binding protein 1 (4E-BP1) antibody was obtained from Bethyl Laboratories, and myelin basic protein antibody was from Millipore (Billerica, MA). Polyclonal antibodies against the E1α and E2 subunits of the BCKD complex were prepared in the Harris laboratory (2). Secondary antibodies were purchased from Jackson ImmunoResearch (West Grove, PA). Protein expression was visualized using enhanced chemiluminescence reagents (ECL; GE Healthcare) and analyzed using a Carestream 4000MM or Gel Logic 6000 image station and molecular imaging software (Carestream Health, Rochester, NY).
Reverse Transcription and Real Time PCR
Total RNA was extracted from frozen tissue as described previously using TriReagent (Molecular Research Center, Inc., Cincinnati, OH) (17), and 1 μg of RNA per sample was used for reverse transcription (RT) using the high capacity cDNA reverse transcription kit (Applied Biosystems, Foster City, CA) according to the manufacturer's instructions. TaqMan Gene Expression Master Mix and TaqMan Gene Expression Assays (Applied Biosystems) were used for quantitative PCR. Amplification and detection were performed using the StepOnePlus real time PCR System (Applied Biosystems). All measurements were performed in triplicate and normalized to 18 S ribosomal RNA. Results were obtained by the comparative Ct method, and results were expressed as fold change with respect to the experimental control.
Histology
To stain myelinated axons, whole brains fixed in 4% paraformaldehyde were bisected at the mid-sagittal plane and incubated in a clear glass vial at 37 °C for 2 h in 10 ml of a 0.2% gold chloride solution (per liter: 1.8 g of crystalline gold chloride, 0.33 g of sodium phosphate monobasic monohydrate, 3.6 g of sodium phosphate dibasic anhydrous, 9.0 g of sodium chloride) as reported previously (18, 19). Stained material was then transferred to 20 ml of 2.5% sodium thiosulfate anhydrous for 5 min before storage in fresh 4% paraformaldehyde kept in the dark. Additional cuts were made in the coronal plane and re-stained, as well as tissues sections in both the sagittal and coronal planes. Frozen sections (16 μm) were obtained from whole and half-brains fixed in 4% paraformaldehyde using a cryostat. TUNEL assays were performed on frozen sections using a TACS-XL® in situ apoptosis detection kit (R&D Systems, Minneapolis, MN) as described previously (11).
Statistics
Data were analyzed using two-way analysis of variance (StatSoft, Tulsa, OK) to assess main effects, with GCN2 and BDK as independent variables in some instances and genotype and time as independent variables in other situations. In cases where a two-way analysis of variance was not possible, a one-way analysis of variance was performed with genotype as the independent variable. When a significant overall effect was detected, differences among treatment groups were assessed with LSD's post hoc test. The level of significance was set at p < 0.05 for all statistical tests.
RESULTS
GBDK Mice Display Neurological Abnormalities and Early Death
To understand the physiological importance of GCN2-directed eIF2∼P in the brains of Bdk−/− mice, we bred Bdk−/− mice to Gcn2−/− mice so as to create a GBDK double homozygous null strain. Genotype analysis of newborn offspring from Gcn2−/−·Bdk+/− breeders showed the targeted alleles were present in the expected Mendelian frequency. Of the 116 1-day-old pups generated from Gcn2−/−·Bdk+/− cross, 32, 56, and 28 were Gcn2−/−·Bdk+/+, Gcn2−/−·Bdk+/−, and Gcn2−/−·Bdk−/− pups, respectively. However, no Gcn2−/−·Bdk−/− offspring were found in litters weaned at postnatal day (P) 28, suggesting early postnatal death of GBDK pups. The GBDK phenotype was monitored from birth until natural death by recording general appearance and behavior as well as measuring body weight. GBDK null pups were indistinguishable from littermates at birth. Some newborn GBDK pups died within 72 h after birth; these losses were usually attributed to maternal neglect of the whole litter. GBDK pups surviving the first few days of life later displayed light coat color, frequent shaking/tremors, splayed limbs, and social isolation. As shown in supplemental Movie 1, GBDK pups at P10 had difficulty maintaining normal gait and posture, displaying ataxia, tremors, and splayed limbs. By P11–14, as a consequence of progressive seizure activity, immobility, and weakness, the GBDK pups experienced natural death. No GBDK pups survived past P15. In contrast, heterozygous Gcn2−/−·Bdk+/− mice were indistinguishable from Gcn2−/−·Bdk+/+ mice and showed similar behavior, body, and organ weights and blood glucose levels (Fig. 1).
FIGURE 1.
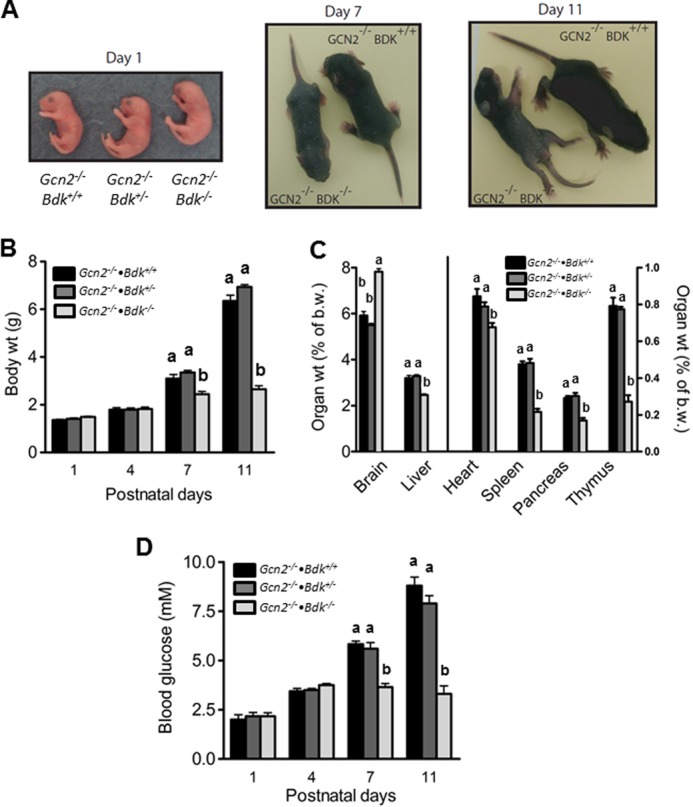
GBDK mice exhibit neurological abnormalities, growth deficiencies, and hypoglycemia 1–2 weeks after birth. A, images of Gcn2−/−·DK+/+, Gcn2−/−·Bdk+/−, and GBDK littermates at postnatal days 1, 7, and 11. Body weights (B), organ weights (C), and blood glucose concentrations (D) in Gcn2−/−·Bdk+/+, Gcn2−/−·Bdk+/−, and Gcn2−/−·Bdk−/− pups at postnatal days 1, 4, 7, and 11 are shown. Bars represent means ± S.E.; n = 6–9 per group. Means without a common letter differ, p < 0.05.
Impaired Growth, Decreased Food Intake, and Hypoglycemia in GBDK Mice
GBDK pups had normal body weight at birth and at P4 (Fig. 1, A and B). However, the body weight of GBDK was 22 and 58% lower by P7 and P11, respectively, compared with Gcn2−/−·Bdk+/+ pups, indicating severely impaired growth (Fig. 1B). All GBDK organ weights at P11 were significantly reduced in size except for brain, which was increased as compared with Gcn2−/−·Bdk+/+ pups (Fig. 1C). However, this increase reflected a wasted condition, as the absolute brain weight of GBDK pups was ∼50% lower than Gcn2−/−·Bdk+/+ controls (data not shown).
The decreased body weight of the GBDK pups led us to investigate food intake. All pups had comparable amounts of milk in their stomachs at P4; however, all GBDK pups had empty stomachs at P11–14. Even at P7–8, some GBDK pups had little to no milk in their stomachs. Consistent with decreased body weight and food intake, GBDK mice were hypoglycemic at P7 and P11 (Fig. 1D). Blood glucose concentrations were decreased 63 and 75%, respectively, whereas glucose levels did not differ from Gcn2−/−·Bdk+/+ pups at P1 and P4. Hepatic phosphoenolpyruvate carboxykinase mRNA abundance at P11 was increased 4-fold in GBDK mice compared with Gcn2−/−·Bdk+/+ mice (data not shown), suggesting that hypoglycemia was not caused by reduced gluconeogenic capacity. Blood glucose concentrations in pre-fed and fed pups at P1 did not differ between GBDK and Gcn2−/−·Bdk+/+ mice, although blood glucose was ∼40% lower in pre-fed than fed pups at P1 regardless of genotype (data not shown). These data suggest that the GBDK pups gradually decreased food intake as they began to exhibit severe neurological deficits.
Brain Concentrations of Amino Acids Are Significantly Altered in BDK−/− and GBDK Mice
First, to confirm Bdk deletion in GBDK pups, we used Western blot to measure BCKD E1α and E2 protein and phosphorylation state in the brain (Fig. 3A). Previous investigations showed that the electrophoretic mobility of E1α is reduced when phosphorylated (20, 21), and electrophoretic migration of the E1α subunit is significantly faster in Bdk−/− mice (2). Consistent with these reports, brain samples from GBDK and Bdk−/− mice showed reduced phosphorylation of E1α, suggesting elevated BCKD activity and increased BCAA catabolism. To determine how the combined loss of Gcn2 and Bdk affected amino acid concentrations, whole body BCAA and total amino acid levels were measured at P1 and P7. At P1, whole body BCAA levels in GBDK and Gcn2−/−·Bdk+/− pups were decreased by 50 and 39%, respectively, indicating that BDK-regulated BCAA catabolism occurs at a very early age (Fig. 2A). At P7, whole body BCAA levels in GBDK mice remained 37% lower than Gcn2−/−·Bdk+/+ mice, whereas BCAA levels in Gcn2−/−·Bdk+/− and Gcn2−/−·Bdk+/+ mice were similar. Total amino acids did not differ among the three mutant strains at either P1 or P7 (Fig. 2B).
FIGURE 3.

GCN2 is required for activation of the amino acid stress response in the brains of Bdk−/− mice at postnatal days 11–14. A, protein expression and phosphorylation state of the BCKD subunits E2 and E1α in brain lysates of WT, Gcn2−/−, Bdk−/−, and GBDK mice. Note that phosphorylation (P) of E1α retards its electrophoretic mobility. B, phosphorylation of eIF2α subunit at serine 51 in brain lysates of WT, Gcn2−/−, Bdk−/−, and GBDK mice. C, gene expression of Atf4, Atf5, Chop, 4ebp1, and BiP/GRP78 mRNA in brain lysates of WT, Gcn2−/−, Bdk−/−, and GBDK mice. D, 4E-BP1 protein expression (upper panel) and phosphorylation (lower panel) in brain lysates of WT, Gcn2−/−, Bdk−/−, and GBDK mice. E, mRNA expression of Slc7a5, Slc3a2 (Lat1), and Slc7a1/Cat1 in brain lysates of WT, Gcn2−/−, Bdk−/−, and GBDK mice. Bars represent means ± S.E.; n = 4–8 per group. Means without a common letter differ, p < 0.05.
FIGURE 2.

GBDK mice exhibit diminished whole body BCAA concentrations at 1 and 7 days of age. Whole body BCAA (A) and total amino acid concentrations (B) in Gcn2−/−·Bdk+/+, Gcn2−/−·Bdk+/−, and Gcn2−/−·Bdk−/− littermates at postnatal days 1 and 7 are shown. Bars represent means ± S.E.; n = 6–9 per group. Means without a common letter differ, p < 0.05.
Next, whole brain amino acids were measured in GBDK, Bdk−/−, Gcn2−/−, and WT mice at P6 (Table 1). This day was chosen to avoid the effect of decreased food intake observed after P7 in GBDK pups. The sum of brain leucine, isoleucine, and valine did not differ between Gcn2−/− and WT mice. By comparison, BCAA concentrations in Bdk−/− and GBDK brains were lowered ∼50–80%, consistent with an ∼70% decrease reported in adult mice (2) and an ∼50% decrease reported in P14 pups (3). Also consistent with previous work, most amino acids were significantly elevated 2-fold or more in Bdk−/− brains, with glycine showing a nearly 5-fold elevation as compared with WT. Surprisingly, nearly all amino acid increases identified in Bdk−/− brains were not present in GBDK brains. Except for aspartate, BCAA, and phenylalanine, all amino acid concentrations in GBDK were statistically similar to WT.
TABLE 1.
Whole brain amino acid concentrations (nmol/g tissue) in pups on postnatal day 6
Data are expressed as means ± S.E., n = 5 per group. Means in a row without a common letter differ, p < 0.05.
| WT | Bdk−/− | Gcn2−/− | GBDK | |
|---|---|---|---|---|
| Leucine | 46.0 ± 6.5a | 7.8 ± 0.9c | 31.8 ± 4.4ab | 20.7 ± 7.1bc |
| Isoleucine | 24.8 ± 4.3a | 4.6 ± 1.0c | 18.6 ± 2.9ab | 11.2 ± 5.7bc |
| Valine | 40.7 ± 2.3a | 10.6 ± 2.5b | 42.7 ± 6.8a | 20.6 ± 5.5b |
| Threonine | 153.7 ± 7.6b | 487.5 ± 44a | 171.0 ± 14.3b | 176.1 ± 5.8b |
| Phenylalanine | 27.7 ± 5.6b | 29.0 ± 6.9ab | 15.5 ± 3.2b | 52.6 ± 12.9a |
| Tyrosine | 38.6 ± 8.6b | 128.7 ± 13.3a | 42.0 ± 4.4b | 61.7 ± 14.4b |
| Histidine | 55.0 ± 3.0b | 107.1 ± 9.8a | 56.3 ± 3.3b | 62.9 ± 11.2b |
| Methionine | 39.3 ± 8.8b | 60.0 ± 4.7a | 37.0 ± 4.1b | 44.1 ± 9.4b |
| Serine | 544.5 ± 19.4b | 954.5 ± 62.1a | 611.3 ± 73.8b | 481.3 ± 102.7b |
| Glycine | 569.2 ± 37.2b | 2628.4 ± 234.1a | 672.6 ± 52.8b | 490.4 ± 61.7b |
| Lysine | 128.2 ± 10.6a | 130.2 ± 9.5a | 70 ± 14.8b | 114.4 ± 19.8a |
| Ornithine | 13.8 ± 0.4b | 24.8 ± 1.7a | 12.4 ± 2.0b | 11.6 ± 1.6ab |
| Arginine | 33.5 ± 1.9b | 93.9 ± 7.8a | 27.2 ± 3.4b | 47.6 ± 12.1b |
| Glutamine | 1139.4 ± 86.5b | 2447.9 ± 400.5a | 1238 ± 167.7b | 1699 ± 327.5ab |
| Glutamate | 1564.6 ± 166.2 | 1167.8 ± 66.7 | 1317.9 ± 169.1 | 1384.1 ± 288.2 |
| Proline | 193.2 ± 7.2bc | 427.1 ± 35.6a | 241.5 ± 11.4b | 142.8 ± 28.9c |
| Alanine | 264.8 ± 12.8b | 490 ± 52.4a | 257.8 ± 23.6b | 170.4 ± 49.4b |
| Aspartate | 557.5 ± 38.6b | 657.9 ± 34.3ab | 556.2 ± 71.8b | 906.2 ± 149.6a |
| Asparagine | 41.1 ± 5.7b | 96.0 ± 20.6a | 36.1 ± 9.3b | 21.6 ± 7.1b |
| Tryptophan | 12.6 ± 2.8 | 21.2 ± 3.0 | 12.1 ± 1.6 | 30.2 ± 11.7 |
| 4-Hydroxyproline | 60.8 ± 8.2b | 157.4 ± 9.8a | 61.4 ± 11.1b | 64.3 ± 21.2b |
| Citrulline | 22.3 ± 3.7b | 70.4 ± 9.7a | 22.9 ± 3.4b | 34.2 ± 7.2b |
| Cystathionine | 22.8 ± 1.0b | 57.9 ± 3.4a | 23.7 ± 1.4b | 31.0 ± 5.1b |
AAR Is Activated in the Brains of Bdk−/− but Not GBDK Mice
Activation of GCN2 and the AAR up-regulates genes involved in amino acid synthesis, metabolism, and transport (5, 22). As such, we hypothesized that the differences in brain amino acid concentrations between Bdk−/− and GBDK mice were due to a differentially activated AAR.
To assess this, eIF2∼P was measured. As expected, eIF2∼P was increased in the brain of Bdk−/− mice as compared with WT controls (Fig. 3B). However, eIF2∼P was not increased in the brains of GBDK mice, despite diminished BCAA levels. We next measured mRNA expression of several downstream targets of the GCN2-directed AAR pathway in whole brain lysates (Fig. 3C). As we and others have detailed previously (22, 23), eIF2∼P promotes gene-specific translation of ATF4, which serves as a transcriptional activator of itself and many other genes, including ATF5, asparagine synthetase, and CAAT enhancer-binding protein homologous protein (CHOP). Consistent with this, mRNA abundance of Atf4, Atf5, Asns, and Chop were increased in the brains of Bdk−/− mice over 2-fold as compared with WT. In contrast, mRNA expression of Atf4, Atf5, Asns, and Chop in the brains of Gcn2−/− and GBDK mice were reduced ∼50% as compared with WT. In addition, gene expression of the ER chaperone BiP/GRP78, a marker of ER stress, was not increased in Bdk−/− mice and was further decreased in GBDK mice (Fig. 3C).
Amino acid deficiency reduces phosphorylation of the translational repressor eIF4E-binding protein 1 (4E-BP1), stalling translation initiation. ATF4 expression induces 4E-BP1 transcription in beta cells during ER stress (24). Increased 4E-BP1 expression alongside 4E-BP1 hypophosphorylation can serve to maximally inhibit mRNA translation. By contrast, hyperphosphorylation of 4E-BP1 liberates it from eIF4E and thereby facilitates binding of eIF4E with eIF4G, leading to cap-dependent translation initiation of many mRNAs. In the brains of Bdk−/− mice, 4ebp1 mRNA and protein expression were increased together (Fig. 3, C and D, upper panel) alongside reduced 4E-BP1 phosphorylation (Fig. 3D, lower panel). Importantly, these outcomes were abolished in the brains of GBDK mice suggesting that 4E-BP1 activity is enhanced by GCN2 and the AAR.
Amino acids, including BCAA, are competitively transported across the blood-brain barrier by Slc7a5/Slc3a2 (LAT1) and, to a lesser extent, by members of the y+-type family and the Na+-dependent large neutral amino acid transporter (25). Given the marked alterations in brain amino acid concentrations in both Bdk−/− and GBDK mice, and the knowledge that amino acid transporters such as Slc7a1 are known targets of ATF4 (26), we next measured mRNA expression of the heterodimeric Slc7a5/Slc3a2 (Lat1), the major L-system transporter, and Slc7a1 (Cat1), a major y+-system transporter in brain lysates (Fig. 3E). Whereas Slc3a2 mRNA abundance was similar across genetic strains of mice, the levels of Slc7a5 and Slc7a1 encoding transcripts increased ∼30 and ∼70%, respectively, in Bdk−/− brain lysates as compared with WT. In contrast, mRNA expression of Slc7a1 and Slc7a5 did not increase in the brain of GBDK mice and remained similar to WT mice. These data are consistent with the idea that activation of the AAR by GCN2 promotes increased flux of AA into the brain of Bdk−/− mice.
Hypomyelination in Brains of GBDK Mice
Brains of GBDK mice collected at postnatal days P1, 4, 8, and 11 were examined and found to be lighter, softer, and more fragile at P8 and P11 as compared with littermates. These macroscopic traits are reported in white matter disorders such as vanishing white matter disease/childhood ataxia with central nervous system hypomyelination (VWMD/CACH) syndrome. This syndrome is caused by missense mutations in the genes encoding the subunits of eIF2B that reduce exchange of eIF2-GDP to eIF2-GTP in eIF2 (27, 28). In fact, a number of fatal hypomyelinating conditions exhibit neurological symptoms of seizures, action tremor, spasticity, weakness, and cerebellar ataxia similar to GBDK mice. We thus used a specific histological staining method to qualitatively examine myelin in whole brains. Frozen sections of brain were stained in both the coronal and sagittal planes with gold chloride to visualize myelin as described previously (18, 19). We first performed en bloc staining of bisected brains, which revealed less myelin in sagittal hemispheres of brains of GBDK mice (Fig. 4A). Brains from Gcn2−/− pups were more darkly stained with gold chloride than GBDK at postnatal day 11, especially the corpus callosum and hippocampal formation, regions of abundant white matter. Moreover, structural differences were noted in that the cerebellum and hippocampus in GBDK brains were proportionately smaller as compared with Gcn2−/− mice, consistent with decreased myelination and ataxia exhibited in these mice. We further examined coronal frozen brain sections stained with gold chloride under light microscopy (Fig. 4B). In the brains of Gcn2−/− mice, many dark filament-like structures were seen; under higher magnification, there were both darkly stained large myelinated bundles and fine individually myelinated fibers in corpus callosum and hippocampal formation. However, in GBDK brains, these myelinated structures were less abundant and stained markedly lighter.
FIGURE 4.

GBDK mice demonstrate hypomyelination in white matter regions of the brain. A, representative gold chloride staining of bisected sagittal hemispheres of brains imaged using a dissecting microscope set to ×1 magnification. B, representative coronal sections taken rostral to bregma using a dissecting microscope set to ×2 magnification. Higher magnification (×200) under a light microscope revealed the presence of myelin fibers in the corpus callosum and hippocampal formation. Images are representative of three mice per genotype at postnatal days 11–14.
GBDK Mice Display Reduced Oligodendrocyte Development and Survival
Myelin is synthesized by oligodendrocytes, which originate from migratory and mitotic precursors that mature progressively into postmitotic myelin-producing cells (29). We measured expression of molecular markers of oligodendrocyte precursors and maturation to evaluate oligodendrocyte development in the brains of the WT and mutant mice (Fig. 5A). The basic helix-loop-helix transcription factors Olig1/2 play a crucial role in oligodendrocyte differentiation and myelination as well as remyelination (30–32). The abundance of Olig2 mRNA, a marker of oligodendrocyte precursor cells, was moderately decreased in Bdk−/− brains and further decreased in GBDK brains as compared with WT. By contrast, the abundance of platelet-derived growth factor receptor α (Pdgfrα) mRNA, whose gene product reportedly drives oligodendrocyte precursor cell division (33), was unaltered. Genetic markers of mature, myelinating oligodendrocytes were then examined. Transcript levels of the two major myelin proteins, myelin basic protein (Mbp) and proteolipid protein (Plp1), as well as mRNAs encoding for myelin oligodendrocyte glycoprotein (Mog) were significantly decreased in brains of GBDK mice. Transcript levels of these markers in the brains of Bdk−/− and Gcn2−/− mice were similar to WT mice.
FIGURE 5.

GBDK brains show diminished expression of oligodendrocytes alongside reduced myelin basic protein. A, mRNA expression of genes activated during oligodendrocyte development (Olig2, Pdgfrα) and maturation (Mbp, Plp1, Mog) as well as markers of neurons (Nevrod6) and astrocytes (Gfap, Aqp4) in WT, Gcn2−/−, Bdk−/−, and GBDK mice at postnatal days 11–14. B, immunoblot analysis of MBP in WT, Gcn2−/−, Bdk−/−, and GBDK brain lysates at postnatal days 11–14. Actin was used as an endogenous loading control. C, immunoblot analysis of MBP in Gcn2−/−·Bdk+/+, Gcn2−/−·Bdk+/−, and Gcn2−/−·Bdk−/− brain lysates at postnatal days 3, 8, and 11–14. Two-way analysis of variance showed a significant effect of age, genotype and age × genotype interaction (p < 0.001). Bars represent means ± S.E.; n = 4–10 per group. Means without a common letter differ, p < 0.05.
Consistent with decreased MBP mRNA expression, MBP protein content in brain was markedly diminished in GBDK mice as compared with Bdk−/− and Gcn2−/− mice (Fig. 5B). Further investigation of the developmental regulation of MBP protein levels in brains of mice showed that MBP protein was difficult to detect before P8, but MBP was robustly expressed at P11–14 (Fig. 5C). In contrast, expression of MBP protein was barely detectable in GBDK brains at P11–14. Together, these results suggest that GBDK mice suffered defective development of the myelin sheath in association with less oligodendrocyte populations.
To determine whether neurons or other glial cell types were also impacted with loss of Bdk and Gcn2, we measured gene expression of Nevrod6 (marker of neurons) as well as Gfap and Aqp4 (markers of astrocytes) (Fig. 5A). Messenger RNA levels of both Gfap and Nevrod6 were similar among WT, Gcn2−/−, Bdk−/−, and GBDK brains, whereas the amounts of Aqp4 transcripts were reduced ∼40% in GBDK as compared with WT brains. Thus, in the absence of GCN2, severe BCAA deficiency was detrimental to the development of myelin in association with an apparent loss of glial cells and especially mature oligodendrocytes.
Diminished Oxidative Defense in Combination with Neuroinflammation Are Associated with Increased Apoptosis in GBDK Brains
To assess if the defect in myelin formation was due to a decrease in the survival of developing oligodendrocytes, tissue sections were stained for the presence of apoptosis via TUNEL assay. The presence of pyknotic nuclei was identified in regions containing white matter in GBDK brains (Fig. 6A). Although the full range of cell types undergoing apoptosis remains to be identified, the supporting data are consistent with the idea that glial cells and especially the oligodendrocyte populations are undergoing premature cell death in response to loss of GCN2 during BCAA deficiency.
FIGURE 6.
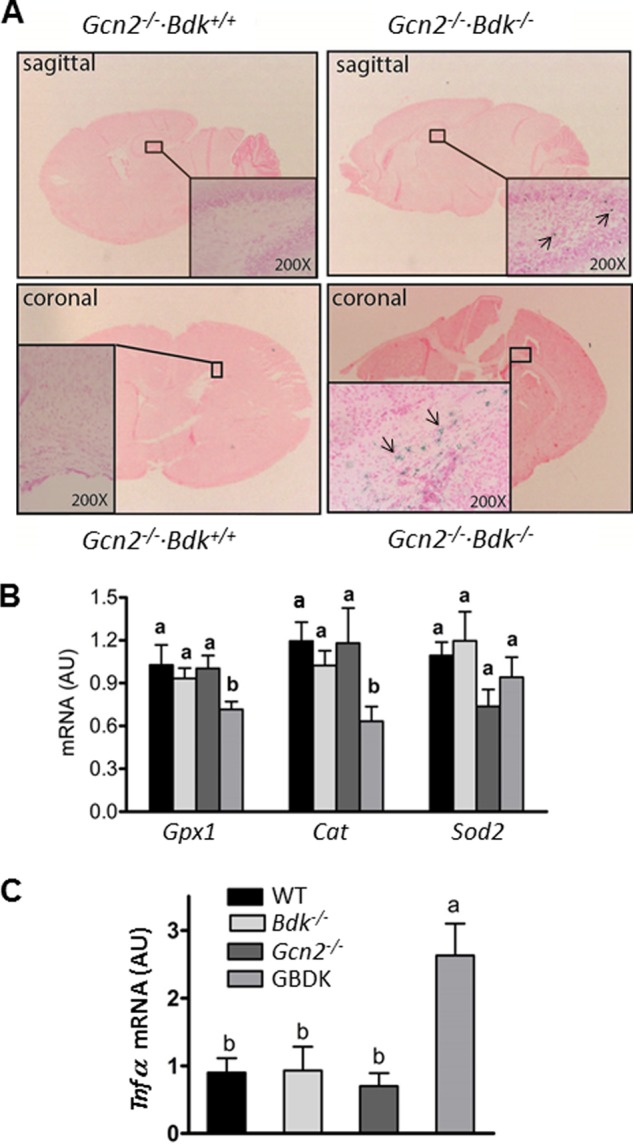
GBDK brains exhibit apoptotic nuclei in the hippocampus in association with diminished oxidative defense and increased inflammation. A, frozen brains were sectioned in both the sagittal and coronal planes to assess DNA fragmentation by TUNEL assay. Apoptotic nuclei (indicated by arrows pointing to blue-stained cells in highlighted boxes) were identified in the hippocampus of GBDK but not WT brains at ×200 magnification. Results represent three mice per genotype at postnatal days 11–14. B, SOD2 and catalase mRNA levels are reduced in GBDK brain lysates. C, increased Tnfα mRNA expression in GBDK brain lysates. Bars represent means ± S.E.; n = 4–8 per group. Means without a common letter differ, p < 0.05.
Because of the complex differentiation program as well as their unique metabolism, oligodendrocytes are among the most vulnerable cells of the central nervous system (34). Oligodendrocyte precursors are more susceptible to oxidative stress than other glial cell types (35). Cytokines produced by glial cells also significantly impact oligodendrocyte function and are linked to inflammatory white matter disorders (36). To begin to elucidate the mechanisms underlying the premature death of oligodendrocytes, we measured mRNA expression of key genes involved in antioxidant defense and inflammatory stress. First, mRNA expression of superoxide dismutase 2 (Sod2) and catalase (Cat) in the brain of GBDK mice was reduced 40–50% as compared with WT (Fig. 6B), suggesting that antioxidant defenses were compromised. Second, whereas whole brain mRNA expression of inflammatory cytokines Il6 and Il1β were low in WT and mutant mice (data not shown), there was an ∼3-fold increase in mRNA encoding Tnfα in the brain of GBDK mice as compared with WT (Fig. 6C). Collectively, these results are consistent with the idea that during chronic BCAA deficiency the loss of GCN2 predisposes the neonatal glia toward injury by oxidative and inflammatory stress.
DISCUSSION
Loss-of-function defects in the BDK gene result in epilepsy in humans and mice and incite neurological features identified in autism-spectrum disorders (2, 3). These clinical observations alongside the reported increase in eIF2∼P in the brains of Bdk−/− mice (2) prompted us to address the role of GCN2 in the protection of neurological functions during BCAA deficiency. To this end, we generated mice deficient in Bdk and Gcn2 and discovered a lethal outcome involving the interruption of myelin formation alongside symptoms and pathology reminiscent of white matter disease. The leukodystrophy identified correlated with evidence suggesting oxidative and/or inflammatory injury of oligodendrocytes and other glial cell types. Collectively, our results suggest that the GCN2-AAR functions to prevent or minimize white matter injury during amino acid stress.
Gcn2−/− mice fed a standard chow diet have a normal phenotype. In contrast, Bdk−/− mice fed chow exhibit growth retardation and neurological abnormalities that include hindlimb flexion throughout life and epileptic seizures after 5 months of age (2). Although the growth defect and neurological symptoms in Bdk−/− mice are reversible by feeding a high protein diet or dietary supplementation of BCAA (2, 3), attempts to provide GBDK pups BCAA supplements did not increase survivability.3 Indeed, compared with Bdk−/− mice, GBDK mice are much more neurologically impaired, developing a severely maladaptive phenotype that culminates in death by 15 days of age.
Various inborn errors of metabolism cause white-matter disease, i.e. leukodystrophies (37). Defects in genes encoding the five subunits of the guanine nucleotide exchange factor eIF2B also result in a spectrum of white matter diseases and other neuropathies (38). Many of these diseases associate with ER stress and activation of the unfolded protein response (27, 28). From this vantage point, the GBDK mouse is both clinically important and mechanistically unique. With respect to the former, the pathology described contributes importantly to a growing list of white matter diseases linked to defects in the translation initiation machinery. With respect to the latter, activation of the GCN2-mediated AAR but not ER stress in the Bdk−/− brain emphasizes the importance of regulating eIF2∼P during postnatal brain development. Furthermore, based on our current data, we argue that brain trauma and stress without eIF2∼P produces greater brain injury and that activation of eIF2∼P in the brain by GCN2 is inherently cytoprotective.
The process of myelination in the central nervous system is carried out by the mature oligodendrocytes. In the mouse brain, myelination is achieved in almost all regions by around 45–60 days after birth. The timing of CNS myelination is characterized by precise regulation of oligodendrocyte differentiation and proliferation (29). Preceding myelination, myelin-specific genes are activated, and mature nonmyelinating oligodendrocytes express Mbp, Plp, and Mog (29). Hypomyelination is found in the Plp null (“jimpy”) mouse and Mbp null (“shiverer”) mouse as well as the “Taiep” (an acronym for trembling, ataxia, immobility episodes, epilepsy, and paralysis) rat (39–41). These rodent models all exhibit neurological symptoms resembling the GBDK mice, in agreement with markedly decreased protein and mRNA levels of Plp1 and Mbp. Myelinating mature oligodendrocytes develop from progenitors that display characteristic genetic markers at each developmental stage. Among the earliest markers to be expressed is Pdgfrα mRNA, which in this study was found unaltered in GBDK brains. In contrast, the level of Olig2 mRNA, a marker highly expressed in proliferating immature oligodendrocytes, was significantly reduced in expression in GBDK mice. These findings, in combination with reduced Mbp, Plp1, and Mog mRNAs, suggest that the developing oligodendrocyte progenitors are the cell populations most affected in GBDK brains.
Oligodendrocyte progenitor cells are extremely susceptible to oxidative stress, and oxidative defense genes such Sod2 and Gpx1 confer protection against oxidative injury in developing oligodendrocytes (42, 43). In this study, mRNAs encoding brain SOD2 and catalase were decreased in GBDK mice, consistent with reports suggesting that GCN2 and eIF2∼P are redox regulators protecting against oxidative stress (5, 44, 45). Oxidative stress and pro-inflammatory cytokines are found to contribute to demyelination and axonal damage in cultured cerebellar cells and promote oligodendrocyte progenitor cell death in microglia treated with LPS (46, 47). It is also reported that microglia and astrocytes produce and secrete TNFα, inhibiting the survival and differentiation of oligodendrocyte precursor cells (48, 49). Consistent with these reports, a marked increase in Tnfα mRNA level was detected in GBDK brains, suggesting a pro-inflammatory environment. Although the mechanistic details underlying increased TNFα in GBDK brains remain to be revealed, our data are consistent with the idea that increased oxidative and inflammatory stress contribute to the loss of oligodendrocytes in GBDK mice.
In agreement with previous reports (2, 3), Bdk−/− brain lysates demonstrated 2–5-fold increases in most amino acids alongside profound reductions in BCAA concentrations. Interestingly, although brain BCAA concentrations remained significantly reduced in GBDK mice, concentrations of most other amino acids returned to values similar to WT mice (Table 1). Although the reasons for the elevation in amino acids in Bdk−/− brain and the reversal of brain amino acid levels in GBDK mice are unclear, speculation is offered. The simplest unifying explanation is that activation of the GCN2-AAR up-regulates genes involved in amino acid synthesis, metabolism, and transport, resulting in a net increased flux of amino acids into the brain. Supporting this idea, Slc7a1 mRNA abundance was elevated in Bdk−/− brain in a GCN2-dependent fashion (Fig. 3E). However, mRNA expression of Slc7a5 and Slc3a2 was not influenced by GCN2 status. Thus, future studies are needed to clarify the contribution of AAR activation to amino acid metabolism and neurotransmitter signaling in the brain during nutrient stress.
Glutamate, the most abundant excitatory neurotransmitter in the mammalian brain, is an antimitotic signal at all proliferative stages of the oligodendrocyte lineage (50, 51). It is proposed that glutamate concentrations in astrocytes and neurons are in part regulated through a leucine-glutamate cycle (52). In this study, brain glutamate concentrations were unaltered in both Bdk−/− and GBDK mice. Considering that tissue lysates cannot reveal dynamic changes in cellular flux within or between cell types, future studies are needed to determine the relationship between AAR activation and the flux of neurotransmitters such as glutamate.
Acknowledgments
We thank Emily Mirek for technical assistance and Drs. Malcolm Watford and Gabriel Wilson for helpful discussions during manuscript preparation.
This work was supported, in whole or in part, by National Institutes of Health Grants HD070487 (to T. G. A.) and GM049164 (to R. C. W.). This work was also supported by a Veterans Affairs merit award (to R. A. H.).

This article contains supplemental Movie 1.
T. G. Anthony, unpublished observations.
- BCAA
- branched-chain amino acid
- GCN2
- general control nonderepressible 2 kinase
- eIF2∼P
- phosphorylation of eukaryotic initiation factor 2
- BDK
- branched-chain α-keto acid dehydrogenase kinase
- GBDK
- GCN2 and BDK double knockout
- ATF4
- activating transcription factor 4
- BCKD
- branched-chain ketoacid dehydrogenase
- CHOP
- C/EBPb homologous protein
- MBP
- myelin basic protein
- AAR
- amino acid stress response
- P
- postnatal day
- ER
- endoplasmic reticulum.
REFERENCES
- 1. Harris R. A., Zhang B., Goodwin G. W., Kuntz M. J., Shimomura Y., Rougraff P., Dexter P., Zhao Y., Gibson R., Crabb D. W. (1990) Regulation of the branched-chain α-ketoacid dehydrogenase and elucidation of a molecular basis for maple syrup urine disease. Adv. Enzyme Regul. 30, 245–263 [DOI] [PubMed] [Google Scholar]
- 2. Joshi M. A., Jeoung N. H., Obayashi M., Hattab E. M., Brocken E. G., Liechty E. A., Kubek M. J., Vattem K. M., Wek R. C., Harris R. A. (2006) Impaired growth and neurological abnormalities in branched-chain α-keto acid dehydrogenase kinase-deficient mice. Biochem. J. 400, 153–162 [DOI] [PMC free article] [PubMed] [Google Scholar]
- 3. Novarino G., El-Fishawy P., Kayserili H., Meguid N. A., Scott E. M., Schroth J., Silhavy J. L., Kara M., Khalil R. O., Ben-Omran T., Ercan-Sencicek A. G., Hashish A. F., Sanders S. J., Gupta A. R., Hashem H. S., Matern D., Gabriel S., Sweetman L., Rahimi Y., Harris R. A., State M. W., Gleeson J. G. (2012) Mutations in BCKD-kinase lead to a potentially treatable form of autism with epilepsy. Science 338, 394–397 [DOI] [PMC free article] [PubMed] [Google Scholar]
- 4. Wek R. C., Jiang H. Y., Anthony T. G. (2006) Coping with stress: eIF2 kinases and translational control. Biochem. Soc. Trans. 34, 7–11 [DOI] [PubMed] [Google Scholar]
- 5. Harding H. P., Zhang Y., Zeng H., Novoa I., Lu P. D., Calfon M., Sadri N., Yun C., Popko B., Paules R., Stojdl D. F., Bell J. C., Hettmann T., Leiden J. M., Ron D. (2003) An integrated stress response regulates amino acid metabolism and resistance to oxidative stress. Mol. Cell 11, 619–633 [DOI] [PubMed] [Google Scholar]
- 6. Anthony T. G., McDaniel B. J., Byerley R. L., McGrath B. C., Cavener D. R., McNurlan M. A., Wek R. C. (2004) Preservation of liver protein synthesis during dietary leucine deprivation occurs at the expense of skeletal muscle mass in mice deleted for eIF2 kinase GCN2. J. Biol. Chem. 279, 36553–36561 [DOI] [PubMed] [Google Scholar]
- 7. Hao S., Sharp J. W., Ross-Inta C. M., McDaniel B. J., Anthony T. G., Wek R. C., Cavener D. R., McGrath B. C., Rudell J. B., Koehnle T. J., Gietzen D. W. (2005) Uncharged tRNA and sensing of amino acid deficiency in mammalian piriform cortex. Science 307, 1776–1778 [DOI] [PubMed] [Google Scholar]
- 8. Maurin A. C., Jousse C., Averous J., Parry L., Bruhat A., Cherasse Y., Zeng H., Zhang Y., Harding H. P., Ron D., Fafournoux P. (2005) The GCN2 kinase biases feeding behavior to maintain amino acid homeostasis in omnivores. Cell Metab. 1, 273–277 [DOI] [PubMed] [Google Scholar]
- 9. Marion V., Sankaranarayanan S., de Theije C., van Dijk P., Lindsey P., Lamers M. C., Harding H. P., Ron D., Lamers W. H., Köhler S. E. (2011) Arginine deficiency causes runting in the suckling period by selectively activating the stress kinase GCN2. J. Biol. Chem. 286, 8866–8874 [DOI] [PMC free article] [PubMed] [Google Scholar]
- 10. Guo F., Cavener D. R. (2007) The GCN2 eIF2α kinase regulates fatty-acid homeostasis in the liver during deprivation of an essential amino acid. Cell Metab. 5, 103–114 [DOI] [PubMed] [Google Scholar]
- 11. Bunpo P., Cundiff J. K., Reinert R. B., Wek R. C., Aldrich C. J., Anthony T. G. (2010) The eIF2 kinase GCN2 is essential for the murine immune system to adapt to amino acid deprivation by asparaginase. J. Nutr. 140, 2020–2027 [DOI] [PMC free article] [PubMed] [Google Scholar]
- 12. Munn D. H., Sharma M. D., Baban B., Harding H. P., Zhang Y., Ron D., Mellor A. L. (2005) GCN2 kinase in T cells mediates proliferative arrest and anergy induction in response to indoleamine 2,3-dioxygenase. Immunity 22, 633–642 [DOI] [PubMed] [Google Scholar]
- 13. Peng W., Robertson L., Gallinetti J., Mejia P., Vose S., Charlip A., Chu T., Mitchell J. R. (2012) Surgical stress resistance induced by single amino acid deprivation requires Gcn2 in mice. Sci. Transl. Med. 4, 118ra11. [DOI] [PMC free article] [PubMed] [Google Scholar]
- 14. Reinert R. B., Oberle L. M., Wek S. A., Bunpo P., Wang X. P., Mileva I., Goodwin L. O., Aldrich C. J., Durden D. L., McNurlan M. A., Wek R. C., Anthony T. G. (2006) Role of glutamine depletion in directing tissue-specific nutrient stress responses to l-asparaginase. J. Biol. Chem. 281, 31222–31233 [DOI] [PubMed] [Google Scholar]
- 15. She P., Olson K. C., Kadota Y., Inukai A., Shimomura Y., Hoppel C. L., Adams S. H., Kawamata Y., Matsumoto H., Sakai R., Lang C. H., Lynch C. J. (2013) Leucine and protein metabolism in obese Zucker rats. PLoS One 8, e59443. [DOI] [PMC free article] [PubMed] [Google Scholar]
- 16. Bunpo P., Dudley A., Cundiff J. K., Cavener D. R., Wek R. C., Anthony T. G. (2009) GCN2 protein kinase is required to activate amino acid deprivation responses in mice treated with the anti-cancer agent l-asparaginase. J. Biol. Chem. 284, 32742–32749 [DOI] [PMC free article] [PubMed] [Google Scholar]
- 17. Teske B. F., Wek S. A., Bunpo P., Cundiff J. K., McClintick J. N., Anthony T. G., Wek R. C. (2011) The eIF2 kinase PERK and the integrated stress response facilitate activation of ATF6 during endoplasmic reticulum stress. Mol. Biol. Cell 22, 4390–4405 [DOI] [PMC free article] [PubMed] [Google Scholar]
- 18. Schmued L. C. (1990) A rapid, sensitive histochemical stain for myelin in frozen brain sections. J. Histochem. Cytochem. 38, 717–720 [DOI] [PubMed] [Google Scholar]
- 19. Wahlsten D., Colbourne F., Pleus R. (2003) A robust, efficient and flexible method for staining myelinated axons in blocks of brain tissue. J. Neurosci. Methods 123, 207–214 [DOI] [PubMed] [Google Scholar]
- 20. Miller R. H., Eisenstein R. S., Harper A. E. (1988) Effects of dietary protein intake on branched-chain keto acid dehydrogenase activity of the rat. Immunochemical analysis of the enzyme complex. J. Biol. Chem. 263, 3454–3461 [PubMed] [Google Scholar]
- 21. Kuntz M. J., Paxton R., Shimomura Y., Goodwin G. W., Harris R. A. (1986) Phosphorylation affects the mobility of the E1 α-subunit of branched-chain 2-oxo acid dehydrogenase on sodium dodecyl sulphate-polyacylamide gel electrophoresis. Biochem. Soc. Trans. 14, 1077–1078 [Google Scholar]
- 22. Kilberg M. S., Shan J., Su N. (2009) ATF4-dependent transcription mediates signaling of amino acid limitation. Trends Endocrinol. Metab. 20, 436–443 [DOI] [PMC free article] [PubMed] [Google Scholar]
- 23. Vattem K. M., Wek R. C. (2004) Reinitiation involving upstream ORFs regulates ATF4 mRNA translation in mammalian cells. Proc. Natl. Acad. Sci. U.S.A. 101, 11269–11274 [DOI] [PMC free article] [PubMed] [Google Scholar]
- 24. Yamaguchi S., Ishihara H., Yamada T., Tamura A., Usui M., Tominaga R., Munakata Y., Satake C., Katagiri H., Tashiro F., Aburatani H., Tsukiyama-Kohara K., Miyazaki J., Sonenberg N., Oka Y. (2008) ATF4-mediated induction of 4E-BP1 contributes to pancreatic beta cell survival under endoplasmic reticulum stress. Cell Metab. 7, 269–276 [DOI] [PubMed] [Google Scholar]
- 25. Hawkins R. A., O'Kane R. L., Simpson I. A., Viña J. R. (2006) Structure of the blood-brain barrier and its role in the transport of amino acids. J. Nutr. 136, 218S–226S [DOI] [PubMed] [Google Scholar]
- 26. Sikalidis A. K., Lee J. I., Stipanuk M. H. (2011) Gene expression and integrated stress response in HepG2/C3A cells cultured in amino acid deficient medium. Amino Acids 41, 159–171 [DOI] [PMC free article] [PubMed] [Google Scholar]
- 27. van der Voorn J. P., van Kollenburg B., Bertrand G., Van Haren K., Scheper G. C., Powers J. M., van der Knaap M. S. (2005) The unfolded protein response in vanishing white matter disease. J. Neuropathol. Exp. Neurol. 64, 770–775 [DOI] [PubMed] [Google Scholar]
- 28. van Kollenburg B., van Dijk J., Garbern J., Thomas A. A., Scheper G. C., Powers J. M., van der Knaap M. S. (2006) Glia-specific activation of all pathways of the unfolded protein response in vanishing white matter disease. J. Neuropathol. Exp. Neurol. 65, 707–715 [DOI] [PubMed] [Google Scholar]
- 29. Baumann N., Pham-Dinh D. (2001) Biology of oligodendrocyte and myelin in the mammalian central nervous system. Physiol. Rev. 81, 871–927 [DOI] [PubMed] [Google Scholar]
- 30. Lu Q. R., Sun T., Zhu Z., Ma N., Garcia M., Stiles C. D., Rowitch D. H. (2002) Common developmental requirement for Olig function indicates a motor neuron/oligodendrocyte connection. Cell 109, 75–86 [DOI] [PubMed] [Google Scholar]
- 31. Xin M., Yue T., Ma Z., Wu F. F., Gow A., Lu Q. R. (2005) Myelinogenesis and axonal recognition by oligodendrocytes in brain are uncoupled in Olig1-null mice. J. Neurosci. 25, 1354–1365 [DOI] [PMC free article] [PubMed] [Google Scholar]
- 32. Yue T., Xian K., Hurlock E., Xin M., Kernie S. G., Parada L. F., Lu Q. R. (2006) A critical role for dorsal progenitors in cortical myelination. J. Neurosci. 26, 1275–1280 [DOI] [PMC free article] [PubMed] [Google Scholar]
- 33. Calver A. R., Hall A. C., Yu W.-P., Walsh F. S., Heath J. K., Betsholtz C., Richardson W. D. (1998) Oligodendrocyte population dynamics and the role of PDGF in vivo. Neuron 20, 869–882 [DOI] [PubMed] [Google Scholar]
- 34. Bradl M., Lassmann H. (2010) Oligodendrocytes: biology and pathology. Acta Neuropathol. 119, 37–53 [DOI] [PMC free article] [PubMed] [Google Scholar]
- 35. Thorburne S. K., Juurlink B. H. (1996) Low glutathione and high iron govern the susceptibility of oligodendroglial precursors to oxidative stress. J. Neurochem. 67, 1014–1022 [DOI] [PubMed] [Google Scholar]
- 36. Schmitz T., Chew L. J. (2008) Cytokines and myelination in the central nervous system. Sci. World J. 8, 1119–1147 [DOI] [PMC free article] [PubMed] [Google Scholar]
- 37. Perlman S. J., Mar S. (2012) Leukodystrophies. Adv. Exp. Med. Biol. 724, 154–171 [DOI] [PubMed] [Google Scholar]
- 38. Leegwater P. A., Vermeulen G., Könst A. A., Naidu S., Mulders J., Visser A., Kersbergen P., Mobach D., Fonds D., van Berkel C. G., Lemmers R. J., Frants R. R., Oudejans C. B., Schutgens R. B., Pronk J. C., van der Knaap M. S. (2001) Subunits of the translation initiation factor eIF2B are mutant in leukoencephalopathy with vanishing white matter. Nat. Genet. 29, 383–388 [DOI] [PubMed] [Google Scholar]
- 39. Duncan I. D., Lunn K. F., Holmgren B., Urba-Holmgren R., Brignolo-Holmes L. (1992) The taiep rat: a myelin mutant with an associated oligodendrocyte microtubular defect. J. Neurocytol. 21, 870–884 [DOI] [PubMed] [Google Scholar]
- 40. Jacobs E. C. (2005) Genetic alterations in the mouse myelin basic proteins result in a range of dysmyelinating disorders. J. Neurol. Sci. 228, 195–197 [DOI] [PubMed] [Google Scholar]
- 41. Vela J. M., González B., Castellano B. (1998) Understanding glial abnormalities associated with myelin deficiency in the jimpy mutant mouse. Brain Res. Brain Res. Rev. 26, 29–42 [DOI] [PubMed] [Google Scholar]
- 42. Baud O., Haynes R. F., Wang H., Folkerth R. D., Li J., Volpe J. J., Rosenberg P. A. (2004) Developmental up-regulation of MnSOD in rat oligodendrocytes confers protection against oxidative injury. Eur. J. Neurosci. 20, 29–40 [DOI] [PubMed] [Google Scholar]
- 43. Baud O., Greene A. E., Li J., Wang H., Volpe J. J., Rosenberg P. A. (2004) Glutathione peroxidase-catalase cooperativity is required for resistance to hydrogen peroxide by mature rat oligodendrocytes. J. Neurosci. 24, 1531–1540 [DOI] [PMC free article] [PubMed] [Google Scholar]
- 44. Chaveroux C., Lambert-Langlais S., Parry L., Carraro V., Jousse C., Maurin A. C., Bruhat A., Marceau G., Sapin V., Averous J., Fafournoux P. (2011) Identification of GCN2 as new redox regulator for oxidative stress prevention in vivo. Biochem. Biophys. Res. Commun. 415, 120–124 [DOI] [PubMed] [Google Scholar]
- 45. Lewerenz J., Maher P. (2009) Basal levels of eIF2α phosphorylation determine cellular antioxidant status by regulating ATF4 and xCT expression. J. Biol. Chem. 284, 1106–1115 [DOI] [PMC free article] [PubMed] [Google Scholar]
- 46. di Penta A., Moreno B., Reix S., Fernandez-Diez B., Villanueva M., Errea O., Escala N., Vandenbroeck K., Comella J. X., Villoslada P. (2013) Oxidative stress and proinflammatory cytokines contribute to demyelination and axonal damage in a cerebellar culture model of neuroinflammation. PLoS One 8, e54722. [DOI] [PMC free article] [PubMed] [Google Scholar]
- 47. Pang Y., Campbell L., Zheng B., Fan L., Cai Z., Rhodes P. (2010) Lipopolysaccharide-activated microglia induce death of oligodendrocyte progenitor cells and impede their development. Neuroscience 166, 464–475 [DOI] [PubMed] [Google Scholar]
- 48. Kim S., Steelman A. J., Koito H., Li J. (2011) Astrocytes promote TNF-mediated toxicity to oligodendrocyte precursors. J. Neurochem. 116, 53–66 [DOI] [PMC free article] [PubMed] [Google Scholar]
- 49. Su Z., Yuan Y., Chen J., Zhu Y., Qiu Y., Zhu F., Huang A., He C. (2011) Reactive astrocytes inhibit the survival and differentiation of oligodendrocyte precursor cells by secreted TNF-α. J. Neurotrauma 28, 1089–1100 [DOI] [PubMed] [Google Scholar]
- 50. McDonald J. W., Althomsons S. P., Hyrc K. L., Choi D. W., Goldberg M. P. (1998) Oligodendrocytes from forebrain are highly vulnerable to AMPA/kainate receptor-mediated excitotoxicity. Nat. Med. 4, 291–297 [DOI] [PubMed] [Google Scholar]
- 51. Oka A., Belliveau M. J., Rosenberg P. A., Volpe J. J. (1993) Vulnerability of oligodendroglia to glutamate: pharmacology, mechanisms, and prevention. J. Neurosci. 13, 1441–1453 [DOI] [PMC free article] [PubMed] [Google Scholar]
- 52. Yudkoff M., Daikhin Y., Nissim I., Horyn O., Luhovyy B., Luhovyy B., Lazarow A., Nissim I. (2005) Brain amino acid requirements and toxicity: the example of leucine. J. Nutr. 135, 1531S–1538S [DOI] [PubMed] [Google Scholar]