Abstract
We present high-speed hyperspectral Raman imaging with integrated active-illumination for label-free compositional microanalysis. We show that high-quality Raman spectra can be acquired from as many as ~1,000 spots/sec semi-randomly distributed among a ~100x100 μm2 area without mechanical scanning. We demonstrate rapid data acquisition from three types of samples: 1) uniform, strong Raman scatterers, e.g., silicon substrates; 2) non-uniform, medium-strength Raman scatterers, e.g., polymer microparticles; and, 3) non-uniform, relatively weak Raman scatterers, e.g., bacterial spores. We compare the system performance to that of point-scan with an electron-multiplied CCD camera, as implemented in some commercial systems. The results suggest that our system not only provides significant imaging speed advantage for various types of samples, but also permits substantially longer integration time per spot, leading to superior signal-to-noise ratio data. Our system enables the rapid collection of high quality Raman spectra for reliable and robust compositional microanalysis that are potentially transformative in applications such as semiconductor material and device, polymer blend and biomedicine.
OCIS codes: (180.5655) Raman microscopy, (170.1530) Cell analysis, (170.0110) Imaging systems
1. Introduction
Raman spectroscopy is a powerful technique for label-free compositional analysis via inelastic light scattering. It is particularly useful in obtaining microscopic information over a sizable area without physical contact, thereby requiring little or no sample preparation. However, conventional laser scanning confocal Raman microscope involves long data acquisition time due to its sequential operation, as well as the additional latency from the readout time of low-noise charge coupled device (CCD) detectors. As a result, conventional point-scan Raman mapping speed is about one to a few spots per second, or a few Hertz (Hz) [1].
Using Raman microscopy to study biological cells in situ is very attractive because molecular information can be obtained without exogenous stains or fluorescence labels [1]. Important examples include the studies of intracellular substances at different stages of cell mitosis [2]; time-lapse imaging of lymphocytes [3]; bacterial strains by identification [4]; intracellular monitoring [5]; intracellular delivery and degradation of polymeric nanoparticles [6]. The results from these studies show that the Raman mapping of spatiotemporal molecular composition can enable important discoveries in biology or biomedicine. However, the small Raman scattering cross-section of biological substances, together with the damage threshold limits on laser power density (~2-10 mW/µm2), leads to long pixel imaging times typically on the order of seconds. This limits the scalability in terms of cell population size, resolution, and molecular complexity. Although nonlinear Raman techniques such as CARS and SRS allow faster imaging, full-spectrum acquisition and interpretation are not as straightforward [7, 8].
To achieve a higher speed, point-scan is employed in more recent commercial Raman systems with an electron-multiplied CCD (EMCCD) detectors. For strong Raman scatterers, an integration time ~1 ms per spot is possible, resulting in a speed ~300 Hz after taking into account the readout time. Although EMCCD can boost signal-to-noise ratio (SNR) under Raman photon-starving situation, amplification noise is unavoidable. For weaker Raman scatterers commonly seen in biological samples, however, the speed of the EMCCD-based system is severely lowered and approaches that of conventional non-EMCCD systems because much longer integration time per spot is needed. This barrier cannot be overcome simply by increasing laser power because of damaging and phototoxicity issues.
In contrast, parallel acquisition using a line-shaped laser pattern can achieve similar throughput without rapid scanning, and provides a means to fully utilize the available laser power without introducing phototoxicity. Raman photons originating from the entire line, equivalent to many spots, are imaged to the entrance slit of an imaging spectrograph. Therefore, the data acquired in one single frame is two-dimensional, i.e., hyperspectral in (x,λ), in the sense that it contains spatially resolved Raman spectra from multiple spots. Three-dimensional (x,y,λ) data can be obtained by scanning the laser line in the transverse direction [9]. Although effective, the line-scan approach suffers from a major limitation: parallelism is only possible for points lying on a line, which is not flexible for sparse scenes.
To overcome this inflexibility, we recently implemented a scheme to simultaneously collect hyperspectral Raman spectra from on average 12 spots per CCD frame using spatial light modulator (SLM) generated active illumination patterns and wide-field image collection [10]. However, high-speed Raman imaging was not demonstrated. In this paper, we present several key improvements. First, we have optimized the excitation optical path to achieve as many as 120 spots per pattern, which results in an unprecedented imaging throughput (~1 kHz) for strong Raman scatterers. Second, we have automated the centroid-finding, random spot pattern selection and hologram generation, thus eliminating the need for human intervention and enabling rapid imaging from non-uniform polymer microspheres and bacterial spores at unprecedented speed. Compared to the point-scan approach using an EMCCD camera, our system not only provides significant imaging speed advantage for various types of samples, but also permits substantially longer integration time per spot, leading to superior signal-to-noise ratio (SNR) data.
2. Methods and materials
2.1 System configuration
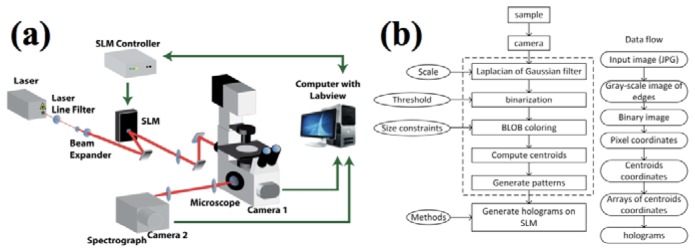
We have developed an integrated software and hardware approach as shown in Fig. 1(a) , where a snapshot bright-field image was first taken by camera 1 (Dalsa, Pantera 1M30) and analyzed to extract centroids from samples. A series of “optimal” illumination patterns were then calculated automatically to avoid completely spectral mixing (discussed later). The laser path of the system consisted of a 785 nm laser (Spectra-Physics, 3900S) filtered by a laser-line filter (Semrock LL01-785-12.5) and expanded to ~1 cm in diameter before the spatial light modulator (SLM, LCOS Hamamatsu). The output from the SLM was fed through the back port of an inverted microscope (Olympus IX71) with a tube lens. A dichroic filter (Semrock LPD01-785RU-25) was employed to collect epi-Raman via a microscope objective (Olympus UPLSAPO 60XW, 1.2 NA). The Raman light was filtered by a long-wave pass filter (Semrock LP02-785RS-25), and recorded by an imaging spectrograph (Acton 300i) with camera 2 (Princeton 400BR). An EMCCD (Andor DU970) was employed with the same optical system for signal-to-noise ratio (SNR) comparison.
Fig. 1.

(a) System configuration; (b) image feature extraction, random pattern selection and hologram computation flow chart.
2.2 Image feature extraction, hologram computation and system calibration
Figure 1(b) shows the image analysis modules and data flow from a bright-field snapshot to hologram generation, implemented in Labview (National Instrument) with embedded MATLAB (Mathworks Inc.) script nodes in the dotted block. The image acquired by camera 1 was first passed to a second-derivative based Laplacian of Gaussian (LoG) filter for edge detection. The image was then binarized. Object detection was implemented by binary large object (BLOB) coloring. Connected areas were analyzed and assigned with a common label. Size constraint was added to eliminate outliers to avoid false positives of edge detection.
Once every object had a unique label, the centroids of individual objects were calculated by averaging the pixel coordinates within each object. These centroids were the targets where focused laser spots would illuminate. To reduce spatiospectral mixing from multiple points, the centroid image was split into several patterns automatically by maximizing the number of spots within one pattern under a constraint on the minimal vertical distance between any two spots. This was repeated until all the points were covered. Each pattern was represented by multiple spot positions (x,y) with respect to the SLM projection field coordinates. The spot positions were input into the hologram generation module one pattern at a time. The “generating holograms on SLM” module was implemented using Fourier transform-based Gerchburg-Saxton 3D algorithm.
Typically, the bright-field imaging coordinates and the SLM projection field coordinates did not co-register due to imperfect alignment. Thus, the laser spot “aiming” precision was not guaranteed. For uniform samples, this resulted in position errors in the final image, similar to registration or “stitching” errors commonly seen in point-scan imaging; for non-uniform samples, sub-optimal Raman spectra was obtained due to misaiming. In addition, mixed Raman spectra would have been obtained if the spot illuminates near the boundary of two microparticles of different composition. To address this issue, we have developed an automated calibration procedure using a uniform silicon wafer. First, an 11 x 11 spot array with 8 μm center-to-center distance was employed to form a grid covering the entire field of view. This grid array was then imaged and registered on the coordinates of the front port camera. In this way, we established a one-to-one mapping between the SLM projection field coordinates and the bright-field imaging coordinates. The gird array was then shifted in steps of 0.5 μm vertically and horizontally to improve the density of the mapping until a finer grid with 0.5 μm spacing between adjacent spots were established within the field of view. This calibration procedure resulted in a look-up table for guaranteed precision ~0.5 μm. In our experience, precision ~0.2 μm can be achieved, which is smaller than the system resolution.
3. Experimentals
3.1 Performance on silicon substrates
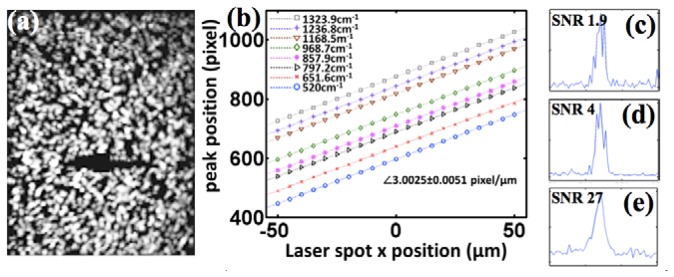
Since the Raman scattering cross-section of silicon is orders of magnitude larger than common materials, it represents a good model for us to test the ultimate speed of our system. In this experiment, 19 random patterns, each with 121 spots, were employed with 15 ms integration time per CCD frame, resulting in 2299 spots in 2.3 seconds, or equivalently ~1 kHz. We note that the minimum integration time was limited by the mechanical shutter which requires ~10 ms to open and close. Figure 2(a) shows the overall image using silicon’s Raman peak at 520 cm−1 after background removal.
Fig. 2.

(a) Silicon image using the 520 cm−1 peak from 19 random illumination patterns within a 90x120 μm2 field of view; (b) Measured peak positions vs. laser spot x position using seven acetaminophen Raman peaks and one silicon Raman peak. These curves enable the correct assignment of Raman shifts for each laser excitation spot; (c), (d) and (e) silicon spectra near 520 cm−1 peak acquired by EMCCD with 1 and 10 ms integration time, and low-noise CCD with 25 ms integration time, respectively.
3.2 Wavenumber calibration
To examine the dependence of Raman shifts on the lateral (x) position of laser spot, we have performed experiments using acetaminophen powder and silicon wafer samples. A single laser spot was scanned across the entire field of view (100 µm) at 5 µm step size. The results shown in Fig. 2(b) suggest that the motion of the peak positions is highly linear with respect to the laser spot motion, as expected. These curves have been employed in previous results to calibrate the Raman shifts for each laser excitation spot and as the fitting result indicates, the calibration error is far less than one pixel.
3.3 Signal-to-noise ratio comparison between different CCD detectors
A distinct advantage of our system is that significantly longer integration time can be used compared to rapid point-scan systems using EMCCD, where an integration time on the order of milliseconds are necessarily for high throughput. As shown in Fig. 2(c) and 2(d), the signal-to-noise ratio (SNR) of silicon obtained by the EMCCD was 1.9 and 4 for 1 ms and 10 ms CCD integration time, respectively. In contrast, as shown in Fig. 2(e), the SNR obtained by the low-noise CCD is 27 for 25 ms integration time. We note that a similar SNR was obtained in our previous silicon data at nearly 1 kHz. Therefore, our system not only is 3 times faster than the point-scan-EMCCD approach, but also provides superior SNR in the acquired images.
3.4 Chemical classification of polymer microparticles
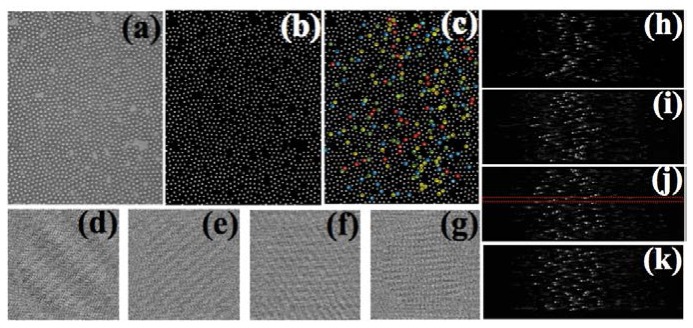
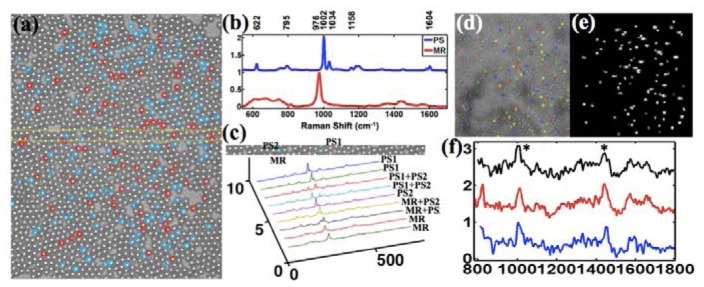
Next, we demonstrate the system performance using a mixture of 1679 2-μm polystyrene (PS) and melamine resin (MR) microspheres, which appeared identically in the bright-field image shown in Fig. 3(a) . Figure 3(b) shows the identified centroids, among which ~15% were randomly selected and split into 4 sub-groups under the condition that >2 μm vertical separation between any two centroids in the same sub-group, preventing substantial spatiospectral mixing. Nevertheless, as long as two spots did not completely aligned horizontally, pure spectra from either bead can always be obtained from the edges of the beads for identification purpose under the assumption that these are homogeneous beads (discussed later). Figure 3(c) shows the 4 color-coded sub-groups with the corresponding 4 holograms in Fig. 3(d)-3(g), using which Raman images were collected in Fig. 3(h)-3(k). As summarized in Fig. 4(a) , a total of 245 microspheres were sampled, among which 129 were PS (blue) and 116 were MR (red) based on their distinct Raman spectra shown in Fig. 4(b). The data acquisition duration was 1.5 sec, or 163 Hz.
Fig. 3.

(a) Bright-field image of a mixed sample of 2 μm PS and MR microspheres; (b) binarized centroid image after image processing; (c) random selection of 15% of microspheres and splitting into four color-coded groups (patterns); (d-g) holograms corresponding to the four groups (patterns) selected in (c); (h-k) raw Raman images corresponding to the illumination patterns according to the holograms in (d-g).
Fig. 4.

(a) Classification of polymer microparticles with PS marked by blue circles and MR red circles; (b) Raman spectra of PS and MR with major peaks used in classification; (c, top image) three microparticles of interest are illuminated by three laser spots in the windowed region in pattern #3, or Fig. 3(j); (c, bottom spectra) Raman spectra from the nine CCD rows corresponding to the same region in the top image; (d) bright-field image of spores and 4 color-coded sub-groups for 4 illumination patterns; (e) corresponding Raman image by 4 illumination patterns; (f) representative spore Raman spectra with characteristic peaks marked by *.
As mentioned earlier, in most situations, the patterns satisfy the condition that the vertical separation between any two centroids selected in the same sub-group are larger than ~2 μm. To further elucidate how the minor spatiospectral mixing is not an issue, we take a closer look at a region outlined by a red window in Fig. 3(j), i.e., pattern #3. As shown in Fig. 4(c, top image), three laser spots were employed in the windowed region of illumination pattern #3 to sample three microspheres, PS1, PS2 and MR. The spectra from nine adjacent CCD rows corresponding to this region are also plotted in Fig. 4(c, bottom), where spatiospectral mixing was observed. However, we can correctly classify these spectra into PS1, PS1 + PS2, PS2, MR + PS2 and MR since we know exactly what the Raman spectra of PS and MR are and the locations of the laser spots with respect to the microparticles.
3.5 Chemical identification of bacterial spores
The study of spore formation under harsh environmental conditions is of great interest in microbiology. In addition, it is critical to detect and analyze spores in biofilms in order to develop optimal treatment strategies. Using Bacillus subtilis spore as a model specie, we are interested in learning the chemical changes during sporulation and the germination processes at the population level. As shown in Fig. 4(d), we have split ~100 spores into 4 sub-groups and employed 4 illumination to acquire their Raman spectra within 40 seconds, equivalent to 2.5 Hz, which compares favorably against 2 spore/min or 0.033 Hz in the best throughput ever reported [11]. A map was generated in Fig. 4(e) using the prominent peak at 1017 cm−1 of dipicolinic acid abundant in spores. Representative spore spectra are shown in Fig. 4(f).
4. Conclusion
In conclusion, we have developed a high-speed hyperspectral Raman imaging system with integrated image-guided active illumination. We have shown that high-quality Raman spectra can be acquired from as many as ~1,000 micron-sized spots/sec semi-randomly distributed among a ~100x100 μm2 field of view without mechanical scanning. We have demonstrated rapid compositional microanalysis of three types of samples with various Raman scattering strength. Compared to the point-scan with EMCCD approach, the results suggest that our system not only provides significant imaging speed advantage for various types of samples, but also permits substantially longer integration time per spot, leading to superior signal-to-noise ratio (SNR) data. The demonstrated new capabilities could have significant impact in Raman image acquisition in biological or biomedical applications.
Acknowledgments
WCS acknowledges funding from NSF CAREER Award (CBET-1151154), NASA Early Career Faculty Grant (NNX12AQ44G) and Gulf of Mexico Research Initiative grant (GoMRI-030). We thank Prof. Masaya Fujita for providing the bacterial spores.
References and links
- 1.Puppels G. J., de Mul F. F. M., Otto C., Greve J., Robert-Nicoud M., Arndt-Jovin D. J., Jovin T. M., “Studying single living cells and chromosomes by confocal Raman microspectroscopy,” Nature 347(6290), 301–303 (1990). 10.1038/347301a0 [DOI] [PubMed] [Google Scholar]
- 2.Matthäus C., Boydston-White S., Miljković M., Romeo M., Diem M., “Raman and infrared microspectral imaging of mitotic cells,” Appl. Spectrosc. 60(1), 1–8 (2006). 10.1366/000370206775382758 [DOI] [PMC free article] [PubMed] [Google Scholar]
- 3.Pully V. V., Lenferink A. T. M., Otto C., “Time-lapse Raman imaging of single live lymphocytes,” J. Raman Spectros. 42(2), 167–173 (2011). 10.1002/jrs.2683 [DOI] [Google Scholar]
- 4.Beier B. D., Quivey R. G., Berger A. J., “Identification of different bacterial species in biofilms using confocal Raman microscopy,” J. Biomed. Opt. 15(6), 066001 (2010). 10.1117/1.3505010 [DOI] [PMC free article] [PubMed] [Google Scholar]
- 5.Kneipp K., Haka A. S., Kneipp H., Badizadegan K., Yoshizawa N., Boone C., Shafer-Peltier K. E., Motz J. T., Dasari R. R., Feld M. S., “Surface-enhanced Raman Spectroscopy in single living cells using gold nanoparticles,” Appl. Spectrosc. 56(2), 150–154 (2002). 10.1366/0003702021954557 [DOI] [Google Scholar]
- 6.Chernenko T., Matthäus C., Milane L., Quintero L., Amiji M., Diem M., “Label-free Raman spectral imaging of intracellular delivery and degradation of polymeric nanoparticle systems,” ACS Nano 3(11), 3552–3559 (2009). 10.1021/nn9010973 [DOI] [PubMed] [Google Scholar]
- 7.Freudiger C. W., Min W., Saar B. G., Lu S., Holtom G. R., He C. W., Tsai J. C., Kang J. X., Xie X. S., “Label-Free Biomedical Imaging with High Sensitivity by Stimulated Raman Scattering Microscopy,” Science 322(5909), 1857–1861 (2008). 10.1126/science.1165758 [DOI] [PMC free article] [PubMed] [Google Scholar]
- 8.Gao L., Zhou H. J., Thrall M. J., Li F., Yang Y. L., Wang Z. Y., Luo P. F., Wong K. K., Palapattu G. S., Wong S. T. C., “Label-free high-resolution imaging of prostate glands and cavernous nerves using coherent anti-Stokes Raman scattering microscopy,” Biomed. Opt. Express 2(4), 915–926 (2011). 10.1364/BOE.2.000915 [DOI] [PMC free article] [PubMed] [Google Scholar]
- 9.Hamada K., Fujita K., Smith N. I., Kobayashi M., Inouye Y., Kawata S., “Raman microscopy for dynamic molecular imaging of living cells,” J. Biomed. Opt. 13(4), 044027 (2008). 10.1117/1.2952192 [DOI] [PubMed] [Google Scholar]
- 10.Qi J., Shih W.-C., “Parallel Raman microspectroscopy using programmable multipoint illumination,” Opt. Lett. 37(8), 1289–1291 (2012). 10.1364/OL.37.001289 [DOI] [PubMed] [Google Scholar]
- 11.Stockel S., Meisel S., Bohme R., Elschner M., Rosch P., Popp J., “Effect of supplementary manganese on the sporulation of Bacillus endospores analysed by Raman spectroscopy,” J. Raman Spectros. 40, 1469–1477 (2009). 10.1002/jrs.2292 [DOI] [Google Scholar]


