Abstract
Mueller matrix polarimetric imaging has shown potential in tissue diagnosis but is challenging to implement endoscopically. In this work, a narrow band 3 × 3 Mueller matrix polarimetric endoscope was designed by rotating the endoscope to generate 0°, 45° and 90° linearly polarized illumination and positioning a rotating filter wheel in front of the camera containing three polarisers to permit polarization state analysis for backscattered light. The system was validated with a rotating linear polarizer and a diffuse reflection target. Initial measurements of 3 × 3 Mueller matrices on a rat are demonstrated, followed by matrix decomposition into the depolarization and retardance matrices for further analysis. Our work shows the feasibility of implementing polarimetric imaging in a rigid endoscope conveniently and economically in order to reveal diagnostic information.
OCIS codes: (170.2150) Endoscopic imaging; (290.5855) Scattering, polarization; (110.4234) Multispectral and hyperspectral imaging
1. Introduction
Polarization analysis has attracted interest as a tool in biomedical sensing since it can be sensitive to morphological, structural and compositional changes of tissue and hence can potentially complement fluorescence, Raman or absorption sensing to reveal functional or metabolic information. Polarized photons incident on tissue undergoing single (or a small number of) scattering events correspond to short flight times and are mainly scattered near the surface, maintaining their polarization. Photons that penetrate deeper have longer flight times and are more likely to be scattered multiple times with their polarization randomized. Thus, depolarization in turbid media has been applied as a gating technique to separate singly scattered, specularly reflected and multiply scattered light for the following scenarios: i) to enhance the image contrast near to the tissue surface [1]; ii) to extract single elastic scattering spectra from diffuse backgrounds for cell nucleus and cytoplasm size characterization [2, 3]; iii) to improve image quality by removing specular reflections [4]: iv) to select well-defined subsurface volumes in a turbid medium [5]; v) to reveal features at depth such as pigmentation and vessels when detecting via cross polarizers [6]; vi) to correlate with tissue absorption and scattering [7]; and vii) for disease diagnosis [8–10]. In addition, a number of constituents in tissue including structural proteins like collagen, and chiral molecules like glucose, also manifest birefringence and optical rotation which can contribute to the detection of tissue abnormalities such as osteoarthritis, thermal injury and cancer [10–15].
Mueller matrices provide a complete polarization characterization of a medium and can be decomposed to allow interpretation in terms of depolarization, diattenuation and retardance, including birefringence and optical rotation [16, 17]. Mueller matrix polarimetric imaging has already shown potential in tissue diagnosis through the detection of tissue depolarization and retardance. Antonelli et al. conducted early cancerous tissue detection in human colon ex vivo with multispectral Mueller polarimetry [9]. Pierangelo et al. demonstrated it could provide image contrast to discriminate different histological types of colon cancer and the stage of development [8]. Vitkin et al. showed the ability of polarimetry to characterize the micro-organizational state of the myocardium and the potential for monitoring regenerative treatments of myocardial infarction [15]. Shukla et al. confirmed that for cervical tissue depolarization is sensitive to morphological changes in the epithelium region and retardance is capable of revealing the morphological changes around the stroma [18]. Alternatively, tissue characterization based on Jones matrix and Stokes formalisms which follows the similar methodology as Mueller matrix is also promising [19, 20]. However none of these experiments has been conducted endoscopically with the lack of endoscopic imaging instruments a significant reason.
Minimally invasive surgical (MIS) techniques have been widely adopted for diagnostic and interventional purposes, with visualisation of the tissue accomplished through a rigid endoscope. Incorporation of Mueller polarimetric imaging onto this platform could result in a powerful diagnostic tool, with results available to the surgeon intraoperatively. In a previous study it was shown that the sapphire window of a conventional rigid endoscope has birefringent properties making it unsuitable for polarisation imaging [21]. This problem can be avoided for orthogonal polarization imaging by placing the polariser and analyser filters at the distal tip of the endoscope. This was demonstrated recently by our group in an in vivo experiment using a narrowband difference of linear polarisation system based on a rigid stereo endoscope [22]. Tip-mounted optics has also been demonstrated in vivo, in a flexible cross-polarised system, by Thekkek et al. [23]. To accommodate the multiple polariser/analyser combinations required for Mueller matrix imaging though, a non-birefringent laparoscope (rigid endoscope used to inspect the abdomen) was designed which is suitable for analyzing polarization states at the proximal end (eyepiece) rather than the distal end (objective) of the laparoscope [3, 24]. However, since the illumination channel is typically an optical fibre bundle system that depolarizes the light significantly, a polarization state generator (PSG) has to be miniaturised and positioned at the distal end. In free-space implementations of 4 × 4 Mueller matrix imaging PSGs are usually comprised of a combination of rotatable and removable polarizing components or variable retarders made by nematic liquid crystals or electro-optical crystals. However these techniques are incompatible with practical endoscopic imaging systems due to the difficulty of changing the distal optics in the former case, and size restrictions in the latter.
A 3 × 3 Mueller matrix with only linear polarization measurement involved is also able to quantify important polarization information using the matrix polar decomposition approach presented by Ghosh et al. [17]. The design of the PSG can be significantly simplified for measuring 3 × 3 Mueller matrices by obviating the need for phase retarder [17], and can be compatible with the endoscope without complex miniaturisation. In addition, acquisition time is also theoretically 43% less as 9 images are required rather than 16 images for the full 4 × 4 Mueller matrix, which can alleviate problems caused by the motion of tissue (e.g. respiratory motion) considerably during the sequential image acquisition procedure. Hence, in this work a PSG for 3 × 3 Mueller matrix polarimetric imaging was designed by rotating the entire endoscope with a linear polarizing film fixed on its illumination channel to generate 0°, 45° and 90° linearly polarized illumination. A polarisation state analyser (PSA) was incorporated in front of the camera in the form of a rotating filter wheel containing three linear polarisers with their polarization axes oriented at 0°, −45° and 90° to analyze the emergent polarization states. The system was validated with a rotating linear polarizer and a diffuse reflection target as test objects. An animal trial on a Sprague-Dawley rat was conducted to allow measurement of 3 × 3 Mueller matrices of rat abdomen ex vivo. The matrices were decomposed into the depolarization and retardance matrices for further analysis. Our work shows that it is feasible to implement polarimetric imaging in a rigid endoscope conveniently and economically to reveal diagnostic information on biological tissue.
2. Methods
2.1 Derivation of the 3 × 3 Mueller matrix
The Stokes vector S’ describing the polarization state of light usually consists of four elements that are labelled I, Q, U and C denoting the total intensity, and the intensity differences between horizontal (H) and vertical (V) linearly polarized light, + 45° (F +) and −45° linearly (F –) polarized light, and right and left circularly polarized light respectively. It reduces to a three-element vector S in Eq. (1), when circular polarization is not involved. As the total intensity is always the sum of any two orthogonal states [25], the reduced Stokes vector can be expressed as:
| (1) |
According to Eq. (1), it is sufficient to analyze a reduced Stokes vector with three PSA states (i.e., H, F –, and V). The 3 × 3 Mueller matrix M that transforms a reduced Stokes vector Sin to Sout can be written as:
| (2) |
It is noted that the input light should not contain any circular polarized component so that the 3 × 3 Mueller matrix M exactly corresponds to the top left 3 × 3 sub-matrix of the 4 × 4 full Mueller matrix.
In order to obtain the nine elements of this 3 × 3 Mueller matrix, at least three different input polarization states (corresponding to three PSG states) should be generated and their output should be analyzed (with three PSA states) to construct nine equations. These nine equations can be expressed in linear algebra as:
| (3) |
In this work, Sin1, Sin2 and Sin3 were selected to be H, F + and V via adjusting PSG to make the matrix [Sin1, Sin2, Sin3] invertible as well as to minimize the condition number which is a definition in the field of numerical analysis, measuring how sensitive the calculated Mueller matrix is to changes or errors in the input the matrix [Sin1, Sin2, Sin3] [26]. According to Eq. (1), the states of the PSA may be chosen to be H, F – and V so that I out, Q out and Uout are obtained in [Sout1, Sout2, Sout3]. Equation (3) can be further expressed as:
| (4) |
The first and the second letters of double-letter terms in Eq. (4) stand for the state of PSG and PSA respectively. The solution of the equations that can be used to calculate individual Mueller matrix elements is displayed in Table 1 and these may be normalized by dividing by M 11.
Table 1. Solution of Eq. (4). The first and the second letters of the double-letter terms stand for the state of the PSG and PSA respectively. F + and F – are both replaced by F for convenience. F always refers to F + in the first letter position and F – in the second letter position.
| M11 = (HH + HV + VH + VV)/2; | M12 = (HH + HV-VH-VV)/2; | M13 = (FH + FV) - (HH + HV + VH + VV)/2; |
| M21 = (HH-HV + VH-VV)/2; | M22 = (HH-HV-VH + VV)/2; | M23 = (FH-FV) -(HH-HV + VH-VV)/2; |
| M31 = (HH + HV + VH + VV)/2-(HF + VF); | M32 = (HH + HV-VH-VV)/2-(HF-VF); | M33 = FH + FV + HF + VF–2FF–(HH + HV + VH + VV)/2; |
2.2 Analysis of polarimetric images
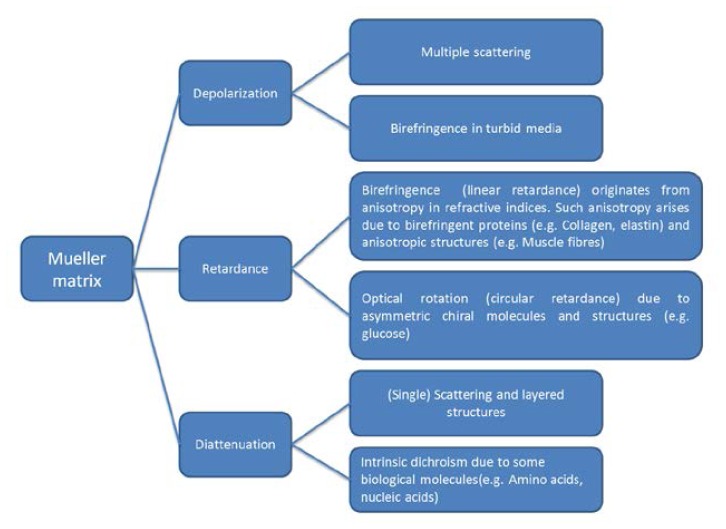
Lu and Chipman developed a method to interpret Mueller matrices in terms of diattenuation, depolarization and retardance including (linear) birefringence and optical rotation [16]. Diattenuation refers to the phenomenon that emergent light is dependent upon the polarization state of the incident light. In tissue it may arise due to single scattering, layered tissue structures and some dichroic molecules like amino acids and nucleic acids. The magnitude of diattenuation in tissues was reported as being negligible or much lower than the other two polarization phenomena in several publications [8, 9, 11, 27]. Tissue birefringence (linear retardance) originates from anisotropy in refractive indices. Such anisotropy arises due to birefringent proteins (e.g. collagen, elastin) and anisotropic structures (e.g. muscle fibres). Optical rotation (circular retardance) in tissue can be induced by asymmetric chiral molecules and structures (e.g. glucose) [11]. Depolarization caused by multiple scattering is the preeminent polarization effect in tissues and is sensitive to tissue absorption and scattering properties. Tissue birefringence may also induce depolarization [11, 28]. Figure 1 summarizes how polarimetry effects in tissues contribute to the decomposed basis matrices (depolarization, retardance, diattenuation).
Fig. 1.
How different polarimetry effects in tissues contribute to the decomposed basis matrices (depolarization, retardance, diattenuation).
Ghosh et al. indicated that the decomposition of a 3 × 3 Mueller matrix is also possible based on the assumption that the depolarization of linearly polarized light is not dependent upon the orientation angle of the incident polarization [17]. It is a safe assumption for turbid media like tissue where depolarization is mainly induced by multiple scattering [17]. Previous work has indicated that this assumption does not break down for birefringence induced depolarization based on experiments on birefringent and non-birefringent tissue phantoms as well as Monte Carlo simulations [29, 30]. In 3 × 3 Mueller matrix decomposition, the diattenuation matrix MD can intuitively be constructed from the first row of the Mueller matrix, and MD is a unit matrix for non-diattenuated samples. The residual matrix M’ comprises depolarization (MΔ) and retardance matrices (MR):
| (5) |
and
| (6) |
The superscript T of M’ in Eq. (6) represents matrix transpose. The eigenvalues of MΔR reveal the only unknown parameter Δ denoting polarization maintaining degree varying from 0 to 1 in MΔ and thus MΔ and MR can be solved. The depolarization power is (1-Δ) varying from 0 to 1. The phase retardance δ between fast and slow axis in birefringence can be determined from MR
| (7) |
Δ and cos(δ) can represent the depolarization and retardance properties and were used to reconstruct images in this paper.
2.3 Experimental Setup
Figure 2 shows the set-up for the multispectral polarimetric endoscopic system. The narrow-band illumination light source consists of a high pressure mercury lamp (Lumen 200Pro, Prior Scientific Ltd., Cambridge, UK) and a filter wheel with five 20 nm bandpass filters with centre wavelengths at 490, 546, 578, 628, and 678 nm (Semrock Inc. NY, USA). The light is delivered into the illumination channel of the laparoscope (10mm diameter Hopkins II, Karl Storz GmbH. Germany) via a liquid light guide. A ring shaped linear polarizing film (extinction ratio 9000:1, TECHSPEC, Edmunds Optics Ltd. York, UK) shown in Fig. 2(b) was covered on the top of the distal end of the illumination channel (double crescent shaped as displayed in Fig. 2(a)). A motorized rotation stage (Thorlabs Ltd., Ely, UK) rotated the entire endoscope as a PSG to generate 0° (H), 45° (F) and 90° (V) linear illumination polarization states. The PSA was a rotating filter wheel (Thorlabs Ltd. Ely, UK) containing three linear polarisers with their polarization orientations calibrated as 0° (H), −45° (F) and 90° (V). A mirror with identical reflectivity for p and s polarization was employed to align the PSG and PSA polarization coordinates. The rotation stage, analyser filter wheel, objective lens and a CCD (Retiga Exi, QImaging Inc., BC, Canada) were connected with lens tubes to guarantee alignment precision. A LabVIEW program synchronized the light source, rotation stage, analyser filter wheel and CCD, and reconstructed the 3 × 3 Mueller matrix images at the same time. A piece of white paper and a linear polarizer (TECHSPEC, Edmunds Optics Inc., USA) were used to validate the system. When the working distance (denoting the distance between the distal end of the endoscope and the imaging target) is 5 cm, the dimension of the field of view is 5.5 x 5.5 cm. Typical exposure time for one image was 0.2 s. It took the motorized rotator about 3 s to rotate 45° and requires 0.3 s for the filter wheel to switch the polarization analyzers. Thus the total (typical) acquisition time for one wavelength was 11.6 s. The acquisition time can be decreased using a better designed PSA, e.g. liquid crystal based PSA, non–sequential acquisition by using beam splitters and multiple cameras, etc.
Fig. 2.

Experimental set-up schematic. (a) View of the distal end of endoscope. (b) Ring shaped linear polarizing film covering illumination channel. (c) Side-view of the endoscope showing the PSA, CCD and multispectral light source.
2.4 Off axis correction
The length of the laparoscope is typically tens of centimeters. Since the rotation stage mounted the endoscope at the eyepiece, the optical axis on which the centre of the field of view (FOV) is did not coincide with rotating axis of the endoscope, neither was the centre of illumination field perfectly at the centre of the FOV due to a slight bend in the shaft of the laparoscope. These off-axis rotation effects led to translations of the FOV and field of illumination (FOI) with respect to the imaging target during generation of H, F and V polarized illumination.
Image registration normally used in computer vision and medical imaging to transform different sets of data into one coordinate system was required to correct translations of FOV under F and V illumination with respect to H. A simple linear translation of image coordinate systems acquired under F and V illumination to those under H illumination was conducted to guarantee the selected feature(s) like the profile of organs or the blood vessels on tissue overlaps.
Due to the slight bend in the shaft of the laparoscope the optical axis traces a circle about the axis of rotation during data acquisition (Fig. 3 ), meaning that the HX (including HH, HF, HV), FX (including FH, FF, FV) and VX (including VH, VF, VV) images are offset from each other. For a perfectly flat object perpendicular to the rotation axis this observed offset is constant across the field of view and can be corrected by a simple translation to register HX, FX and VX images. However, for non-flat objects, such as tissue, the observed offset will increase with distance from the laparoscope tip. For the set-up described here, the angular separation of the optical and rotation axes was estimated to be 3°. The variation in the observed offset, due to laparoscope rotation, with the surface relief (WL) can then be calculated as r + WL*tan(3°). Since the angle is small, this value will also be small as long as WL is within a couple of cm, which is the case when surveying the anatomical structures in this paper. For this reason, a simple translation operation was used to register the HX, FX and VX images. Current work involves investigations on how to improve this step further, including the use of deformable feature-based registration techniques [31, 32].
Fig. 3.

The schematic of off rotation axis effect
Having calibrated the FOV, the displacement of the FOI can be corrected by normalizing the images by their total reflectance under H, F, and V illumination respectively. If we assume the total reflectance under H, F, V illumination are identical, the derivation of the normalized Mueller matrix can be written as shown in Table 2 .
Table 2. Mueller Matrix reconstruction for non-diattenuated samples.
| M11 = (HH/(HV + HH) + HV/(HV + HH) + VH/(VH + VV) + VV/(VH + VV))/2; |
M12 = (HH/(HV + HH) + HV/(HV + HH)-VH/(VH + VV)-VV/(VH + VV))/2; |
M13 = (FH + FV)/(FH + FV)- M11; |
| M21 = (HH/(HV + HH) + HV/(HV + HH) + VH/(VH + VV)-VV/(VH + VV))/2; |
M22 = (HH/(HV + HH)-HV/(HV + HH)-VH/(VH + VV) + VV/(VH + VV))/ 2; |
M23 = (FH-FV)/(FH + FV)-M21; |
| M31 = HF/(HV + HH) + VF/(VH + VV))-M11; |
M32 = (HF/(HV + HH)-VF/(VH + VV))-M12; |
M33 = 2FF/(FH + FV)-M11-M13-M31; |
The correction applies when the sample does not demonstrate strong diattenuation, which is the case for a number of tissues [8, 9, 11, 27], as is discussed in section 2.2. The method in Table 1 can be used when this assumption breaks down.
3. Results and discussion
3.1 Validation experiment with a rotating linear polarizer target
The system was validated by rotating a linear polarizer target on top of a reflectance standard (Spectralon, Labsphere Inc., USA) from 0° to 360° with in 10° steps. The FOV were corrected with the method described in Section 2.4. Since the linear polarizer is diattenuated, the FOI could not be corrected so the equations in Table 1 were used and all the matrix elements were normalized by dividing M11. The modulated patterns of the Mueller matrix elements shown in Fig. 4(a) were obtained by processing a 30 × 30 pixel region in the centre of the FOV. The pattern demonstrates a good fit to the theoretical one [25], although errors and noise accumulate as the number of measurements increases. From Table 1, [M11, M12, M21, M22], [M13, M23, M31, M32], [M33] are acquired using four, six and eight measurements respectively. The number of measurements could be reduced to four, four and six if the F – analyzer is employed additionally whilst the acquisition time has to be sacrificed. Only three analyzers were used in this work for the purpose of minimizing the acquisition time. The Mueller matrix polarimetric images with the polarizer transmission axis approximately parallel and perpendicular to the system H axis are displayed in Fig. 4(b,c) . The distribution of M13, M23, M31, M32 values are not as constant as expected, which mainly results from uncorrected illumination displacements caused by the off-axis effects, and partly stems from divergent light beams emerging from the illumination fiber bundle since neither the polarizer used in the PSG nor the polarizer target are designed for divergent light. The typical value of error in each element was found to be between 1 and 5%.
Fig. 4.

(a) Reflected intensity from a reflectance standard through a linear polarizer test object rotated from 0° to 360°. Horizontal and vertical axes denote the orientations of the linear polarizer target and Mueller matrix element values respectively. (b) The Mueller matrix polarimetric images with the polarizer transmission axis approximately parallel and (c) perpendicular to the system H axis.
3.2 Validation experiment with a diffuse reflection target—white paper
The system was also validated with white paper as a diffuse reflection target. Both the FOV and FOI were corrected accordingly. Using the equations in Table 2, the 3 × 3 Mueller polarimetric images with the paper normal at 0° to the optical axis were been obtained and displayed in Fig. 5(a) . In order to analyse the images more intuitively, horizontal line profiles of the matrix elements were extracted and shown in Fig. 5(b). The Mueller matrix diagonal presented a diagonal form with M22 identical to M33, which indicates that the paper is a partial depolarizer rather than a Lambertian surface (perfect depolarizer) [33], and keeps the same depolarization power for linearly polarized illumination light with different orientations. The M22 and M33 value profiles are not flat but exhibit a peak at the central of the FOV (between the 350th and the 450th pixel). Three more experiments were conducted with the paper normal at 30°, 45°, 60° to the optical axis such as to investigate whether the peak originated from imperfectness of the imaging system. As the angle between the paper normal and the optical axis increases, the M22 and M33 profiles shift towards the right-hand side of the images, and for 45° and 60° the peaks are located beyond the FOV as shown in Fig. 5(a). This is coincident with the position where stronger specular reflections existed in addition to the diffuse reflectance. It is therefore hypothesised that the specular reflection causes the peaks in M22 (and M33) profile in Fig. 5(b) and the shift in Fig. 6(a) .
Fig. 5.
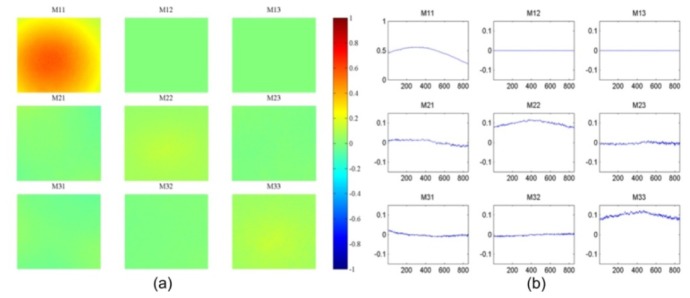
(a) The 3 × 3 Mueller polarimetric image with the paper normal at 0° to the optical axis; M11 is obtained by (HH + HV)/2 instead of the equation in Table 2. (b) A horizontal line profile of the matrix elements. The horizontal axis in the graph represents the horizontal positions of pixels.
Fig. 6.
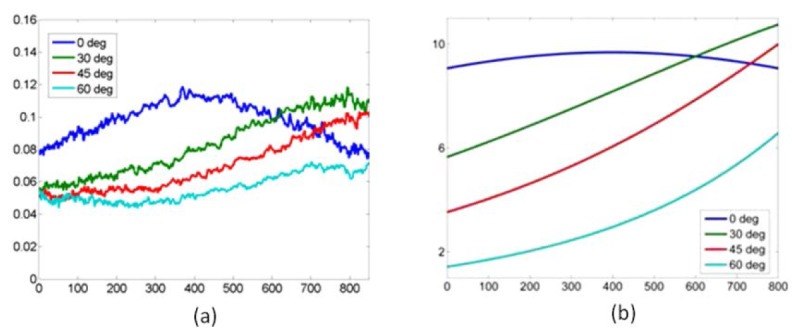
(a) Experimental M22 profiles with the paper normal at 0°, 30°, 45, 60° to the optical axis. (b) Simulated M22 profiles likewise. The horizontal axes represent the pixel number. In (a), the values on vertical axis denote M22 (and M33). In (b), the values displayed on vertical axis are arbitrary because the equations in Appendix were derived based on direct proportionality.
Since we know that the white paper maintains the same depolarization power for linearly polarized illumination light with different orientations, the origin of M22 (and M33) can be considered as the mean difference between co-polarized and cross-polarized signals according to Table 1 and Table 2. Specular reflection is co-polarized with the illumination and would be rejected in cross-polarized signals. Therefore, for the white paper, specular reflection normalized by illumination intensity is equivalent to M22 (and M33). The specular reflection term in a Phong model [34] was employed to simulate the specular reflection from the white paper in order to estimate the M22 profile across the FOV. The model was extended from collimated illumination to a point light source in the Appendix so that the ring shape illumination of the endoscope can be represented as the combination of a pair of spatially symmetrical point light sources. From Eq. (10) in the Appendix, the estimated M22 and M33 profiles were obtained and presented in Fig. 6(b). The peak in the profile with the paper normal 0° to the optical axis and similar shifts during rotation demonstrated in Fig. 6(a) can be observed, which confirm the peaks in profiles of M22 and M33 are caused by specular reflection rather than any artefacts of the system.
3.3 Ex vivo rat tissue experiment
Measurements of tissue were conducted ex vivo on a Sprague-Dawley rat after the abdomen had been exposed by a midline incision 0.5 hour post mortem. The rat was laid in the supine position on the laboratory bench and the abdominal wall was splayed open to display the abdominal contents. As displayed in Fig. 7 , three regions of the rat abdomen including small bowel, large bowel, stomach, liver and fat were imaged with the system. The FOV were corrected via image registration based on the features of the blood vessel patterns or the profiles of the organs. The equations in Table 2 were used to reconstruct Mueller matrix images assuming that the diattenuation of the samples is weak. The results obtained at two typical wavelengths, 546 nm where haemoglobin demonstrates strong absorption, and 628 nm where most of tissue absorbs light more weakly, were selected from the five illumination wavelengths for the display of the results in this paper. As a part of validation work of this system, differences among organs were expected to be observed in Mueller matrix images due to various absorption and scattering properties as well as morphological, structural and compositional differences.
Fig. 7.

The photographs (represented by HV images at 546 nm) of the three regions in the rat abdomen including small bowel (red arrows), large bowel (green arrows), stomach (purple arrows), liver (white arrows) and fat (blue arrows) imaged with the system. (a) Region 1; (b) Region 2; (c) Region 3.
Since the raw images suffer from specular highlights as shown in Fig. 8(a) which would result in distracting artefacts in Mueller matrix images, a frequently-used image processing method was employed to remove specular highlights. The highlights were first detected by thresholding the image gray level and further dilated to include surrounding bright dots where there also exists specular reflection with relatively low intensity [34]. As demonstrated in Fig. 8(b), the detected regions were indicated by the region enclosed by the blue line, but the areas enclosed by green lines were exempted. They were inpainted based on the method proposed by Telea [35]. Local median filtering was finally applied to deal with the bright edges between the inpainted regions and normal regions. One of processed images is displayed in Fig. 8(c). It is noted not all the pixels affected by specular reflection can be detected, since the intensity of specular and non-specular components can be at the same level and mixed for some pixels. Digital inpainting is also not able to recover the exact real values of these regions. This method is employed solely to reduce the visually distracting effect of erroneous Mueller matrix values in these strong specular reflection regions.
Fig. 8.

An example is presented to show how specular highlights were removed. (a) a raw image of Region 2suffering from specular highlights; (b) The specular highlight regions are detected and dilated, and are indicated by the region enclosed by blue line, but the areas enclosed by green lines are exempted; (c) The inpainted images after local median filtering.
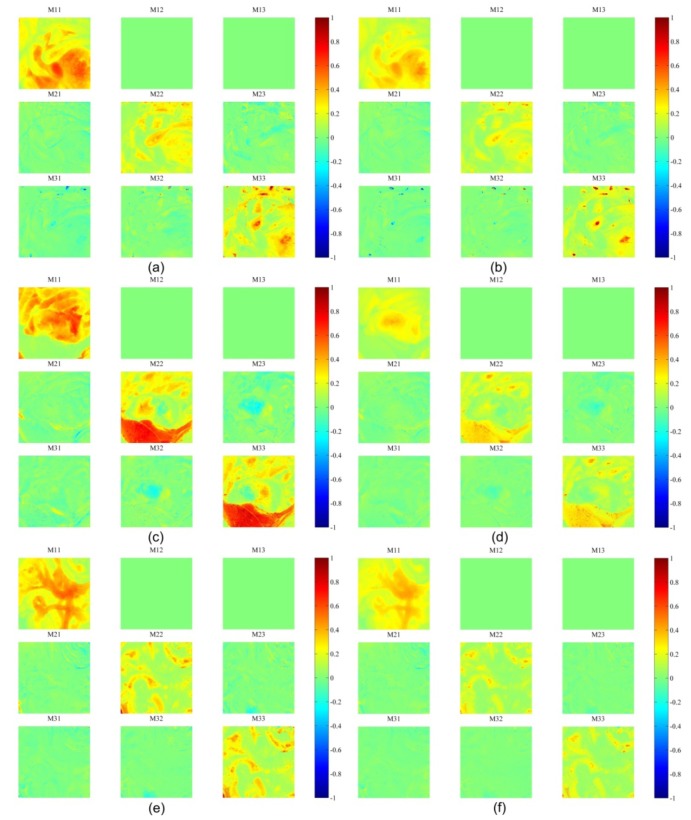
In Fig. 9 , the obtained Mueller matrices for most of the organs are essentially diagonal with M22 equal to M33, which were also observed by Angelo Pierangelo et al. [8, 27], which suggested that the depolarization property of tissue is dominant compared to the retardance and diattenuation. Most of the organs demonstrate different Mueller matrices as the illumination wavelengths varied. In order to investigate them quantitatively, Mueller matrices are further decomposed into retardance and depolarization.
Fig. 9.
Mueller polarimetric images of Region 1 at (a) 546 nm and (b) 628 nm respectively; Region 2 at (c) 546nm and (d) 628nm respectively; Region 3 at (e) 546 nm and (f) 628nm respectively;
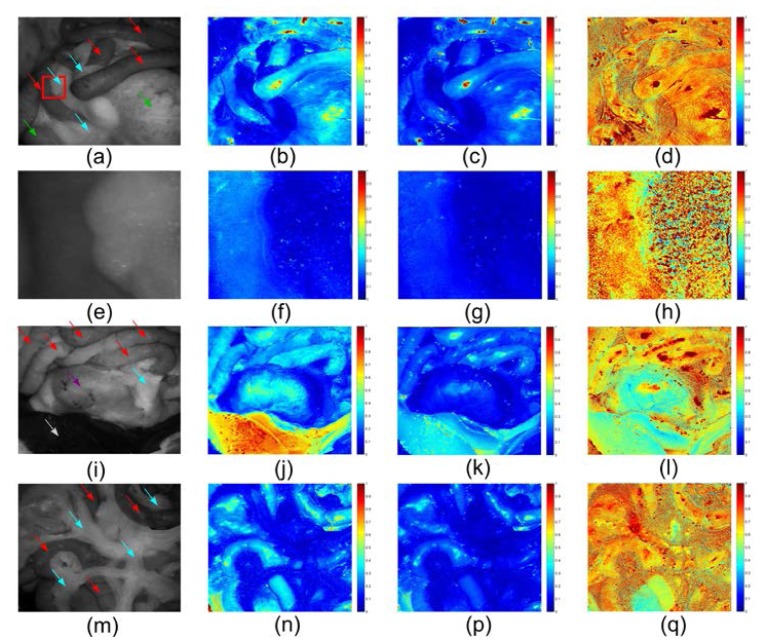
Depolarization images were reconstructed upon the parameter Δ that can be considered as polarization maintaining degree. (1- Δ) is called depolarization rate or depolarization power. Δ is called polarization maintaining power in this paper. It was obtained from the depolarization matrix by Mueller matrix decomposition, and varies from 0 to 1, as is stated in section 2.2. In Fig. 10 (b,c) , Δ of the small and large bowel appears to be the same at around 0.3 at 546 nm and 0.2 at 628 nm. The ratio between 628 nm and 546 nm is 0.7 from the depolarization ratiometric image in Fig. 10(d), which reveals the spectral features of the absorbers in bowel. Δ of fat approaches 0.1 at either wavelength. Since the fat does not contain many strong absorbers at both wavelengths, the absorption of the fat is weakest among the imaged organs so depolarized multiple scattering photons are the most dominant in total reflectance resulting in a small Δ both at 546 nm and 628 nm. Because the difference in absorption properties between the fat and the bowel is more significant at 546 nm (Fig. 10(b)) than that at 628 nm (Fig. 10(c)), the bowel can be better resolved from the fat in the depolarization images. The fat also demonstrates distinguished heterogeneity from other organs in the ratiometric depolarization images (fourth column in Fig. 10), which might be caused by different scattering properties originated from the fluctuating superficial structures of the fat. However, it is also possible that Δ of fat at both wavelengths are small (≤ 0.1) and identical, thus resulting in a numerical heterogeneity, revealing the spectral features of the depolarization of fat. In Fig. 10(h), the heterogeneity of the fat can be clearly observed and provide contrast from bowel.
Fig. 10.
Depolarization images. The images in the first column are raw images with small bowel (red arrows), large bowel (green arrows), stomach (purple arrows), liver (white arrows) and fat (blue arrows) indicated. The second, third and fourth columns are depolarization images with 546 nm illumination, depolarization images with 628 nm illumination and depolarization ratiometric images (628 nm/546 nm) respectively. (a-d) are the images for Region 1. A region of interest is indicated by a red box in (a), magnified and presented in (e-h), the left and right part of which is small bowel and fat respectively. (i-l) are the images for Region 2. (m-q) are the images for Region 3.
In contrast to the fat, the liver exhibits remarkably high Δ values especially at 546 nm (Fig. 10(j)). As the liver contains the most blood of all the imaged organs, the majority of multiply scattered photons undergo strong absorption by haemoglobin at this wavelength. The polarized singly scattered photons take up the largest portion of total reflectance and hence the liver presents a higher Δ value. In contrast, since haemoglobin does not absorb at 628 nm as much as it does at 546 nm, the polarized photons can be further depolarized and backscattered by deeper tissue resulting in a higher depolarization power (corresponding to a lower Δ). The depolarization properties of stomach do not show a huge difference from bowel in Fig. 10(j,k). However, the ratiometric image (Fig. 10(l)) reveals that the spectral features of stomach are more similar to the liver rather than the bowel which indicates that haemoglobin absorption in stomach determines the depolarization property. Figure 10 (m,n,p,q) confirms that the parameter Δ and the ratiometric depolarization of fat and small bowel are reproducible.
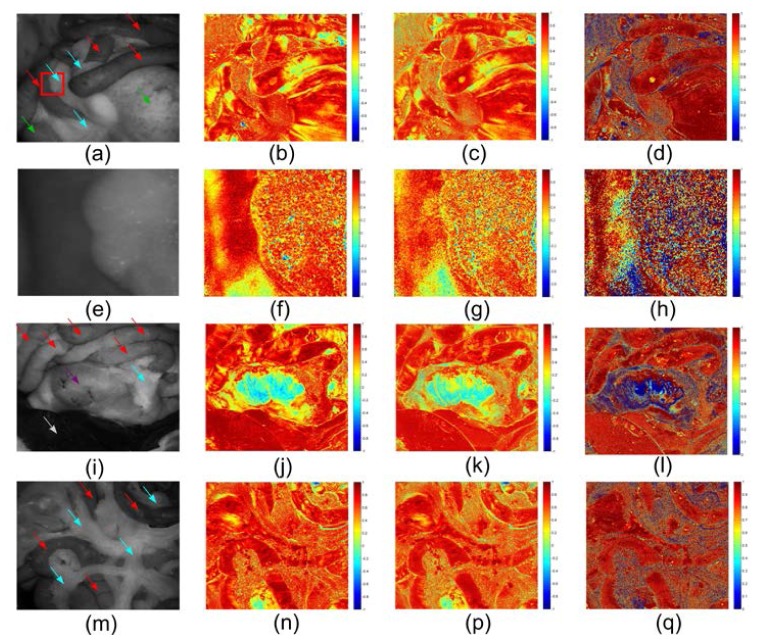
Derived linear retardance cos(δ) images are demonstrated in Fig. 11 . As predicted, generally neither the spatial nor spectral contrast among the organs is as pronounced as in the depolarization images. The bowel and the liver can hardly be discriminated. One exception is stomach as shown in Fig. 11(j,k,l), and this distinguished retardance might be related to the very thick muscular layer in stomach which is birefringent and diattuanted. Heterogeneity of fat is observed again not only in ratiometric images, but also in raw retardance images, which is also able to provide some contrast between fat and non fat tissue.
Fig. 11.
Retardance images. The images in the first column are raw images with small bowel (red arrows), large bowel (green arrows), stomach (purple arrows), liver (white arrows) and fat (blue arrows) indicated. The second, third and fourth column are retardance images with 546 nm illumination, retardance images with 628 nm illumination and retardance ratiometric images (628 nm/546 nm) respectively. (a-d) are the images for Region 1. (e-h) are zoomed images of a region of interest in (a) indicated by a red box, the left and right part of which is small bowel and fat respectively. (i-l) are the images for Region 2. (m-q) are the images for Region 3.
4. Conclusions
In this work, a design of narrow-band 3 × 3 Mueller matrix polarimetric imaging in a rigid endoscope avoiding any complicated miniaturizations was proposed. The system was validated using a rotating linear polarizer and a diffuse reflection target, quantifying polarization properties using the matrix polar decomposition approach. Initial results in an ex vivo animal trial show that the system can distinguish different tissues based on their composition and structure. Multispectral operation allows detection of features related to absorption of light in different bands in addition to scattering-related contrast due to depolarization and changes in retardance due to birefringent connective tissue. These results show the potential of the system in tissue characterization, which may be applied to detect specific pathologies, such as cancerous lesions, which would otherwise be difficult to visualize under normal white light illumination and detection. Future work will involve optimisation of the system to minimise alignment and registration errors, and acquisition of in vivo data.
Acknowledgments
Funding for this project was provided by ERC grant 242991. Ji Qi acknowledges support from the China Scholarship Council. We would like to thank Ms. Wendy Steel, Mr. Edgar Ibarguen and Ms. Helen Goyal at CBS unit of Imperial College London for their assistance with the animal model preparation. The authors also thank Karl Storz GmbH for assistance with the rigid endoscope.
Appendix: Specular reflection on a flat rough surface
The Phong model is widely used in computer graphics to simulate local illumination of points on a surface owing to its computational convenience. Local illumination in the model is considered as a combination of the diffuse reflection from rough surfaces with the specular reflection from part of microfacets [34]. The specular reflection term in Phong model was extended from a point light source rather than collimated one so that the ring shape illumination can be represented as the combination of a pair of spatially symmetrical point light sources.
As demonstrated in Fig. 12
Fig. 12.
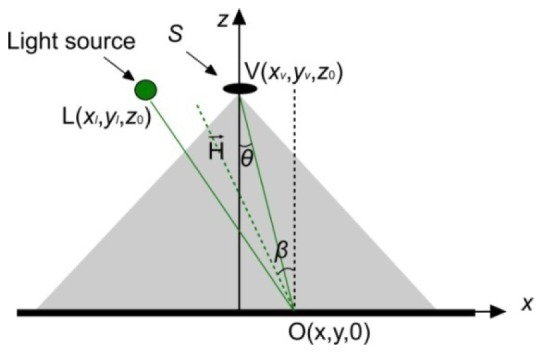
Specular reflection induced by a spot light source on a rough surface.
, a Cartesian coordinates where the object plane and optical axis were x-y plane and z axis were initially set up. The origin of the coordinates was the projection of the centre of the entrance pupil onto the object plane. An object spot is O (x, y, 0), and a spot light source L located at (xl, yl, z 0) that is a constant. The position of a point inside the entrance pupil was expressed as V (xv, yv, z 0). and denote the light source vector (L-O) and the viewer vector (V-O). According to Phong model and photometry [36], the intensity of the specular reflection I induced by a spot light source can be written as:
| (8) |
where I 0(x,y) is the illumination intensity, dS refers to the area element inside the entrance pupil, n is the Phong parameter characterizing the roughness of the surface, β denotes the angle between surface normal and halfway vector between the viewer and light-source vectors, and θ represents the angle between the optical axis and the viewer vector [34, 37, 38]. These angles can be derived from and , the unit vector of and and are displayed below,
In this work, the ring fibre bundle delivered illumination was simplified as two illumination fibres with numerical aperture 0.28 symmetrical to the centre of entrance pupil of the laparoscope as shown in Fig. 13
Fig. 13.
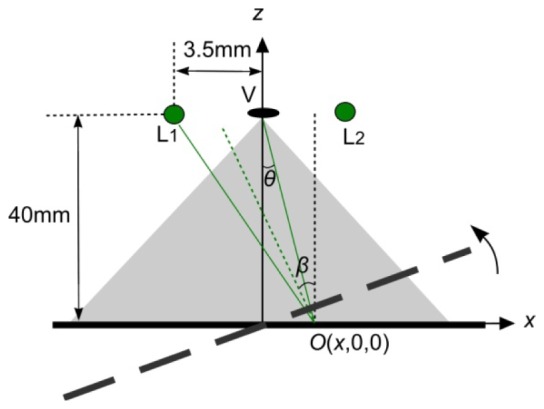
Specular reflection analysis. Two green spots denotes the end of illumination fibers symmetrical to the centre of entrance pupil of the laparoscope. The separation between the centre of entrance pupil is measured as 3.5 mm. The working distance of the endoscope is set as 40 mm.
. Therefore the specular reflection is the linear superposition of the following expression:
| (9) |
Where I 0(x,y) is the illumination intensity that is proportional to the total reflectcance. For a piece of paper or cardboard the Phong parameter n is equal to 0 or 1 [39]. It is estimated as 1 in this simulation. The distal ends of the fibres are located 3.5 mm away from the centre of the pupil centre. The distance is estimated as 40mm. Since the entrance pupil is far smaller than the and and correspond to a very small variation of θ and β, it is safe to use the intensity at the pupil centre to estimate the specular reflection from the rough and flat surface in order to simplify the simulation. The specular component over the total reflectance is thus simplified into
| (10) |
The surface is rotated an acute angle anti-clockwisely along the axis via the projection of the centre of the entrance pupil and perpendicular to the paper plane accordingly. The results are displayed in Fig. 6(b).
References and links
- 1.Jacques S. L., Ramella-Roman J. C., Lee K., “Imaging skin pathology with polarized light,” J. Biomed. Opt. 7(3), 329–340 (2002). 10.1117/1.1484498 [DOI] [PubMed] [Google Scholar]
- 2.Backman V., Gurjar R., Badizadegan K., Itzkan I., Dasari R. R., Perelman L. T., Feld M. S., “Polarized light scattering spectroscopy for quantitative measurement of epithelial cellular structures in situ,” IEEE J. Sel. Top. Quantum Electron. 5(4), 1019–1026 (1999). 10.1109/2944.796325 [DOI] [Google Scholar]
- 3.Qi J., Barrière C., Wood T. C., Elson D. S., “Polarized multispectral imaging in a rigid endoscope based on elastic light scattering spectroscopy,” Biomed. Opt. Express 3(9), 2087–2099 (2012). 10.1364/BOE.3.002087 [DOI] [PMC free article] [PubMed] [Google Scholar]
- 4.Morgan S. P., Stockford I. M., “Surface-reflection elimination in polarization imaging of superficial tissue,” Opt. Lett. 28(2), 114–116 (2003). 10.1364/OL.28.000114 [DOI] [PubMed] [Google Scholar]
- 5.Da Silva A., Deumié C., Vanzetta I., “Elliptically polarized light for depth resolved optical imaging,” Biomed. Opt. Express 3(11), 2907–2915 (2012). 10.1364/BOE.3.002907 [DOI] [PMC free article] [PubMed] [Google Scholar]
- 6.Demos S., Radousky H., Alfano R., “Deep subsurface imaging in tissues using spectral and polarization filtering,” Opt. Express 7(1), 23–28 (2000). 10.1364/OE.7.000023 [DOI] [PubMed] [Google Scholar]
- 7.Alali S., Ahmad M., Kim A., Vurgun N., Wood M. F. G., Vitkin I. A., “Quantitative correlation between light depolarization and transport albedo of various porcine tissues,” J. Biomed. Opt. 17(4), 045004(2012). 10.1117/1.JBO.17.4.045004 [DOI] [PubMed] [Google Scholar]
- 8.Pierangelo A., Benali A., Antonelli M.-R., Novikova T., Validire P., Gayet B., De Martino A., “Ex-vivo characterization of human colon cancer by Mueller polarimetric imaging,” Opt. Express 19(2), 1582–1593 (2011). 10.1364/OE.19.001582 [DOI] [PubMed] [Google Scholar]
- 9.Antonelli M.-R., Pierangelo A., Novikova T., Validire P., Benali A., Gayet B., De Martino A., “Mueller matrix imaging of human colon tissue for cancer diagnostics: how Monte Carlo modeling can help in the interpretation of experimental data,” Opt. Express 18(10), 10200–10208 (2010). 10.1364/OE.18.010200 [DOI] [PubMed] [Google Scholar]
- 10.Anastasiadou M., Martino A. D., Clement D., Liège F., Laude-Boulesteix B., Quang N., Dreyfuss J., Huynh B., Nazac A., Schwartz L., Cohen H., “Polarimetric imaging for the diagnosis of cervical cancer,” Phys. Status Solidi 5(5c), 1423–1426 (2008). 10.1002/pssc.200777805 [DOI] [Google Scholar]
- 11.Ghosh N., Vitkin I. A., “Tissue polarimetry: concepts, challenges, applications, and outlook,” J. Biomed. Opt. 16(11), 110801 (2011). 10.1117/1.3652896 [DOI] [PubMed] [Google Scholar]
- 12.Maitland D. J., Walsh J. T., Jr, “Quantitative measurements of linear birefringence during heating of native collagen,” Lasers Surg. Med. 20(3), 310–318 (1997). [DOI] [PubMed] [Google Scholar]
- 13.Park B. H., Saxer C., Srinivas S. M., Nelson J. S., de Boer J. F., “In vivo burn depth determination by high-speed fiber-based polarization sensitive optical coherence tomography,” J. Biomed. Opt. 6(4), 474–479 (2001). 10.1117/1.1413208 [DOI] [PubMed] [Google Scholar]
- 14.Manhas S., Swami M. K., Patel H. S., Uppal A., Ghosh N., Gupta P. K., “Polarized diffuse reflectance measurements on cancerous and noncancerous tissues,” J Biophotonics 2(10), 581–587 (2009). 10.1002/jbio.200810065 [DOI] [PubMed] [Google Scholar]
- 15.Wood M. F. G., Ghosh N., Wallenburg M. A., Li S.-H., Weisel R. D., Wilson B. C., Li R.-K., Vitkin I. A., “Polarization birefringence measurements for characterizing the myocardium, including healthy, infarcted, and stem-cell-regenerated tissues,” J. Biomed. Opt. 15(4), 047009 (2010). 10.1117/1.3469844 [DOI] [PubMed] [Google Scholar]
- 16.Lu S.-Y., Chipman R. A., “Interpretation of Mueller matrices based on polar decomposition,” J. Opt. Soc. Am. A 13(5), 1106–1113 (1996). 10.1364/JOSAA.13.001106 [DOI] [Google Scholar]
- 17.Swami M. K., Manhas S., Buddhiwant P., Ghosh N., Uppal A., Gupta P. K., “Polar decomposition of 3 x 3 Mueller matrix: a tool for quantitative tissue polarimetry,” Opt. Express 14(20), 9324–9337 (2006). 10.1364/OE.14.009324 [DOI] [PubMed] [Google Scholar]
- 18.Shukla P., Pradhan A., “Mueller decomposition images for cervical tissue: Potential for discriminating normal and dysplastic states,” Opt. Express 17(3), 1600–1609 (2009). 10.1364/OE.17.001600 [DOI] [PubMed] [Google Scholar]
- 19.Macdonald C., Meglinski I., “Backscattering of circular polarized light from a disperse random medium influenced by optical clearing,” Laser Phys. Lett. 8(4), 324–328 (2011). 10.1002/lapl.201010133 [DOI] [Google Scholar]
- 20.Jiao S., Wang L. V., “Jones-matrix imaging of biological tissues with quadruple-channel optical coherence tomography,” J. Biomed. Opt. 7(3), 350–358 (2002). 10.1117/1.1483878 [DOI] [PubMed] [Google Scholar]
- 21.Wood T. C., Elson D. S., “Polarization response measurement and simulation of rigid endoscopes,” Biomed. Opt. Express 1(2), 463–470 (2010). 10.1364/BOE.1.000463 [DOI] [PMC free article] [PubMed] [Google Scholar]
- 22.N. T. Clancy and D. S. Elson, “Narrowband polarisation endoscopy with LED illumination,” presented at OSA/SPIE European Conferences on Biomedical Optics, Munich, Germany, 12–16 May 2013. [Google Scholar]
- 23.Thekkek N., Pierce M. C., Lee M. H., Polydorides A. D., Flores R. M., Anandasabapathy S., Richards-Kortum R. R., “Modular video endoscopy for in vivo cross-polarized and vital-dye fluorescence imaging of Barrett’s-associated neoplasia,” J. Biomed. Opt. 18(2), 026007 (2013). 10.1117/1.JBO.18.2.026007 [DOI] [PMC free article] [PubMed] [Google Scholar]
- 24.J. Qi, D. S. Elson, and C. Barriere, “Polarized Multispectral Imaging in a Rigid Endoscope Based on Polarized Light Scattering Spectroscopy,” (Optical Society of America, 2012), p. BW4B.7. [DOI] [PMC free article] [PubMed] [Google Scholar]
- 25.Bickel W. S., Bailey W. M., “Stokes vectors, Mueller matrices, and polarized scattered light,” Am. J. Phys. 53(5), 468–478 (1985). 10.1119/1.14202 [DOI] [Google Scholar]
- 26.E. W. Cheney and D. R. Kincaid, Numerical mathematics and computing (Brooks/Cole, 2012). [Google Scholar]
- 27.Pierangelo A., Manhas S., Benali A., Fallet C., Totobenazara J.-L., Antonelli M.-R., Novikova T., Gayet B., De Martino A., Validire P., “Multispectral Mueller polarimetric imaging detecting residual cancer and cancer regression after neoadjuvant treatment for colorectal carcinomas,” J. Biomed. Opt. 18(4), 046014–046014 (2013). 10.1117/1.JBO.18.4.046014 [DOI] [PubMed] [Google Scholar]
- 28.V. V. Tuchin, L. V. Wang, and D. A. Zimnyakov, Optical polarization in biomedical applications (Springer, 2006). [Google Scholar]
- 29.Ghosh N., Wood M. F., Vitkin I. A., “Mueller matrix decomposition for extraction of individual polarization parameters from complex turbid media exhibiting multiple scattering, optical activity, and linear birefringence,” J. Biomed. Opt. 13(4), 044036 (2008). 10.1117/1.2960934 [DOI] [PubMed] [Google Scholar]
- 30.Ghosh N., Wood M. F. G., Li S. H., Weisel R. D., Wilson B. C., Li R.-K., Vitkin I. A., “Mueller matrix decomposition for polarized light assessment of biological tissues,” J Biophotonics 2(3), 145–156 (2009). 10.1002/jbio.200810040 [DOI] [PubMed] [Google Scholar]
- 31.N. T. Clancy, V. Sauvage, S. Saso, D. Stoyanov, D. J. Corless, M. Boyd, D. Noakes, G.-Z. Yang, S. Ghaem-Maghami, and J. R. Smith, “Registration and analysis of multispectral images acquired during uterine transplantation surgery,” in Biomedical Optics(Optical Society of America, 2012). [DOI] [PubMed] [Google Scholar]
- 32.D. Stoyanov, A. Rayshubskiy, and E. Hillman, “Robust registration of multispectral images of the cortical surface in neurosurgery,” in Biomedical Imaging (ISBI), 2012 9th IEEE International Symposium on(IEEE, 2012), pp. 1643–1646. 10.1109/ISBI.2012.6235892 [DOI] [Google Scholar]
- 33.Pierangelo A., Manhas S., Benali A., Fallet C., Antonelli M.-R., Novikova T., Gayet B., Validire P., De Martino A., “Ex vivo photometric and polarimetric multilayer characterization of human healthy colon by multispectral Mueller imaging,” J. Biomed. Opt. 17(6), 066009 (2012). 10.1117/1.JBO.17.6.066009 [DOI] [PubMed] [Google Scholar]
- 34.Phong B. T., “Illumination for computer generated pictures,” Commun. ACM 18(6), 311–317 (1975). 10.1145/360825.360839 [DOI] [Google Scholar]
- 35.Telea A., “An image inpainting technique based on the fast marching method,” Journal of Graphics Tools 9(1), 23–34 (2004). 10.1080/10867651.2004.10487596 [DOI] [Google Scholar]
- 36.M. Bass, Handbook of optics. Vol. 2, Devices, measurements, and properties (McGraw-Hill, 1995). [Google Scholar]
- 37.B. Walter, S. R. Marschner, H. Li, and K. E. Torrance, “Microfacet models for refraction through rough surfaces,” in Proceedings of the 18th Eurographics conference on Rendering Techniques(Eurographics Association, 2007), pp. 195–206. [Google Scholar]
- 38.J. F. Blinn, “Models of light reflection for computer synthesized pictures,” in ACM SIGGRAPH Computer Graphics(ACM, 1977), pp. 192–198. [Google Scholar]
- 39. http://www.siggraph.org/education/materials/HyperGraph/illumin/specular_highlights/phong_model_specular_reflection.htm


