Abstract
We demonstrate a cytotoxicity evaluation of tissue adhesive using Raman spectroscopy. This method allows for quantitative, label-free, non-invasive and rapid monitoring of the biochemical changes of cells following tissue adhesive treatment. Here, we show the biochemical property changes in mouse fibroblast L929 cells and cellular DNA following tissue adhesive (Dermabond) treatment using Raman spectroscopy. The Raman band intensities were significantly decreased when the cells were treated with Dermabond as compared to control cells. These results suggest denaturation and conformational changes in proteins and degradation of DNA related to cell death. To support these conclusions, conventional cytotoxicity assays such as WST, LIVE/DEAD, and TUNEL were carried out, and the results were in agreement with the Raman results. Thus, Raman spectroscopy analysis not only distinguishes between viable and damaged cells, but can also be used for identification and quantification of a cytotoxicity of tissue adhesive, which based on the cellular biochemical and structural changes at a molecular level. Therefore, we suggest that this method could be used for cytotoxic evaluation of tissue adhesives by rapid and sensitive detection of cellular changes.
OCIS codes: (300.6450) Spectroscopy, Raman; (170.0170) Medical optics and biotechnology; (170.5660) Raman spectroscopy; (170.1530) Cell analysis
1. Introduction
Cyanoacrylate (CA) usage in clinical applications is very promising. CA has been used successfully in surgical settings to replace traditional suturing techniques and for the control of hemorrhage [1–3]. Furthermore, its potential benefits include better cosmetic outcomes, effective operative times, rapid wound closure and reduction in the risk of transmission of infectious diseases [4]. However, the use of CA as an adhesive, particularly within tissue, is limited by its toxicity, which is attributed to compounds such as cyanoacetate and formaldehyde [5].
For medical applications of a tissue adhesive, it must be non-toxic and have no harmful side effects at the application site or surrounding tissues. Therefore, assessment of the cell viability and cytotoxicity is a necessary step in the evaluation of biocompatibility of a tissue adhesive for use in medical applications. An accurate and precise cytotoxicity assay can reduce the number of animal studies needed for this process by providing rapid and relatively low-cost screening of large numbers samples.
Most biological cytotoxicity assay methods are very time-consuming and labor-intensive, with complicated procedures and large amounts of material required, and result in low product yield. Furthermore, for fluorescence-based methods, broad emission spectra from molecular fluorophores make multiplexing impossible, and the disadvantage of their susceptibility to photobleaching may greatly weaken their detection limits.
In contrast, Raman spectroscopy for biomolecules to detect cytotoxic responses can overcome some of the limitations of fluorescence spectroscopy in terms of photostability and spectral multiplexing. Raman spectroscopy has attracted great interest as a powerful analytical tool that can be used to detect changes in the structure and composition of analytes at the molecular level [6–10]. It also provides quantitative information, together with high sensitivity and selectivity. This technology also presents several advantages, such as non-invasive, rapid detection, and does not require the use of labels to study biologically relevant molecules. The intracellular information about nucleic acids, proteins and other components, as well as their conformation, can be probed using variations in spectral shape or intensity [11–15]. Therefore, Raman spectroscopy can distinguish between samples, and has been explored for the analysis of disease with multivariate statistical analysis, which has shown high sensitivity and specificity for diagnostic applications [16–19]. More recently, Huang et al. employed a novel image-guided Raman endoscopy technique developed for the Raman measurement of in vivo gastric tissue within 0.5 sec during clinical endoscopic examination [20]. This work proves that fiber-optic Raman spectroscopy is a sensitive biomolecular probe for monitoring intestinal-type gastric carcinogenesis to realize early diagnosis and detection of precancer and early gastric cancer in vivo during clinical endoscopic examination.
The potential of Raman spectroscopy for the analysis of effects of external agents (anti-cancer drugs, nanoparticles and CNT) on the cell has been demonstrated [21–26]. Candeloro et al. reported the cytotoxic effects of Ag and Fe3O4 nanoparticles on HeLa cells using Raman spectroscopy [27]. This technique has been proposed as a method for rapid detection of toxic agents, identification of the type of toxin and prediction of the concentration used.
In this study, we investigated biochemical property changes at a molecular level in mouse fibroblast L929 cells and cellular DNA following exposed to tissue adhesive (commercial CA tissue adhesive, Dermabond) using Raman spectroscopy. In addition, we examined the correlation between the Raman data and the results from conventional cytotoxicity assays to determine cell viability and DNA damage. The results demonstrated that this method provides a more sensitive and faster detection of cytotoxicity from tissue adhesive exposure than conventional cytotoxicity assays.
2. Materials and method
2.1. Cell line and culture
Mouse L929 fibroblasts (Korea Cell Line Bank, NCTC clone 929, Seoul, South Korea) were grown in RPMI 1640 (GIBCO, Grand Island, NY, USA) supplemented with 300 mg/ml L-glutamate, 25 mM HEPES, 25 mM NaHCO3, 10% fetal bovine serum, 50 µg/µl gentamicin, 500 U/ml penicillin and 500 mg/ml streptomycin at 37 °C in a 5% CO2 incubator.
2.2. Isolation of deoxyribonucleic acid (DNA)
For analysis of DNA using Raman spectroscopy, after a 24 hr Dermabond exposure, cells were harvested by trypsinization and washed once in PBS. DNA preparation was performed using the High Pure PCR Template Preparation Kit (Roche, C.N. 1179688001). The Elution buffer was pre-warmed to 70 °C. 200 µl of sample material was added to 200 µl Binding buffer with 40 µl proteinase K. The combination was mixed immediately and incubated at 70 °C for 10 min. After adding 100 µl isopropanol, the suspension was mixed properly and the sample was loaded into a High Filter tube. After centrifugation, the High Filter tube was combined with a new collection tube and 500 µl of Inhibitor Removal buffer was added. Centrifugation was performed again, followed by two washes with 500 µl of Wash buffer each. Pre-warmed Elution buffer was added in order to elute the DNA and then the tube was centrifuged for 1 min at 8000g. DNA concentration was calculated using a Nano-100 Micro-spectrophotometer (Allsheng, Hangzhou City, China).
2.3. Cytotoxicity testing
2.3.1. WST assay
Mouse L929 fibroblasts (1 × 10⁵ cells) were seeded in 12-well plates and incubated for 24 hr to examine cell cytotoxicity. The cells were treated with Dermabond by direct contact. Half the maximal inhibitory concentration (IC50) for Dermabond is 5 µl/105 cells. Dermabond was placed at the edge of the 12-well plates and the plates were further incubated at 37 °C in a 5% CO2 incubator. After the 24 hr incubation, cell cytotoxicity was measured using a Cell counting-8 kit (Sigma Aldrich, St. Louis, MO, USA). The OD450 was recorded utilizing a Synergy HT multi-mode microplate instrument (BioTek, Winooski, VT, USA).
2.3.2. LIVE/DEAD viability/cytotoxicity assay
A two-color fluorescent cell cytotoxicity assay was used to confirm the results obtained from the colorimetric cell viability assay. A LIVE/DEAD viability/cytotoxicity kit was purchased from Molecular Probes (Eugene, OR, USA). After a 24 hr tissue adhesive exposure, cells were incubated with a mixture of 8 µM ethidium homodimer and 2 µM calcein acetoxymethyl in PBS for 30~45 min at room temperature. Images were collected using a Zeiss LSM-700 confocal microscopy system (Thornwood, NY, USA). The number of viable (green) and non-viable (red) cells were counted manually from the images.
2.3.3. TUNEL assay
For detection of cell death, the TUNEL assay was performed in both control and Dermabond-treated L929 cells using a DeadEnd Fluorometric TUNEL System. Briefly, the cells were immersed and fixed in 4% paraformaldehyde in PBS at 4°C and then were permeabilized with a 70% ice-cold ethanol at −20°C for 5 min. The cells were centrifuged at 300 g for 10 min. After the washed two times with PBS, positive control was prepared by treating the cells DNase I. The cells were pre-incubated with equilibration buffer. After centrifugation, cells were resuspended in rTdT reaction mix and incubated in a 37°C water bath for 60 minutes while protected from exposure to direct light. The reaction was terminated with 20 mM EDTA and cells were washed two times with 0.1% Triton X-100 solution in PBS containing 5mg/ml BSA. The cell pellet was resuspended in 7-Aminoactinomycin D ( 7 - AAD ) solution and incubated at room temperature for 30 minutes in the dark. Cells were analyzed by FACSCalibur using the CellQuest software (BD Biosciences, San Jose, CA, USA).
2.4. Raman spectroscopic measurements
For Raman analysis of cells, cells were seeded in gold-coated substrates and incubated for 24 hr. The cells were treated with Dermabond (5 µl/105 cells) and then further incubated for 24 hr. The cells were washed twice with filtered PBS and fixed for 20 min in 4% paraformaldehyde in PBS at 4 °C, followed by a final wash with 5 ml PBS. In order to minimize spectral contributions from the sample substrate, we used gold-coated substrate. Pure metals are known to have no Raman spectral features and very low background signal.
Raman spectra were acquired using the SENTERRA confocal Raman system (Bruker Optics Inc., Billerica, MA, USA) equipped with a 785 nm diode laser source (100mW before objective) and a resolution of 3 cm−1. A 100 × air objective (MPLN N. A. 0.9, Olympus), which produced a laser spot size of ~1μm was used to collect Raman signals and focus the laser on a single cell, and does not cause any damage to the cells. Through the microscopy, the laser is focused at the center of the cell with the crosshair. For the isolated single cells, the relative position of the laser can potentially affect the spectrum. Thus for all the isolated single cells used, the position of the spot was retained the same in relation to the cell, which the Raman spectra were obtained centrally over the nucleus of the cells when visible. At least fifteen individual cells were selected from each cell-group (control cells and Dermabond treated cells) for measurement. All Raman measurements are recorded with an accumulation time of 60s in the 600-1750 cm−1 range. The Raman spectra of the cell associated with the autofluorescence background were displayed in computer in real time and saved for further analysis. An automated algorithm for autofluorescence background removal was applied to the measured data to extract pure sample Raman spectra. The Raman spectra of cells and DNA were calculated as the average of fifteen measured samples. Baseline correction was performed by the rubber-band method, which was used to stretch between the spectrum endpoints. Raman spectral acquisition and preprocessing of preliminary data such as baseline subtraction, smoothing, and spectrum analysis were carried out using the OPUS software.
3. Results and discussion
The averaged Raman spectra of control L929 cells and L929 cells treated with Dermabond tissue adhesive are presented in Fig. 1 (curve a: Control, curve b: Dermabond treatment). Peak assignments at different wavenumbers are given in Table 1 . It is evident that both the control and the treated cells exhibit spectra corresponding to molecular vibrations of all cellular components, including nucleic acids, proteins, lipids molecular vibrations of all cellular components, including nucleic acids, proteins, lipids and carbohydrates [15, 28–30]. Curve c in Fig. 1 shows the difference between the spectra of control and Dermabond-treated cells. It is clear that all peaks were significantly decreased when the cells were treated with Dermabond as compared to control cells and that the spectrum is significantly changed as a result of tissue adhesive treatment.
Fig. 1.
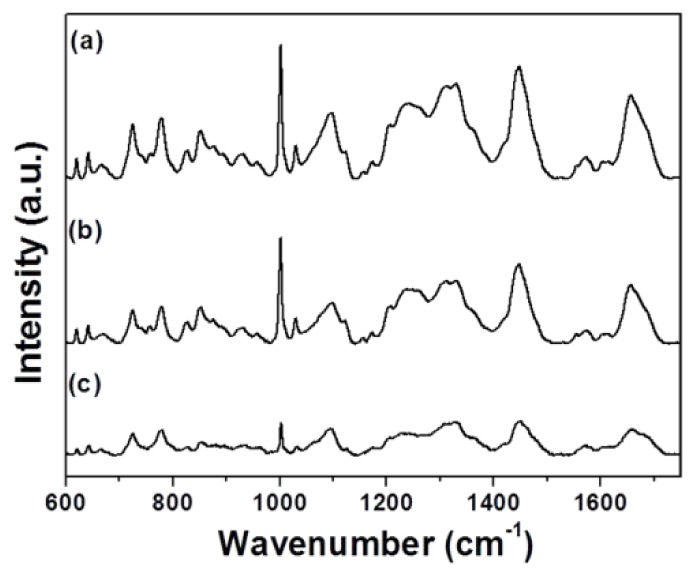
Averaged Raman spectra of L929 cells: (a) Control and (b) Dermabond-treated. The spectrum (c) shows the spectral differences of control cells and cells treated with Dermabond tissue adhesive.
Table 1. Peak assignment of the Raman spectra of L929 cells.
| Peak (cm−1) |
Assignmenta
|
|||
|---|---|---|---|---|
| DNA/RNA | Proteins | Lipids | Carbohydrates | |
| 621 | C-C twist Phe | |||
| 643 | C-C twist Tyr | |||
| 667 | CN+(CH3)3 str. | |||
| 725 | A | |||
| 758 | Ring br. Trp | |||
| 778 | U, C, T ring br. | |||
| 828 | O-P-O asym. str. | Ring br. Tyr | ||
| 853 | Ring br. Tyr | |||
| 877 | C-C-N+ sym. Str. | C-O-C ring | ||
| 932 | C-C bk str. α-helix | C-O-C glycos | ||
| 1002 | Sym. Ring br. Phe | |||
| 1031 | C-H in-plane Phe | |||
| 1096 | PO2 - str. | Chain C-C str. | C-O, C-C str. | |
| 1156 | C-C/ C-N str. | |||
| 1172 | C-H Tyr, Phe | |||
| 1207 | C-C6H5 str. Phe, Trp | |||
| 1245 | Amide III, β-sheet | |||
| 1257 | T, A | Amide III, β-sheet | = CH bend | |
| 1311 | A | |||
| 1448 | G, A | CH def | CH def | CH def |
| 1573 | G, A | |||
| 1604 | C = C Phe, Tyr | |||
| 1656 | Amide I, α-helix | C = C str. | ||
aAbbreviations: A, adenine; U, uracil; G, guanine, C, dytosine; T, thymine,; Phe, phenylalanine; Tyr, tyrosine; Trp, tryptophan; br, breathing; bk, backbone; def, deformation vibration; str, stretching; sym, symmetric; asym, asymmetric; tw, twist.
In order to quantitatively identify how adhesive treatment influenced the variation in cellular components, we selected specific Raman peaks corresponding to DNA, proteins and lipids and compared the changes in their spectral intensities (Fig. 2 ). The band at 725 cm−1 is assigned to the adenine band of DNA, the band at 778 cm−1 the ring breating mode of the DNA bases cytosine and thymine and the RNA base uracil. The main changes related to the proteins can be observed at 1002, 1257, and 1656 cm−1. The sharp band at 1002 cm−1 corresponds to the ring stretching of phenylalanine, which is very important component of proteins. It has been shown that this peak is very sensitive to the death of cells [15, 31, 32]. The peaks at 1257 and 1656 cm−1 represent amide III (β sheet) and amid I (α-helix), respectively, which are basic components of protein structure and are also extremely sensitive to changes in the structure of the protein. The 1096 cm−1 peak represents the vibrations of the phosphodioxy groups PO2 - in the DNA/RNA backbone. The peak at 1448 cm−1 can be attributed to DNA, proteins and lipids. For L929 cells, upon Dermabond exposure, a decrease in the magnitude of Raman intensities corresponding to proteins, such as 1002 (21%) 1257 (25%) and 1656 cm−1 (28%), suggests denaturation and conformational changes of proteins related to cell death. Apart from the biochemical changes related to proteins, cell death involves significant changes in the cell nucleus. The reduction in Raman intensities corresponding to DNA, such as 725 (37%) 778 (38%) and 1096 cm−1 (37%), arose from the destruction of the ring structures, indicating degradation of the DNA.
Fig. 2.
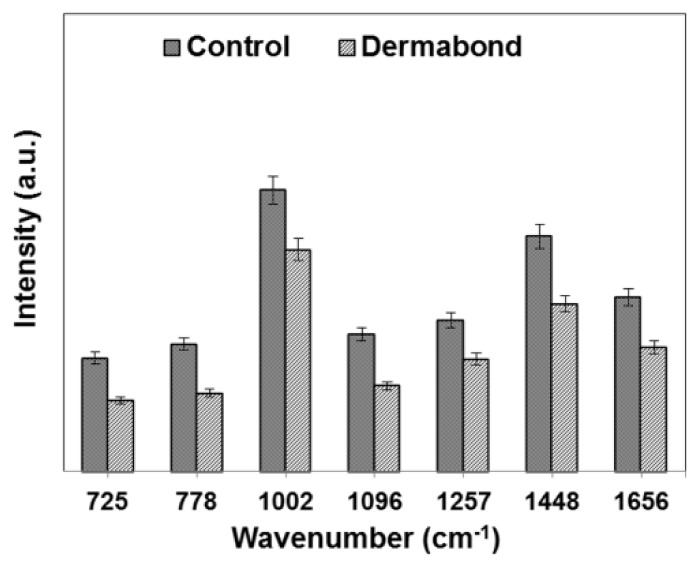
Relative intensities of the Raman peaks for control cells and cells treated with Dermabond tissue adhesive.
Binding with cellular DNA is a crucial step in the Dermabond mechanism of cytotoxicity. In order to assess the impact of tissue adhesive treatment on cellular DNA spectral signatures, we investigated the spectra of the DNA directly. To induce cytotoxicity, L929 cells were treated with Dermabond, and DNA was isolated from the cells to minimize the interfering signals form cytoplasm. Figure 3 shows Raman spectra obtained from control DNA and DNA treated with Dermabond (spectra a: Control, b: Dermabond). Raman spectra of each type of DNA were obtained from an average of 15 spots. Peak assignments at different wavenumbersare given in Table 2 . The sharp bands observed at around 799, 1256, and 1470 cm−1 are related to thymine, adenine and guanine, respectively. The difference between the spectra of control and Dermabond-treated DNA is shown in Fig. 3 curve c. In order to quantitatively identify how the adhesive treatment influenced the variation in DNA, we selected some specific Raman peaks and compared the changes in their spectral intensities (Fig. 4 ). For DNA with Dermabond exposure, Raman intensities were decrease compared with control DNA (Figs. 3 and 4). The reduction in Raman intensity, such as seen in peaks 799 (30%), 1256 (25%) and 1470 cm−1 (30%), suggests degradation of DNA related to cell death.
Fig. 3.
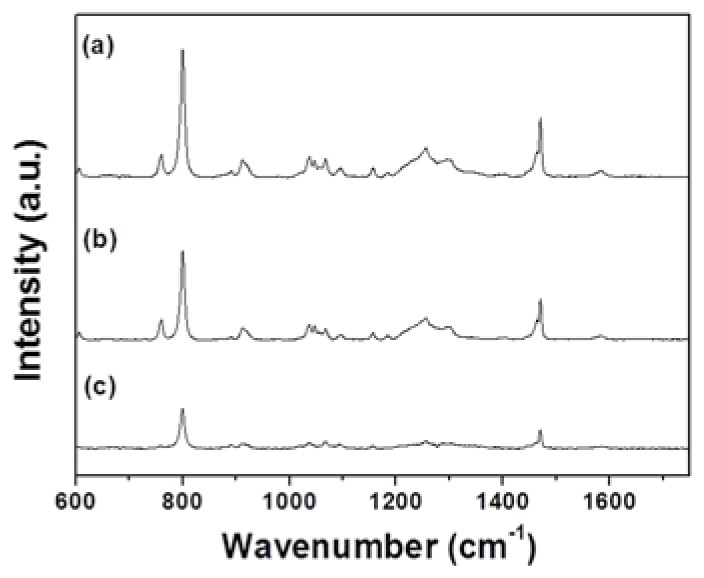
Averaged Raman spectra of DNA: (a) Control and (b) Dermabond-treated. The spectrum (c) shows the spectral differences of control DNA and DNA treated with Dermabond tissue adhesive.
Table 2. Peak assignment of the Raman spectra of DNA.
| Peak (cm−1) | Assignmenta |
|---|---|
| 759 | T |
| 799 | T, C |
| 891 | Deoxyribose |
| 911 | Deoxyribose |
| 1046 | C-O str. |
| 1095 | PO2 - str. |
| 1157 | Deoxyribose, Phosphate |
| 1183 | T, C |
| 1256 | C, A |
| 1294 | C, T |
| 1470 | G |
| 1585 | G, A |
aAbbreviations: A, adenine; G, guanine; C, cytosine; T, thymine; str, stretching vibration
Fig. 4.
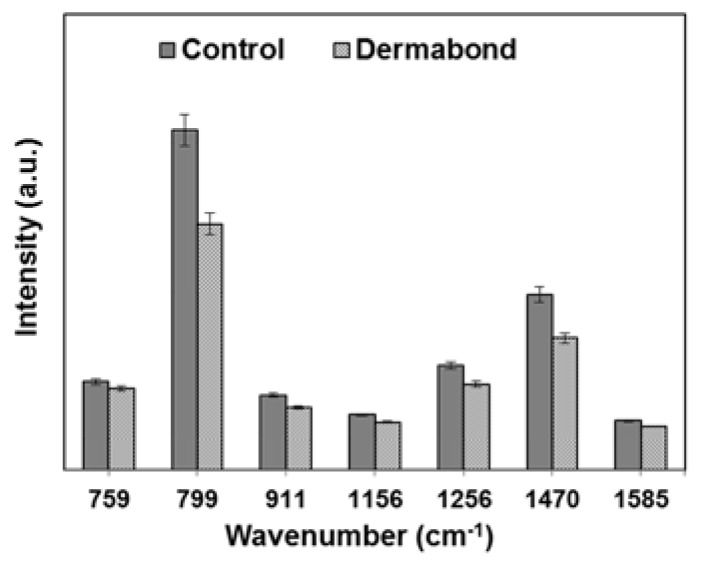
Relative intensities of the Raman peaks for control DNA and DNA treated with Dermabond tissue adhesive.
Conventional cytotoxicity assays rely on indirectly assessing cell membrane integrity and/or cellular function using colorimetric or fluorescent dyes [33–35]. These methods are not quantitative and also require a large amount of materials. In contrast, Raman spectroscopy has the ability to detect and identify DNA changes related to cytotoxicity at lower concentrations and in earlier time points than conventional cell-based assays.
In this study, we evaluated, for the first time, Raman spectroscopy for the characterization of biochemical changes in the cell (and cellular DNA) following treatment with tissue adhesive. The results from Raman spectroscopy showed good agreement with cell viability results obtained from conventional cytotoxicity assays (see next section). As a result, Raman spectroscopy can be a useful tool for cytotoxicity evaluation of tissue adhesives due to its label-free and quantitative analysis.
To verify the results obtained with Raman spectroscopy, we carried out conventional cytotoxicity assays (WST, LIVE/DEAD and TUNEL). L929 cells were treated with an IC50 dose of Dermabond tissue adhesive (5 µl/105 cells) for 24 hr by direct contact. Figure 5(a) and 5(b) show results of the WST and LIVE/DEAD viability/cytotoxicity assay, respectively. As shown in Fig. 5, Dermabond tissue adhesive treatment inhibited L929 cell viability. For the Dermabond-treated cells, cell viability was 54% of that of the control cells. This result was also confirmed by a LIVE/DEAD viability/cytotoxicity assay using confocal microscopy. The results were observed in experiments performed in triplicate.
Fig. 5.
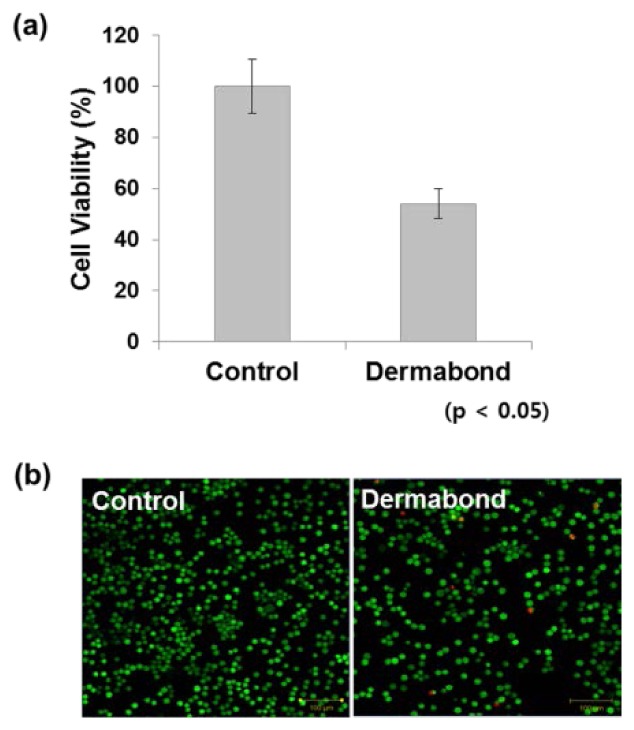
WST and LIVE/DEAD viability/cytotoxicity assays were used to determine cytotoxicity after Dermabond tissue adhesive treatment. Mouse L929 fibroblasts (1 × 10⁵ cells) were seeded in 12-well plates and treated with Dermabond. After a 24 hr incubation, cytotoxicity was analyzed using the (a) WST assay and (b) LIVE/DEAD viability/cytotoxicity assay.
DNA fragmentation in apoptosis can be examined using the TUNEL assay. The TUNEL assay is an important technique for the assessment of DNA damage, which is a marker of apoptosis. To evaluate the effects of Dermabond tissue adhesive on induction of L929 cell apoptosis, we performed flow cytometry. Evaluation of apoptosis by TUNEL assay showed that Dermabond can induce degradation of DNA related to the cell death (Fig. 6 ). This result was in agreement with the Raman results.
Fig. 6.
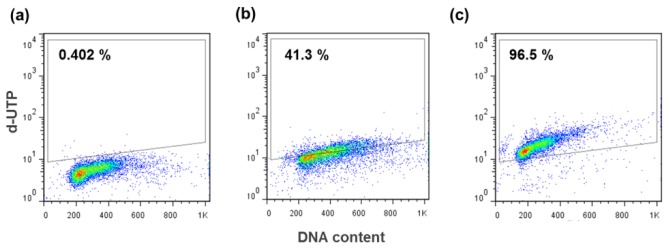
Evaluation of apoptotic cell death in Dermabond tissue adhesive-treated cells by TUNEL assay. The TUNEL assay was performed in (a) negative control, (b) Dermabond-treated L9292 cells and (c) positive control.
4. Conclusion
In summary, we have demonstrated a cytotoxicity evaluation of tissue adhesive treatment at a molecular level in mouse fibroblast L929 cells and cellular DNA using Raman spectroscopy. Following the tissue adhesive treatment, the Raman spectra indicated significant biochemical changes related to nucleic acids, proteins, lipids and carbohydrates. It is clear that all Raman peaks were significantly decreased when the cells were treated with tissue adhesive as compared to control cells. Changes associated with cellular DNA structure were also evident in the Raman spectra, in which the Raman intensity was reduced following Dermabond tissue adhesive treatment. These results suggest denaturation and conformational changes in proteins, and degradation of DNA related to the cell death. Furthermore, the results of Raman spectroscopy agreed with those of conventional methods including WST, LIVE/DEAD and TUNEL assays performed on the same types of cells. Raman spectroscopy has the ability to detect and identify DNA changes related to cytotoxicity at lower concentrations and in earlier time points than conventional cell-based assays. Thus, the label-free Raman spectroscopy method for cytotoxicity evaluation of tissue adhesives may be useful for rapid and sensitive detection of cellular changes.
Acknowledgments
This study was supported by a grant from the Kyung Hee University in 2011 (No. 20120196, Development of early detection system in cerebrovascular disease using Tip-enhanced Raman spectroscopy).
References and links
- 1.Applebaum J. S., Zalut T., Applebaum D., “The use of tissue adhesion for traumatic laceration repair in the emergency department,” Ann. Emerg. Med. 22(7), 1190–1192 (1993). 10.1016/S0196-0644(05)80988-6 [DOI] [PubMed] [Google Scholar]
- 2.Leahey A. B., Gottsch J. D., Stark W. J., “Clinical experience with N-butyl cyanoacrylate (Nexacryl) tissue adhesive,” Ophthalmology 100(2), 173–180 (1993). [DOI] [PubMed] [Google Scholar]
- 3.Blanco L. P., “Lip suture with isobutyl cyanoacrylate,” Endod. Dent. Traumatol. 10(1), 15–18 (1994). 10.1111/j.1600-9657.1994.tb00592.x [DOI] [PubMed] [Google Scholar]
- 4.Leggat P. A., Smith D. R., Kedjarune U., “Surgical applications of cyanoacrylate adhesives: a review of toxicity,” ANZ J. Surg. 77(4), 209–213 (2007). 10.1111/j.1445-2197.2007.04020.x [DOI] [PubMed] [Google Scholar]
- 5.Vote B. J., Elder M. J., “Cyanoacrylate glue for corneal perforations: a description of a surgical technique and a review of the literature,” Clin. Experiment. Ophthalmol. 28(6), 437–442 (2000). 10.1046/j.1442-9071.2000.00351.x [DOI] [PubMed] [Google Scholar]
- 6.Lin J., Chen R., Feng S., Pan J., Li B., Chen G., Lin S., Li C., Sun L., Huang Z., Zeng H., “Surface-enhanced Raman scattering spectroscopy for potential noninvasive nasopharyngeal cancer detection,” J. Raman Spectrosc. 43(4), 497–502 (2012). 10.1002/jrs.3072 [DOI] [Google Scholar]
- 7.Dochow S., Krafft C., Neugebauer U., Bocklitz T., Henkel T., Mayer G., Albert J., Popp J., “Tumour cell identification by means of Raman spectroscopy in combination with optical traps and microfluidic environments,” Lab Chip 11(8), 1484–1490 (2011). 10.1039/c0lc00612b [DOI] [PubMed] [Google Scholar]
- 8.Schenk J., Tröbs L., Emmerling F., Kneipp J., Panne U., Albrecht M., “Simultaneous UV/Vis spectroscopy and surface enhanced Raman scattering of nanoparticle formation and aggregation in levitated droplets,” Anal. Methods 4(5), 1252–1258 (2012). 10.1039/c2ay05744a [DOI] [Google Scholar]
- 9.El-Said W. A., Kim T. H., Kim H. C., Choi J. W., “Analysis of intracellular state based on controlled 3D nanostructures mediated surface enhanced Raman scattering,” PLoS ONE 6(2), e15836 (2011). 10.1371/journal.pone.0015836 [DOI] [PMC free article] [PubMed] [Google Scholar]
- 10.Mariani M. M., Day P. J., Deckert V., “Applications of modern micro-Raman spectroscopy for cell analyses,” Integr Biol (Camb) 2(2-3), 94–101 (2010). 10.1039/b920572a [DOI] [PubMed] [Google Scholar]
- 11.Lin J., Chen R., Feng S., Li Y., Huang Z., Xie S., Yu Y., Cheng M., Zeng H., “Rapid delivery of silver nanoparticles into living cells by electroporation for surface-enhanced Raman spectroscopy,” Biosens. Bioelectron. 25(2), 388–394 (2009). 10.1016/j.bios.2009.07.027 [DOI] [PubMed] [Google Scholar]
- 12.Chen L., Han X. X., Guo Z., Wang X., Ruan W., Song W., Zhao B., Ozaki Y., “Biomagnetic glass beads for protein separation and detection based on surface-enhanced Raman scattering,” Anal. Methods 4(6), 1643–1647 (2012). 10.1039/c2ay25244a [DOI] [Google Scholar]
- 13.Feng S., Chen R., Lin J., Pan J., Wu Y., Li Y., Chen J., Zeng H., “Gastric cancer detection based on blood plasma surface-enhanced Raman spectroscopy excited by polarized laser light,” Biosens. Bioelectron. 26(7), 3167–3174 (2011). 10.1016/j.bios.2010.12.020 [DOI] [PubMed] [Google Scholar]
- 14.Lin J., Chen R., Feng S., Pan J., Li Y., Chen G., Cheng M., Huang Z., Yu Y., Zeng H., “A novel blood plasma analysis technique combining membrane electrophoresis with silver nanoparticle-based SERS spectroscopy for potential applications in noninvasive cancer detection,” Nanomedicine 7(5), 655–663 (2011). 10.1016/j.nano.2011.01.012 [DOI] [PubMed] [Google Scholar]
- 15.Notingher I., Selvakumaran J., Hench L. L., “New detection system for toxic agents based on continuous spectroscopic monitoring of living cells,” Biosens. Bioelectron. 20(4), 780–789 (2004). 10.1016/j.bios.2004.04.008 [DOI] [PubMed] [Google Scholar]
- 16.Ghanate A. D., Kothiwale S., Singh S. P., Bertrand D., Krishna C. M., “Comparative evaluation of spectroscopic models using different multivariate statistical tools in a multicancer scenario,” J. Biomed. Opt. 16(2), 025003 (2011). 10.1117/1.3548303 [DOI] [PubMed] [Google Scholar]
- 17.Makowski A. J., Patil C. A., Mahadevan-Jansen A., Nyman J. S., “Polarization control of Raman spectroscopy optimizes the assessment of bone tissue,” J. Biomed. Opt. 18(5), 055005 (2013). 10.1117/1.JBO.18.5.055005 [DOI] [PMC free article] [PubMed] [Google Scholar]
- 18.Kang J. W., Lue N., Kong C. R., Barman I., Dingari N. C., Goldfless S. J., Niles J. C., Dasari R. R., Feld M. S., “Combined confocal Raman and quantitative phase microscopy system for biomedical diagnosis,” Biomed. Opt. Express 2(9), 2484–2492 (2011). 10.1364/BOE.2.002484 [DOI] [PMC free article] [PubMed] [Google Scholar]
- 19.Barman I., Dingari N. C., Saha A., McGee S., Galindo L. H., Liu W., Plecha D., Klein N., Dasari R. R., Fitzmaurice M., “Application of Raman spectroscopy to identify microcalcifications and underlying breast lesions at stereotactic core needle biopsy,” Cancer Res. 73(11), 3206–3215 (2013). 10.1158/0008-5472.CAN-12-2313 [DOI] [PMC free article] [PubMed] [Google Scholar]
- 20.Bergholt M. S., Zheng W., Ho K. Y., Teh M., Yeoh K. G., So J. B. Y., Shabbir A., Huang Z., “Fiber-optic Raman spectroscopy probes gastric carcinogenesis in vivo at endoscopy,” J Biophotonics 6(1), 49–59 (2013). 10.1002/jbio.201200138 [DOI] [PubMed] [Google Scholar]
- 21.Meade A. D., Clarke C., Draux F., Sockalingum G. D., Manfait M., Lyng F. M., Byrne H. J., “Studies of chemical fixation effects in human cell lines using Raman microspectroscopy,” Anal. Bioanal. Chem. 396(5), 1781–1791 (2010). 10.1007/s00216-009-3411-7 [DOI] [PubMed] [Google Scholar]
- 22.Lin J., Yu Y., Li B., Huang H., Lin S., Li C., Su Y., Feng S., Chen G., Li Y., Huang Z., Zeng H., Chen R., “Electrical pulse – mediated enhanced delivery of silver nanoparticles into living suspension cells for surface enhanced Raman spectroscopy,” Laser Phys. Lett. 9(3), 240–246 (2012). 10.1002/lapl.201110125 [DOI] [Google Scholar]
- 23.Yu Y., Lin J., Wu Y., Feng S., Li Y., Huang Z., Chen R., Zeng H., “Optimizing electroporation assisted silver nanoparticle delivery into living C666 cells for surface-enhanced Raman spectroscopy,” Spectroscopy 25(1), 13–21 (2011). 10.1155/2011/172106 [DOI] [Google Scholar]
- 24.Yehia H. N., Draper R. K., Mikoryak C., Walker E. K., Bajaj P., Musselman I. H., Daigrepont M. C., Dieckmann G. R., Pantano P., “Single-walled carbon nanotube interactions with HeLa cells,” J. Nanobiotechnology 5(1), 8 (2007). 10.1186/1477-3155-5-8 [DOI] [PMC free article] [PubMed] [Google Scholar]
- 25.Moritz T. J., Taylor D. S., Krol D. M., Fritch J., Chan J. W., “Detection of doxorubicin-induced apoptosis of leukemic T-lymphocytes by laser tweezers Raman spectroscopy,” Biomed. Opt. Express 1(4), 1138–1147 (2010). 10.1364/BOE.1.001138 [DOI] [PMC free article] [PubMed] [Google Scholar]
- 26.Huang H., Shi H., Feng S., Chen W., Yu Y., Lin D., Chen R., “Confocal Raman spectroscopic analysis of the cytotoxic response to cisplatin in nasopharyngeal carcinoma cells,” Anal. Methods 5(1), 260–266 (2012). 10.1039/c2ay25684c [DOI] [Google Scholar]
- 27.Candeloro Luca Tirinato P., Malara N., Fregola A., Casals E., Puntes V., Perozziello G., Gentile F., Coluccio M. L., Das G., Liberale C., De Angelisand F., Di Fabrizio E., “Nanoparticle microinjection and Raman spectroscopy as tools for nanotoxicology studies,” Analyst (Lond.) 136(21), 4402–4408 (2011). [DOI] [PubMed] [Google Scholar]
- 28.Matthews Q., Jirasek A., Lum J., Duan X., Brolo A. G., “Variability in Raman spectra of single human tumor cells cultured in vitro: correlation with cell cycle and culture confluency,” Appl. Spectrosc. 64(8), 871–887 (2010). 10.1366/000370210792080966 [DOI] [PubMed] [Google Scholar]
- 29.Chan J. W., Taylor D. S., Zwerdling T., Lane S. M., Ihara K., Huser T., “Micro-Raman spectroscopy detects individual neoplastic and normal hematopoietic cells,” Biophys. J. 90(2), 648–656 (2006). 10.1529/biophysj.105.066761 [DOI] [PMC free article] [PubMed] [Google Scholar]
- 30.De Gelder J., De Gussem K., Vandenabeele P., Moens L., “Reference database of Raman spectra of biological molecules,” J. Raman Spectrosc. 38(9), 1133–1147 (2007). 10.1002/jrs.1734 [DOI] [Google Scholar]
- 31.Owen C. A., Selvakumaran J., Notingher I., Jell G., Hench L. L., Stevens M. M., “In vitro toxicology evaluation of pharmaceuticals using Raman micro-spectroscopy,” J. Cell. Biochem. 99(1), 178–186 (2006). 10.1002/jcb.20884 [DOI] [PubMed] [Google Scholar]
- 32.Notingher I., Green C., Dyer C., Perkins E., Hopkins N., Lindsay C., Hench L. L., “Discrimination between ricin and sulphur mustard toxicity in vitro using Raman spectroscopy,” J. R. Soc. Interface 1(1), 79–90 (2004). 10.1098/rsif.2004.0008 [DOI] [PMC free article] [PubMed] [Google Scholar]
- 33.Weyermann J., Lochmann D., Zimmer A., “A practical note on the use of cytotoxicity assays,” Int. J. Pharm. 288(2), 369–376 (2005). 10.1016/j.ijpharm.2004.09.018 [DOI] [PubMed] [Google Scholar]
- 34.Fotakis G., Timbrell J. A., “In vitro cytotoxicity assays: comparison of LDH, neutral red, MTT and protein assay in hepatoma cell lines following exposure to cadmium chloride,” Toxicol. Lett. 160(2), 171–177 (2006). 10.1016/j.toxlet.2005.07.001 [DOI] [PubMed] [Google Scholar]
- 35.Bhatia S. K., Yetter A. B., “Correlation of visual in vitro cytotoxicity ratings of biomaterials with quantitative in vitro cell viability measurements,” Cell Biol. Toxicol. 24(4), 315–319 (2008). 10.1007/s10565-007-9040-z [DOI] [PubMed] [Google Scholar]


