Abstract
Background
Extensive evidence implicates the Eph receptor family of tyrosine kinases and its ligand, ephrin, in glioma invasion, but it remains incompletely understood how these receptors affect chemotactic behavior of glioma. We sought to identify the Eph family members that correlate with patients' survival and to reveal the function of Eph in glioma invasion.
Methods
Clinical relevance of EphB genes was confirmed in a clinically annotated expression data set of 195 brain biopsy specimens. The function of EphB was analyzed in vitro and in vivo.
Results
Levels of mRNA of certain EphB members were significantly different in histological grades of glioma. According to Kaplan–Meier analysis, only the EphB1 level among 5 members of EphB emerged to be a powerful predictor of favorable survival in malignant glioma (n = 97, P = .0048), although the levels of EphB1 expression did not vary across the tumor grades. Immunoprecipitation showed that tyrosine phosphorylated EphB1 was not detected in all glioma cells tested. Forced overexpression and autophosphorylation of EphB1 in low expressor cell lines (U251, U87) did not affect cell migration or invasion in vitro, whereas EphB1 phosphorylation induced by ephrin-B2/Fc significantly decreased migration and invasion. Cells expressing ephrin-B2 showed noteworthy morphological changes consistent with migration induction; this alteration was negated by EphB1 overexpression. Concomitantly, overexpression of EphB1 abrogated the increased migration and invasion induced by ephrin-B2 in vitro and in vivo.
Conclusions
These data suggest that ligand-dependent EphB1 signaling negatively regulates glioma cell invasion, identifying EphB1 as a favorable prognostic factor in malignant glioma.
Keywords: glioma, invasion, migration, Eph-ephrin, tyrosine kinase
The invasive nature of glioma cells makes an important contribution to tumor recurrence, as the remaining tumor cells inevitably infiltrate the surrounding normal brain tissue, which leads to a poor prognosis.1,2 Because of this fact, the traditional therapeutic modalities such as surgical resection, adjuvant radiation therapy, and chemotherapy are only modestly effective.3,4 An understanding of glioma oncogenesis has steadily improved, but the molecular mechanisms mediating glioma migration and invasion are still nascent. Therefore, a detailed understanding of the mechanisms underlying this invasive behavior of glioma is essential for the development of novel effective therapies.5
The Eph receptors, comprising the largest family of receptor protein tyrosine kinases, interact with ligands called ephrins. Eph receptors are separated into EphA (A1–A8) and EphB (B1–B6) subgroups based on their degree of sequence similarity and ligand affinity6; ephrin ligands are divided into 2 subclasses: glycosylphosphatidylinositol-linked ephrin-A ligands and transmembrane ephrin-B ligands.7 Eph/ligands are involved in various aspects of the development of the nervous system, including morphogenesis, vascular formation, and cell migration.8,9 Because both receptors and ligands are membrane bound, a direct cell-cell contact is necessary for ligand binding and subsequent activation of the signaling cascades.10 Upon cell-to-cell contact and ligand-receptor engagement, intracellular signaling is induced in a bidirectional fashion: “forward signaling” starts in receptor-expressing cells, while “reverse signaling” initiates in cells expressing the corresponding ligand.9,11 Eph forward signaling has emerged in cancer, especially in the setting of invasion by numerous cancers.12,13 Recently, it became clear that Eph can signal without ligand; for example, EphB4 receptor can inhibit cancer cell adhesion independently of ephrin binding.14 Intriguingly, EphA2 overexpression promotes migration of glioblastoma multiforme (GBM) cells and their invasion through a ligand-independent mechanism, whereas ligand-dependent activation of EphA2 inhibits chemotactic migration of GBM cells.15
Eph receptors can also act as both tumor promoters and suppressors in different contexts.15–17 Prior studies showed that EphB2 plays a functional role in promoting glioma cell invasion.18,19 Conversely, a tumor-suppressing role of EphB2 has been reported in colorectal20 and prostate cancers.21 EphB4 has also both tumor-suppressing and tumor-promoting activities in different tumor models.22 These divergent and paradoxical EphB signaling functions make it of great interest to study the role of EphB in glioma cell behavior.
To further characterize the genetic and functional role of EphB in glioma cell motility, we analyzed transcriptional levels of EphB signaling in gliomas and demonstrated that EphB1 expression level is associated with good survival in patients with malignant astrocytomas. Furthermore, we showed that EphB1 forward signaling by autophosphorylation does not have an impact on migration and invasion of glioma, whereas EphB1 phosphorylation in a ligand-dependent manner retards glioma cell migration and invasion in vitro and in vivo. These results suggest that ligand-dependent EphB1 signaling serves as a negative regulator for glioma cell motility and that its expression imparts a positive predictor for glioma patient survival.
Materials and Methods
Gene Expression Profiling and Survival Analysis
Snap-frozen nonneoplastic brain specimens from epileptogenic patients (n = 24) and tumor (n = 171) specimens with clinical information were collected at Hermelin Brain Tumor Center, Henry Ford Hospital, Detroit, Michigan (courtesy of T. Mikkelsen). All specimens were collected under an institutional review board–approved protocol and de-identified for patient confidentiality. Clinical information was provided for all samples (29 astrocytomas, 82 GBM, 49 oligodendrogliomas, and 11 oligoastrocytomas).
Gene expression profiles of these brain specimens were captured using Affymetrix U133 Plus 2 GeneChips according to the protocol of the manufacturer at the Neuro-Oncology Branch of the National Cancer Institute.23 Array data were processed according to the Affymetrix Microarray Suite 5 algorithm implemented in Affymetrix GeneChip Operating Software and uploaded into GeneSpring 7.2 for data management (Silicon Genetics).
Expression values were filtered for highly variable (differentially expressed) genes (coefficient of variation >30%) across samples, producing a list of 7322 genes. Principal component (PC) analysis was done to investigate the relationships among samples (ie, to find clusters within the data). Components were sorted from most to least amount of variation. Two clusters were evident in a 3-dimensional scatter plot of PC1, PC2, and PC3. The 3 components accumulatively accounted for 46% of the variation in the data set. Kaplan–Meier survival curves were developed for each cluster. One cluster had a median survival time of 401 days and the other cluster had a median survival time of 952 days. Box plots for EphB expression in each cluster derived from PC analysis were graphed. Significance between the 2 populations was tested with a 2-tailed t-test assuming unequal variances.
Cell Line and Cell Culture
Human glioma cell lines U251, U87, and SNB19 (American Type Culture Collection) were cultured at 37°C in a humidified CO2 incubator with Dulbecco's modified Eagle's medium (DMEM), 10% fetal bovine serum (FBS), and 1% penicillin-streptomycin.
Antibodies and Reagents
Cell culture media, sodium dodecyl sulfate–polyacrylamide gel, polyvinylidene difluoride membrane, and bovine serum albumin were purchased from Invitrogen. Anti-phosphotyrosine monoclonal antibody (Clone #9411) and mouse monoclonal antibody against EphB1 (Clone #3980S) for immunoprecipitation, immunofluorescence, and immunoblot analysis were purchased from Cell Signaling Technology. Anti-vinculin monoclonal antibody was obtained from Sigma. EphB1/crystallizable fragment (Fc) and ephrin-B2/Fc chimera were purchased from R&D Systems. Control mouse immunoglobulin (Ig)G and Fc fragment of mouse IgG were purchased from Sigma and Jackson ImmunoResearch, respectively. Protein G Sepharose 4 Fast Flow was purchased from GE Healthcare Bio-Sciences. Mouse β-actin monoclonal antibody was obtained from Sigma.
Quantitative Real-time PCR
Gene expression was quantified by quantitative real-time (qRT)–PCR on a LightCycler using MasterPLUS SYBR Green (Roche Diagnostics) as described previously.24 PCR was performed with the following primers (the nucleotide number and amplicon size for each primer are within parentheses): EphB1 (Genbank accession number NM_004441.4): sense, 5′-AGAGGAGGGAAAAGGACCAGG-3′; antisense, 5′-GGTTTCCCACGGCATCTC-3′ (amplicon size, 183 bp); β-actin (NM_001101): sense, 5′-CTACAATGAGCTGCGTGTGGC-3′; antisense, 5′-CAGGTCCAGACGCAGGATGGC-3′ (amplicon size, 271 bp). The LightCycler analysis software was used to analyze the PCR data, as described previously.24
Immunoprecipitation and Immunoblot Analysis
Immunoprecipitation and immunoblot analyses were performed as described previously.7,19 Equivalent amounts of protein (200 µg) were precleared, then immunoprecipitated from the lysates. To detect phosphorylation of EphB1, cells were stimulated by ephrin-B2/Fc for 10 min at 37°C before cell lysate extraction.
Expression Plasmids and Cell Transfection
Expression plasmid for EphB1 was constructed as follows. The cDNA fragment encoding EphB1 was PCR-amplified using human embryonic kidney 293 T cDNA as a template; the fragment was inserted into pEAK plasmid. Transient transfection was performed with U251 and U87 cells using Effectene (Qiagen), as recommended by the manufacturer's protocol. Another expression plasmid for ephrin-B2 was constructed; the consistency of ephrin-B2 transfection into glioma cell lines was confirmed previously.7 Cells transfected with empty plasmid vector were used as controls.
Immunofluorescence
For immunofluorescence, cells transiently transfected with EphB1 and/or ephrin-B2 or empty plasmid vector were fixed in 4% paraformaldehyde, then permeabilized. After washing with phosphate buffered saline, the cells were blocked with 2% bovine serum albumin and 3% goat serum for 30 min and incubated with anti-EphB1 antiserum (1 : 500 dilution) or anti-vinculin (1 : 100) for 1 h at 25°C, followed by incubation with Alexa Fluor 488 goat anti-rabbit antibody or 546 goat anti-mouse antibody (1 : 100; Invitrogen) for 1 h at room temperature in the dark. Negative controls were stained with a 1:50 dilution of preimmunization mouse sera. Finally, the sections were washed with Tris-buffered saline Tween-20 and mounted with mounting medium for fluorescence with 4′,6′-diamidino-2-phenylindole (DAPI; Santa Cruz Biotechnology). Cell images were captured by fluorescence microscopy (Biorevo BZ-9000) and inverted confocal laser microscopy (Zeiss LSM510).
Migration Assay
Chemotactic migration of cells was measured in a modified Boyden chamber as described previously.25,26 Briefly, the fibronectin-coated filter with 8-μm pores was placed in a 96-blind-well chamber (Neuroprobe) and the cells in DMEM containing free FBS after certain pretreatments were loaded into the upper wells. After incubation at 37°C for 8–10 h, cells that had migrated to the underside surface of the filter were fixed with methanol and stained with a Diff-Quick staining kit (Sysmex). The number of cells was determined by measuring optical densities at 590 nm using a 96-well microplate reader (Bio-Rad).
Matrigel Invasion Assay
Cell invasion assays were carried out using modified Boyden chambers consisting of Transwell with precoated Matrigel membrane filter inserts in 24-well tissue culture plates (BD Biosciences) as described previously.7,19 Serum-deprived cells suspended in DMEM containing 0.1% FBS were added to each Transwell. After incubation at 37°C for 16–20 h, noninvading cells were removed by wiping the upper side of the membrane, and the invading cells were fixed with methanol and stained with 0.5% crystal violet (Sigma). The invading cells of the filter were counted from 6 randomly selected fields (total magnification, ×200). In certain experiments, EphB1/Fc, ephrin-B2/Fc, or control Fc fragment of mouse IgG was applied to the upper chamber.
In vivo Tumor Invasion Assay
Following an institutional review board–approved protocol, intracranial transplantation of glioma cells into mice was done. Female nonobese diabetic/severe combined immunodeficiency disease (NOD/SCID) mice (Charles River Lavoratories) aged 7 weeks were used as described previously.25 Mice were anesthetized with an intraperitoneal injection of pentobarbital (60–70 mg/kg body weight). A burr hole was made in the skull 3 mm lateral to the bregma using a drill, and 1 × 10⁵ U87 cells stably transfected with empty plasmid vector, EphB1 receptor vector, or ephrin-B2 ligand vector in 2 μL phosphate buffered saline were stereotactically injected over 4 min at a depth of 3 mm below the dura mater. This procedure reproducibly resulted in tumor growth and obvious tumor-related symptoms about 3 weeks after intracerebral injection. Three mice in each group were euthanized on day 21 after tumor injection. The brain tissue was embedded in paraffin and then cut into 5-μm serial coronal sections. Tissue sections were stained by the standard hematoxylin and eosin technique.
Cell Proliferation Assay
Proliferation of cells transfected with EphB1 and/or ephrin-B2 or empty plasmid vector was measured using a fluorescence plate reader by adding Alamar Blue (Biosource) as described previously.27
Statistical Analysis
Statistical significance was determined using an unpaired Student's t test, and P < .05 was considered significant. Overall survival curves were plotted according to the Kaplan–Meier method, with the log-rank test applied for comparison. All data were analyzed using GraphPad Prism software.
Results
EphB1 Is a Prognostic Marker in Malignant Astrocytomas
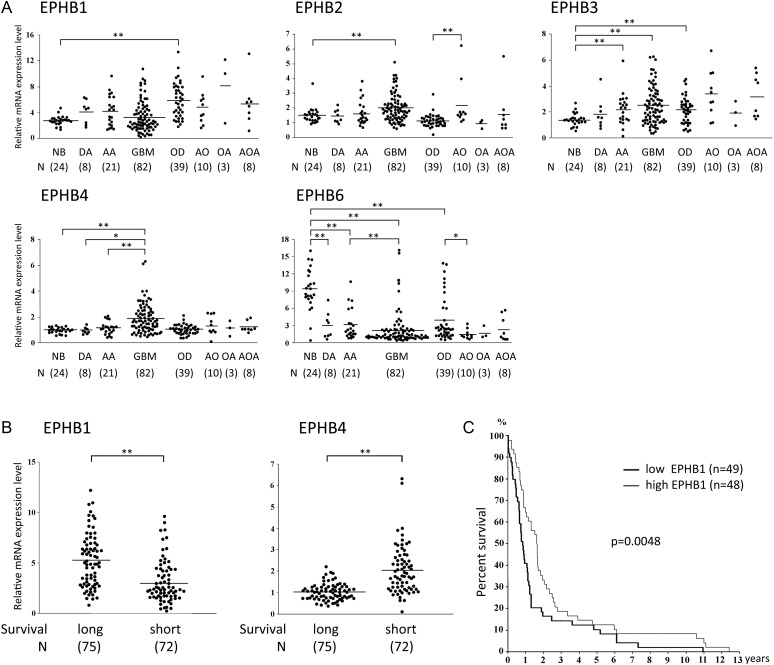
To first gain a global view of the signaling pathways engaged by EphB receptors in various human glial tumors, we analyzed transcriptional levels of EphB in vivo. Whole genome expression profiling of a series of human brain tumor specimens was carried out and revealed EphB2, B3, and B4 expression to be significantly higher in GBM (P < .01) than in normal brain specimens (Fig. 1A). By contrast, EphB6 was weakly expressed in diffuse astrocytoma, anaplastic astrocytoma, and GBM compared with nonneoplastic brain (P < .01). Except for the increased expression level of EphB1 in oligodendroglioma compared with normal brain specimens (P < .01), levels of EphB1 expression did not vary across the tumor grades.
Fig. 1.
Analysis of EphB expression in various human glial tumors. (A) Expression levels of EphB mRNA in nonneoplastic brain (NB), diffuse astrocytoma (DA), anaplastic astrocytoma (AA), glioblastome multiforme (GBM), oligodendroglioma (OD), anaplastic oligodendroglioma (AO), oligoastrocytoma (OA), and anaplastic oligoastrocytoma (AOA) were mined in an Affymetrix gene expression profile. *P < .05; **P < .01. (B) Expression values of EphB1 and EphB4 mRNA were analyzed in 2 clusters derived from a 3-dimensional scatter plot of PC analysis from the gene expression profiling of nonneoplastic and brain tumor specimens. Kaplan–Meier survival curves were developed for each cluster. Cluster 1 has a survival mean of 401 days (short-term survival) and cluster 2 has a survival mean of 952 days (long-term survival). Scatter plots for EphB1 and EphB4 expression in glioma patients for each cluster-derived PC analysis are shown. Significance between the 2 populations was tested with a 2-tailed t-test assuming unequal variances. **P < .01. (C) Kaplan–Meier survival analysis of patients with malignant astrocytoma (n = 97) binned into high (greater/equal to median) and low (less than median) expression of EphB1.
PC analysis was used to investigate the relationship of EphB expression across all tumor samples and patient outcomes. Two separate clusters emerged in a 2-dimensional scatter plot of PC analysis as previously described.28 Patients with high EphB1 tumor levels (greater than or equal to median expression) had significantly longer survival than patients with low EphB1 tumor levels (less than median expression, P < .01; Fig. 1B). In contrast, patients with high EphB4 tumor levels had significantly shorter survival than patients with low EphB4 tumor levels (P < .01).
To further discern clinical relevance of EphB expression level, Kaplan–Meier survival curves were developed with malignant astrocytoma, including anaplastic astrocytoma and GBM. Patients with high EphB1 tumor levels (greater than or equal to median expression) had significantly longer survival than patients with low EphB1 tumor levels (less than median expression, P = .0048; Fig. 1C). The 1- and 2-year survival rates were 64.6% and 33.3%, respectively, in the group showing high expression of EphB1, compared with 40.8% and 16.3% for patients with low expression of EphB1. EphB4 and other EphB mRNA levels did not show correlation with survival (data not shown). These data suggest that high EphB1 expression levels correlate with better patient outcome.
Expression and Phosphorylation of EphB1 in Glioma Cell Lines
Expression of EphB1 in human glioma cell lines was assessed by qRT-PCR using β-actin mRNA as an internal quantitative reference. Levels of EphB1 mRNA (EphB1 mRNA/β-actin mRNA ratios) were detected at various levels in U251, U87, and SNB19 glioma cells (Fig. 2A). To determine the endogenous levels of EphB1 phosphorylation in glioma cells, we immunoblotted the EphB1 immunoprecipitates with a specific monoclonal antibody directed against phosphorylated tyrosine residues. SNB19 glioma cells displayed the highest levels of EphB1 protein (Fig. 2B), consistent with qRT-PCR data. Tyrosine phosphorylated EphB1 was not detected in any of the cell lines.
Fig. 2.
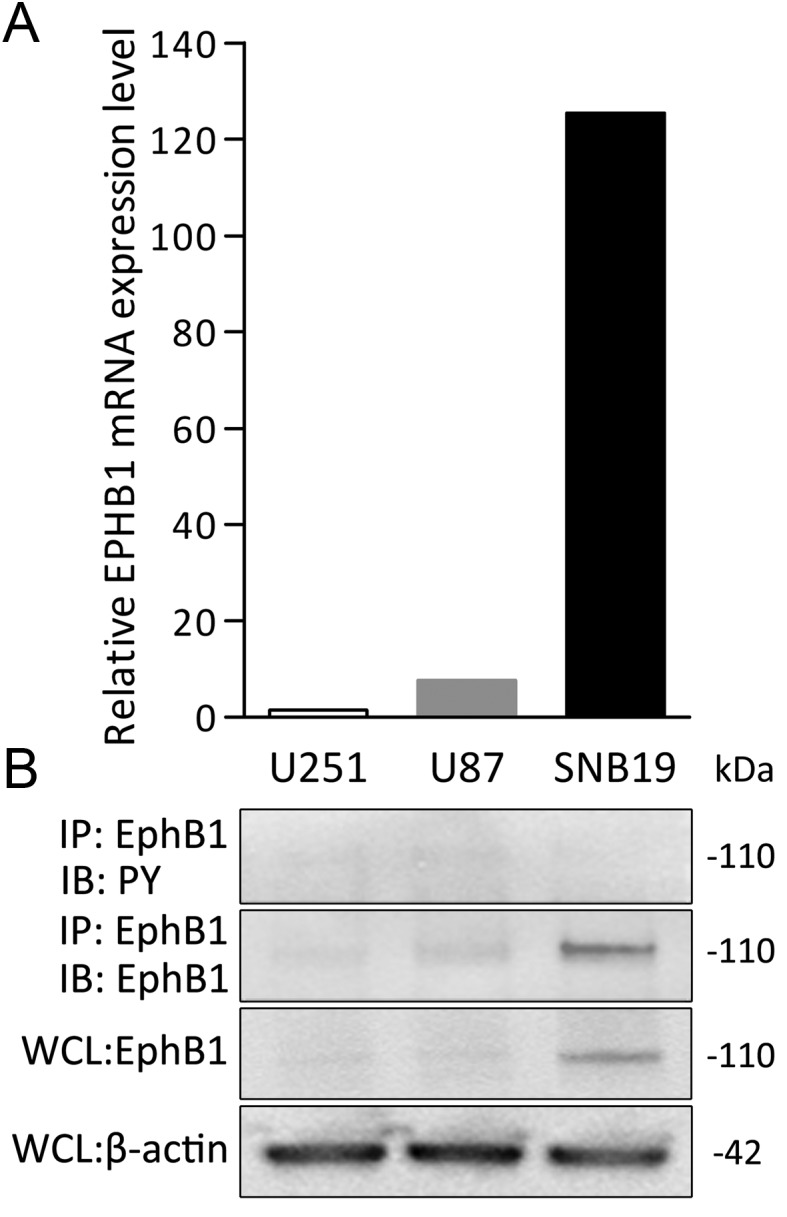
Characterization of EphB1 expression in human glioma cell lines. (A) The relative mRNA expression levels of EphB1 (target mRNA/β-actin mRNA ratios) in the cells were calculated by qRT-PCR. The value of U251 was set at 1. Results shown in (A) are typical of at least 2 replicate experiments. (B) Immunoprecipitation (IP) using total cell lysate from each of the indicated cell lines was performed. Equal amounts of cell lysates were immunoprecipitated with anti-EphB1 antibody. The immunoprecipitates were probed by immunoblotting (IB) with the antibody indicated. PY, phosphotyrosine. Whole cell lysates (WCL) were also immunoblotted with EphB1 or β-actin antibody as a loading control for equal protein loading of the 3 cell lines.
Overexpression of EphB1 Does Not Correlate With Migration and Invasion of U251 and U87 Cells
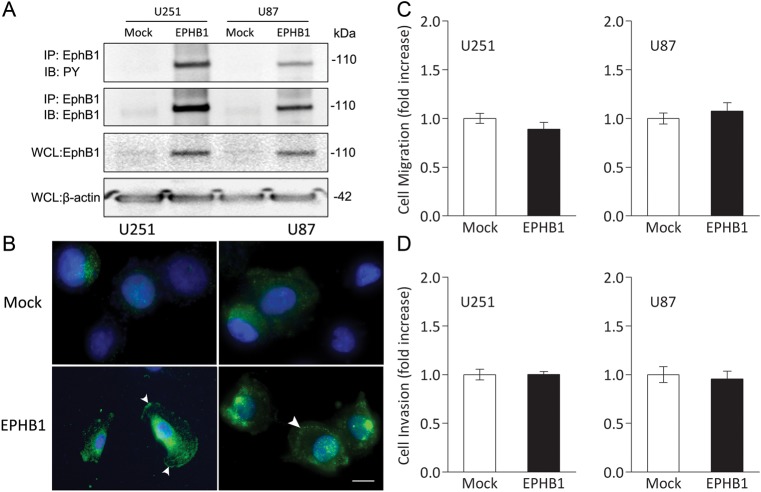
We investigated whether EphB1 overexpression may regulate chemotactic cell migration and invasion in the absence of its ligand, ephrin-B. EphB1 vector was transfected into U251 and U87 cells, which are relatively lower expressors of EphB1 (Fig. 2). Forced expression of the EphB1 receptor was accompanied by phosphorylation of the transfected EphB1 receptor, whereas transfection with empty plasmid vector had no effect on endogenous EphB1 phosphorylation (Fig. 3A). To further characterize increased levels by EphB1, we investigated the subcellular localization of EphB1. The cell shapes of mock and EphB1 transfectants seem to be similar (data not shown). Figure 3B shows that EphB1 was faintly and uniformly distributed in the cytoplasm, with no discreet localization at the cell membrane in the transfectants with empty vector. By transfection with EphB1 vector, EphB1 was upregulated and became localized mainly at the plasma membrane. The observation of the cytological localization of EphB1 was consistent with the membrane-anchored character of a transmembrane protein.
Fig. 3.
Cell migration and invasion analysis of glioma cell lines overexpressing EphB1. (A) Extracts of U251 and U87 cells transiently transfected with empty plasmid vector (mock) or EphB1 vector (EPHB1) were immunoprecipitated (IP) with anti-EphB1 antibody. The immunoprecipitates were probed by immunoblotting (IB) as indicated. Whole cell lysates (WCL) were subjected to immunoblot with anti-EphB1 antibody and anti–β-actin antibody to control for equal protein loading of cell samples. PY, phosphotyrosine. (B) U251 and U87 cells transiently transfected with empty plasmid vector or EphB1 vector were immunostained with an antibody against EphB1 and DAPI. EphB1 and nuclei were stained in green and blue, respectively. Arrowheads, localization of EphB1 at the plasma membrane. Scale bar, 50 μm. (C) U251 and U87 cells transiently transfected with empty plasmid vector or EphB1 vector were plated on fibronectin-coated membranes in a chemotaxis chamber. Cells migrated to the underside surface of membrane for 8–10 h, then migrated cells were stained and absorbance measured at 590 nm. The mean absorbance (590 nm) value from mock-transfected cells in each cell line was shown as 1. Bars, SD; n = 6. (D) U251 and U87 cells were treated and then plated on membranes precoated with Matrigel in a chemotaxis chamber. Cells invaded to the underside surface of membrane for 16–20 h, then invaded cells were stained and counted in at least 6 high-powered fields in each of 3 experiments. The mean value from mock-transfected cells in each cell line was normalized as 1. Bars, SD; n = 6.
Overexpression of EphB1 alone, in the absence of ligand stimulation, provided no obvious change in migration of U251 and U87 cells (mean ± SD, 0.89 ± 0.15 fold and 1.07 ± 0.20 fold, respectively) relative to mock-transfected cells (1.00 ± 0.17 and 1.00 ± 0.13 fold, respectively) in the cell migration assay (Fig. 3C). The effects of upregulated EphB1 on cell invasion were tested. As shown in Fig. 3D, cell invasion through membranes coated with Matrigel also did not show significant difference between U251 and U87 cells expressing EphB1 (mean ± SD, 0.95 ± 0.08 fold and 0.91 ± 0.16 fold, respectively) and the mock-transfected cells (1.00 ± 0.15 and 1.00 ± 0.22 fold, respectively). This series of experiments confirmed that overexpression of EphB1 alone does not alter migration and invasion of U251 and U87 cells, suggesting that EphB1 absent ligand activation does not affect glioma migration and invasion in vitro.
Ligand-dependent EphB1 Phosphorylation Suppresses Migration and Invasion of SNB19 and U251 Cells
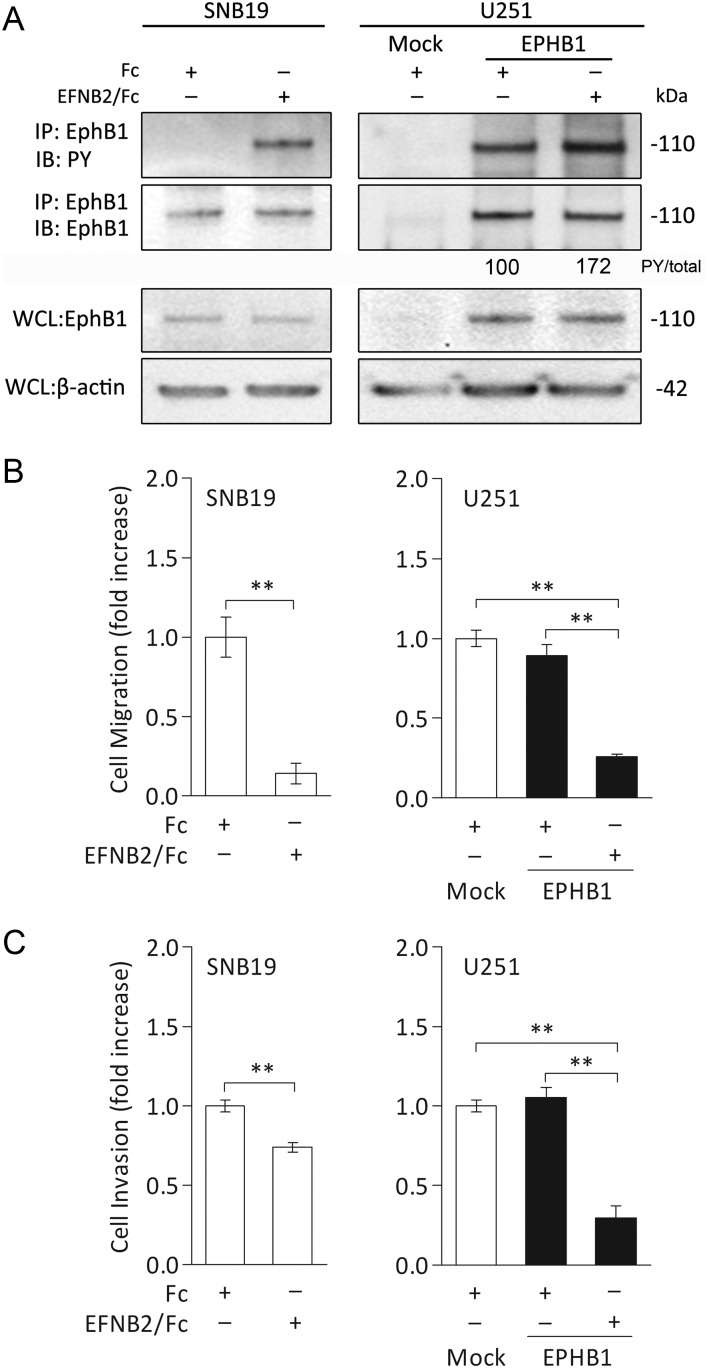
We have previously demonstrated that ephrin-B2 ligand is overexpressed in GBM.7 To examine the functional role of phosphorylated EphB1 upon ligand stimulation in human gliomas, we used a recombinant ephrin-B2 to activate EphB1 in wild-type SNB19 and in EphB1-transfected U251 cells. As shown in Fig. 4A, phosphorylation of endogenous EphB1 was induced by exposure to ephrin-B2/Fc chimera in SNB19 cells. EphB1 phosphorylation in U251 cells transfected with EphB1 vector was recognized and was further increased by stimulation with ephrin-B2/Fc chimera (1.7 fold).
Fig. 4.
Cell migration and invasion analysis of glioma cell lines stimulated with ephrin-B2/Fc chimera. (A) Extracts of SNB19 and U251 cells transfected with empty plasmid vector (mock) or EphB1 vector (EPHB1) were immunoprecipitated (IP) with anti-EphB1 antibody. Cells were treated with 2.0 μg/mL soluble ephrin-B2/Fc (EFNB2/Fc) or control Fc fragment (Fc) for 10 min before collection. Whole cell lysates (WCL) were also immunoblotted (IB) with anti-EphB1 antibody and anti–β-actin antibody as a loading control. PY, phosphotyrosine. The numerical values indicate relative ratios as a percentage of the PY/total (PY-EphB1:total-EphB1) band in EphB1 transfectants after scanning and analysis using software by Nucleovison (NucleoTech). (B) SNB19 and U251 cells were treated and then plated on fibronectin-coated membranes in a chemotaxis chamber. Ephrin-B2/Fc or control Fc fragment was applied to a final concentration of 2.0 μg/mL for 10 min to the lower chamber. Cells migrated to the underside surface of membrane for 8–10 h, then migrated cells were stained and absorbance measured at 590 nm. The mean absorbance (590 nm) value from the cells treated with control Fc in SNB19 or mock-transfected U251 was shown as 1. Bars, SD; n = 6, **P < .01. (C) Cells were treated as previously and then applied to the invasion assay. Columns, mean cell counts from at least 6 fields in each of 3 experiments. The mean value from the cells treated with control Fc in SNB19 or mock-transfected U251 was normalized as 1. Bars, SD; n = 6, **P < .01.
Functional assays were performed to assess the effects of increased EphB1 phosphorylation by the stimulation of ephrin-B2 on migration of glioma cells. Ephrin-B2/Fc chimera effectively suppressed migration of SNB19 cells (mean ± SD, 0.14 ± 0.06 fold; P < .01) compared with control Fc fragment (1.00 ± 0.28 fold). Similar outcomes were obtained with U251 cells; migration was significantly suppressed by ephrin-B2 stimulation in EphB1 transfectant (0.26 ± 0.04 fold; P < .01) relative to cells treated with control Fc fragment (0.89 ± 0.15 fold; Fig. 4B).
Invasion assay data also indicated that ephrin-B2/Fc chimera significantly suppressed invasion of SNB19 cells (0.74 ± 0.03 fold; P < .01) compared with control Fc fragment (1.00 ± 0.04 fold). The invasion of U251 cells expressing EphB1 was also suppressed by ephrin-B2/Fc (0.30 ± 0.18 fold; P < .01) relative to cells treated with control Fc fragment (1.05 ± 0.15 fold; Fig. 4C), whereas mock transfectant had no detectable effect (1.00 ± 0.09 fold). These results indicate that activation of EphB1 phosphorylation in a ligand-dependent manner retards glioma cell migration and invasion in vitro.
EphB1 Recovers Cell Morphology Induced by Ephrin-B2
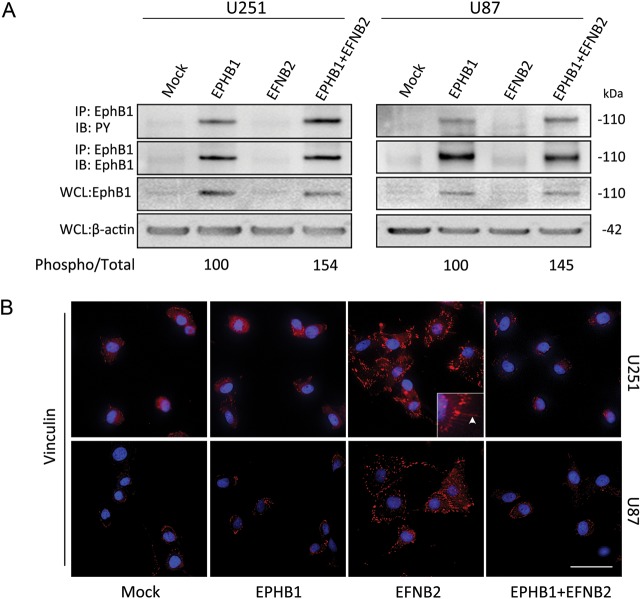
To explore the molecular mechanisms that mediate ligand-dependent inhibition of chemotaxis by EphB1 in glioma cells, EphB1 was cotransfected with ephrin-B2 in U251 and U87 cells. Immunoprecipitation and western blots demonstrated that EphB1 phosphorylation was visibly enhanced by cotransfection with ephrin-B2 and EphB1vector relative to EphB1 vector alone in both U251 and U87 cells (Fig. 5A).
Fig. 5.
Morphological change of glioma cells cotransfected with EphB1 and ephrin-B2. (A) U251 and U87 cells transiently transfected with EphB1 vector (EPHB1) and/or ephrin-B2 vector (EFNB2), or empty plasmid vector (mock). Immunoprecipitation (IP) using total cell lysate from indicated cells was performed. Equal amounts of cell lysates were immunoprecipitated with anti-EphB1 antibody. The immunoprecipitates were probed by immunoblotting (IB) with antibody against EphB1 and antibody against phosphotyrosine (PY). Whole cell lysates (WCL) were also immunoblotted with anti-EphB1 antibody and anti–β-actin antibody as a loading control. The numerical values indicate relative ratios as a percentage of the control (EPHB1) for band of phospho/total (EPHB1 + EFNB2) after scanning and densitometric analysis using Nucleovison (NucleoTech). (B) U251 and U87 cells subjected to transient transfection with EphB1 and/or ephrin-B2 vector or empty plasmid vector were fixed and then labeled to detect vinculin. Note that the cells expressing ephrin-B2 showed dramatic cytoskeletal changes and strong punctate stainings of vinculin, whereas EphB1 and mock-transfected cells appear similar. Cotransfection of EphB1 with ephrin-B2 abrogated the cell shape changes induced by ephrin-B2. Inset: higher magnification. Arrowheads, filopodial-like cytoplasmic projections. Cell nuclei were labeled with DAPI in blue. Scale bar, 50 μm.
To examine the effect of EphB1 phosphorylation on cellular morphology, we investigated focal adhesion protein-vinculin and the cytoskeleton structure of U251 and U87 cells expressing EphB1 and/or ephrin-B2. U251 and U87 cells expressing EphB1 showed no differences in cell morphology compared with mock transfectants; cells showed a normal flat morphology (Fig. 5B). By contrast, we observed a morphological transition in cells expressing ephrin-B2 from flat shapes to spreading, jellyfish-like structures. Concomitantly, the cells showed the appearance of a ringlike bundle of strong, punctate vinculin staining in filopodial-like cytoplasmic projections (typical of migrating cells; Fig. 5B, panel “EFNB2”). Interestingly, cotransfection with EphB1 and ephrin-B2 blocked the cell shape changes induced by ephrin-B2 (Fig. 5B, panel “EPHB1 + EFNB2”).
EphB1 Abolishes Ephrin-B2 Induced Migration and Invasion
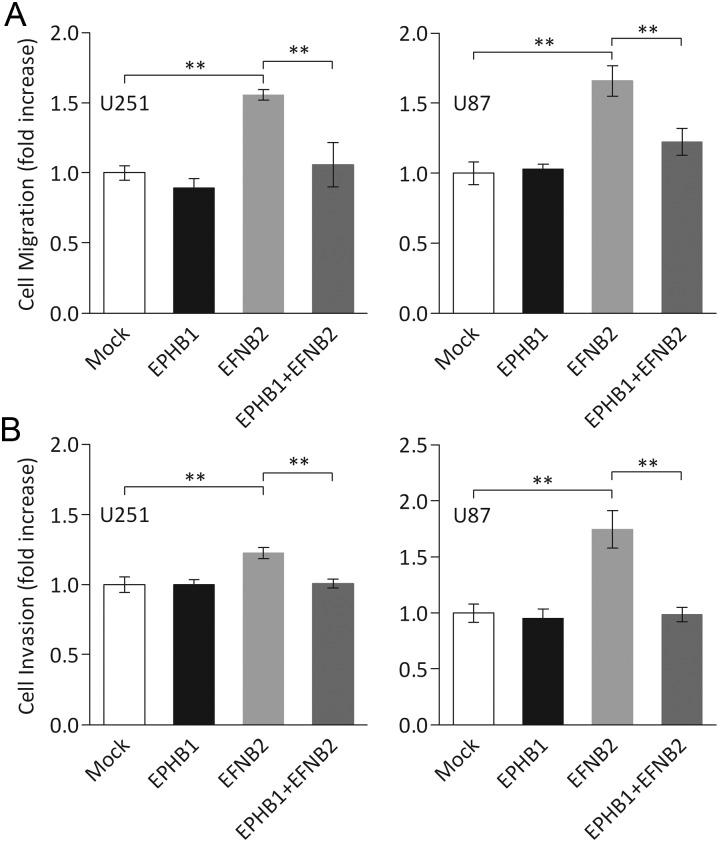
We have previously demonstrated that ephrin-B2 signaling promotes migration and invasion in glioma cells.7 To gain further insights into a potential role of EphB1 signaling in malignant behavior of human glioma, we performed migration and invasion assays on cells transfected with EphB1 and/or ephrin-B2 vectors. Migration assays revealed that overexpression of ephrin-B2 in U251 and U87 cells induced an increase in migration (mean ± SD, 1.56 ± 0.08 fold, P < .05; and 1.66 ± 0.24 fold, P < .05, respectively) relative to mock-transfected cells (1.00 ± 0.12 and 1.00 ± 0.18 fold; Fig. 6A) as previously shown.7 Cotransfection with EphB1 and ephrin-B2 vector led to measurable diminution of migration induced by ephrin-B2 in U251 and U87 cells (1.06 ± 0.35 fold, P < .05; and 1.22 ± 0.21 fold, P < .05, respectively), suggesting that EphB1 partly abolishes ephrin-B2 induced migration on glioma cells.
Fig. 6.
Cell migration and invasion analysis of glioma cell lines co-overexpressing EphB1 and ephrin-B2. (A) U251 and U87 cells transiently transfected with EphB1 (EPHB1) and/or ephrin-B2 vector (EFNB2) or empty plasmid vector (mock) were plated on fibronectin-coated membranes in a chemotaxis chamber. Cells migrated to the underside surface of membrane for 8–10 h, and migrated cells were stained and absorbance measured at 590 nm. The mean absorbance (590 nm) value from mock-transfected cells in each cell line was shown as 1. Bars, SD; n = 6, **P < .01. (B) Cells were treated as previously, then applied to the invasion assay. Columns, mean cell counts from at least 6 fields in each of 3 experiments. The mean value from the cells treated with control Fc in SNB19 or mock-transfected U251 was normalized as 1. Bars, SD; n = 6, **P < .01.
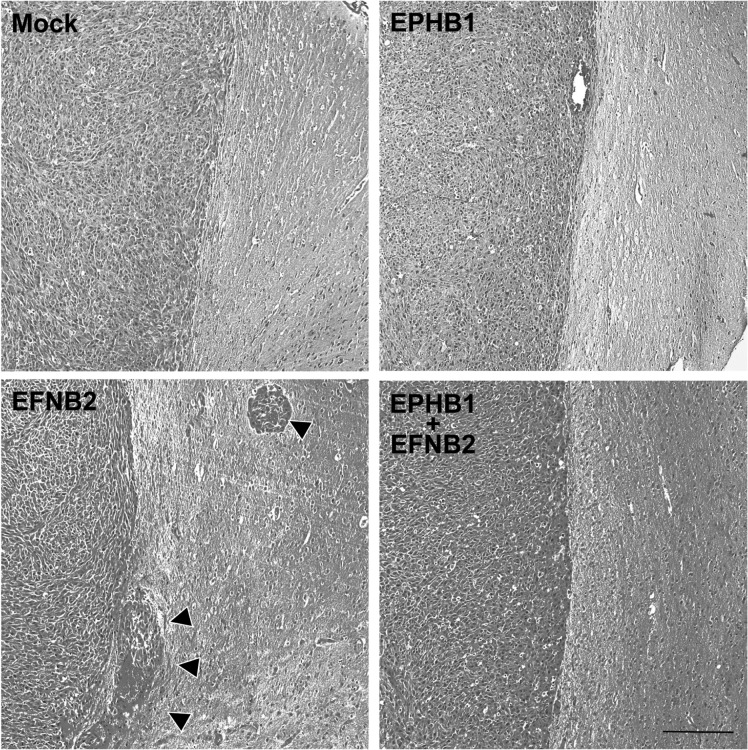
Similar findings were observed in an invasion assay. As shown in Fig. 6B, cell invasion through membranes coated with Matrigel was increased in U251 and U87 cells expressing ephrin-B2 (mean ± SD, 1.23 ± 0.11 fold, P < .05, and 1.74 ± 0.33 fold, P < .05, respectively) over mock-transfected cells (1.00 ± 0.14 and 1.00 ± 0.22 fold), whereas cotransfection with EphB1 and ephrin-B2 vector caused an inhibition of invasion in U251 and U87 cells (1.00 ± 0.08 fold, P < .05; and 0.99 ± 0.17 fold, P < .05, respectively), which counteracted the increased invasion by ephrin-B2 overexpression. Furthermore, the mouse model overexpressing ephrin-B2 showed increased tumor invasion, whereas mock- and EphB1-transfected models appeared similar. Cotransfection of EphB1 with ephrin-B2 abrogated the tumor invasion induced by ephrin-B2 (Fig. 7). These changes of migration and invasion were consistent with the effects on cell morphology. As in the proliferation, no significant change was observed in cells transfected with EphB1 and/or ephrin-B2 vector (Fig. 8). In total, analysis of these functional assays indicates that EphB1 abolishes ephrin-B2 signaling, which induces motility by glioma cells.
Fig. 7.
Tumor invasion assay of EphB1 and/or ephrin-B2 overexpressing U87 xenograft mouse model. U87 cells transiently transfected with EphB1 vector and/or ephrin-B2 vector (EFNB2) or empty plasmid vector (mock) were grown using a 60-mm dish for 48 h and then stereotactically injected into NOD/SCID mouse brain. Note that the model overexpressing ephrin-B2 showed increased tumor invasion (arrowheads), whereas mock- and EphB1-transfected models appeared similar. Cotransfection of EphB1 with ephrin-B2 abrogated the tumor invasion induced by ephrin-B2. Scale bar, 200 μm.
Fig. 8.
Cell proliferation analysis of glioma cell lines co-overexpressing EphB1 and ephrin-B2. U251 and U87 cells transiently transfected with EphB1 vector (EPHB1) and/or ephrin-B2 vector (EFNB2) or empty plasmid vector (mock) were grown using a 96-well plate for 4 h and then Alamar Blue was added. The plate was read on an absorbance microplate reader at the indicated time points. Bars, SD; n = 6.
Discussion
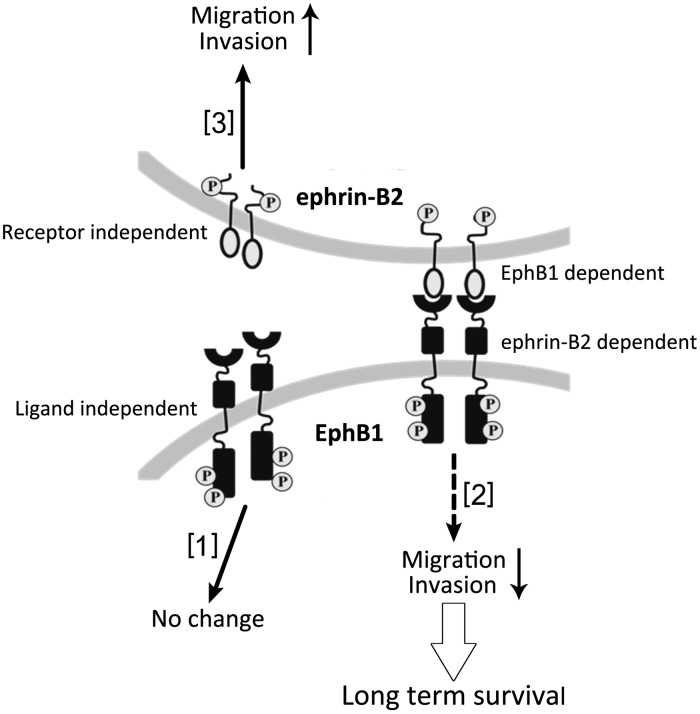
Eph receptors are important but paradoxical and controversial regulators of cancer development. Results presented here demonstrate that the role of EphB1 in regulating chemotactic migration and invasion of glioma cells has opposite effects depending on whether EphB1 is functioning ligand dependently or ligand independently (see Fig. 9). Our data mining indicates that in patients with malignant glioma, high EphB1 expression status is associated with longer survival. We also found that ligand-dependent EphB1 signaling significantly suppresses glioma invasion. Additionally, EphB1 signaling reversed cell morphological changes triggered by ephrin-B2 signaling and abolished the increased cell motility induced by ephrin-B2. These results support the action of EphB1 as a negative regulator of glioma cell invasion in a ligand-dependent mechanism; clinically, EphB1 expression serves as a favorable predictor for clinical outcome of glioma patients.
Fig. 9.
Schematic depiction of putative model of Eph/ephrin signaling. We report here that Eph kinase assumed to have 3 different signaling pathways: ligand independent [1], ligand-dependent EphB signaling [2], ephrin-B signaling [3]. [1], EphB1 kinase can be autophosphorylated without binding of ligands. This signaling does not affect glioma cell motility. [2], EphB1 becomes phosphorylated upon ligand–ephrin-B2 stimulation. This signaling suppresses glioma invasion. The inhibition of cell migration and invasion by this signaling may represent one possible mechanism responsible for long-term survival of malignant glioma patients. [3], we previously have shown that ephrin-B2 signaling induced glioma migration and invasion.7
Eph receptors are very attractive therapeutic targets and are expressed in a broad range of human cancers, including glioma and gastrointestinal, gynecological, breast, lung, and liver cancers.20,29,30 However, the function of EphB signaling in glioma is less well known than in breast, colorectal, and lung cancer. We previously reported that EphB2 is overexpressed in GBM and plays a positive role in promoting glioma cell invasion by eliciting signaling through R-Ras.18,22 In this study, we assessed individual EphB family member expression for clinical relevance (expression associated with tumor grade or patient survival) and identified only EphB1 as a favorable prognostic factor for malignant glioma. To our best knowledge, only one study has previously examined the impact of EphB expression on patient survival in human glioma. Tu et al.31 reported that EphB4 was significantly associated with the histopathological grade of gliomas using immunohistochemical analysis, and EphB4 expression was an independent poor prognostic factor for progression-free survival of GBM patients (n = 96). This is in agreement with data presented herein; we found that patients with high EphB4 levels had significantly shorter survival than patients with low EphB4 levels. To our knowledge, no literature has yet been reported concerning EphB1 receptors associated with the clinical outcome of malignancies. This study is the first to reveal that EphB1 expression correlates with patient survival of glioma.
The biological function of EphB1 signaling in tumor progression is poorly known.29 In our present data, we examined the function of EphB1 in glioma cell lines. Tyrosine phosphorylated EphB1 was minimally detectable in all cells tested, which have previously been demonstrated to be highly migratory cell lines.19 This result was in accordance with a previous study in colorectal cancer, in which the level of EphB1 negatively correlated the invasive ability.32 Another report also demonstrated that underexpression of EphB1 protein was significantly associated with invasion and metastasis in gastric carcinomas.33 Currently, no data have been reported concerning the induction of glioma cell motility by EphB1, although it is well established that EphB2 mediates glioma cell migration.18,19 The data in the present study reveal functional significance of EphB1 in glioma: EphB1 has ligand-dependent inhibitory effects on chemotactic cell migration. Upon examination of the data herein, a model emerges supporting the anti-oncogenic functions of EphB1.
Eph receptors have been associated with both tumor suppression and promotion. Putative reasons for paradoxical activities may reside in the different downstream signaling evoked by these receptors. In our study, EphB1 ligand-dependent signaling, but not ligand-independent signaling, reduced migration. We speculate that this may be caused by distinct downstream signaling. Miao et al.15 recently revealed the mechanism that converts the EphA2 receptor from a tumor suppressor (when activated by ephrin-A1 ligand, ligand-dependent signaling) to a tumor promoter (with phosphorylated Akt, ligand-independent signaling). EphA2 inhibits Akt and Ras/mitogen-activated protein kinase when activated by ephrin-A1, resulting in inhibited cell migration and proliferation. Similar mechanisms may occur in EphB1 ligand-dependent signaling. Additional analysis for the function of the downstream signaling pathways of EphB1 receptors dependent on ephrin-B binding in glioma will be required to further address this question.
We showed that ephrin-B2 reverse signaling triggered dramatic morphological changes and increased motility, which is consistent with our previous observations that ephrin-B2 reverse signaling increased motility of glioma cells.7 EphB1 forward signaling reversed cytoskeletal changes provoked by ephrin-B2 and abrogated the effects of migration and invasion induced by ephrin-B2 signaling. It is unknown what molecules are involved in these phenotypic changes downstream of ephrin-B2 signaling in glioma cells. A recent study demonstrated that ephrin-B2 is associated with endothelial cell morphology through Rho family small GTPases and motility independently of Eph-receptor binding.34 In response to ephrin-B1 reverse signaling, cells increase focal adhesion kinase catalytic activity, redistribute paxillin, loose focal adhesions, round up, and disassemble F-actin–containing stress fibers.35 Further investigation may reveal whether these sequelae occur consequent to ephrin-B2. Besides the mechanism of ephrin-B2 signaling, how an EphB1–ephrin-B2 interaction impinges on the cytoskeleton structure and cellular behavior in glioma cells is poorly understood. A previous report indicated that EphB4–ephrin-B2 interactions between adjacent cells lead to reduced cell motility and the reorganization of focal adhesions, and this interaction recruits the adaptor-molecule Crk and p130(Cas) signaling complex.36 Further investigation into the mechanism of EphB1–ephrin-B2 interaction is under way in our laboratory.
Finally, our study revealed that EphB1 kinase may evoke opposite effects in regulating chemotactic cell invasion and migration depending on ephrin-B2 binding to EphB1. Furthermore, overexpression of EphB1 acts as a favorable prognosis predictor for glioma patients. Further understanding of the negative regulation of ligand-dependent EphB1 signaling will expand our knowledge of the molecular pathogenesis of glioma. Our discovery provides novel insight into the mode of action of Eph receptors in cancer cells and represents a new facet in the complexities of Eph receptor function.
Conflict of interest statement. None declared.
Funding
This work was supported by a Grant-in-Aid for Scientific Research (C-23592117) from the Japan Society for the Promotion of Science (M. Nakada), Osaka Cancer Research Foundation (M. Nakada), and the China National Natural Scientific Fund (81201974, L. Teng). The First Affiliated Hospital of Harbin Medical University Foundation (2013Lx03, L. Teng).
Acknowledgments
We thank Akiko Imamura for technical help.
References
- 1.Rao JS. Molecular mechanisms of glioma invasiveness: the role of proteases. Nat Rev Cancer. 2003;3(7):489–501. doi: 10.1038/nrc1121. [DOI] [PubMed] [Google Scholar]
- 2.Nakada M, Nakada S, Demuth T, Tran NL, Hoelzinger DB, Berens ME. Molecular targets of glioma invasion. Cell Mol Life Sci. 2007;64(4):458–478. doi: 10.1007/s00018-007-6342-5. [DOI] [PMC free article] [PubMed] [Google Scholar]
- 3.Morokoff AP, Novak U. Targeted therapy for malignant gliomas. J Clin Neurosci. 2004;11(8):807–818. doi: 10.1016/j.jocn.2004.03.004. [DOI] [PubMed] [Google Scholar]
- 4.Ducray F. Chemotherapy for diffuse low-grade gliomas in adults. Revue Neurologique. 2011;167(10):673–679. doi: 10.1016/j.neurol.2011.08.006. [DOI] [PubMed] [Google Scholar]
- 5.Drappatz J, Norden AD, Wen PY. Therapeutic strategies for inhibiting invasion in glioblastoma. Expert Rev Neurother. 2009;9(4):519–534. doi: 10.1586/ern.09.10. [DOI] [PubMed] [Google Scholar]
- 6.Flanagan JG, Gale NW, Hunter T, Pasquale EB, TessierLavigne M. Unified nomenclature for Eph family receptors and their ligands, the ephrins. Cell. 1997;90(3):403–404. doi: 10.1016/s0092-8674(00)80500-0. [DOI] [PubMed] [Google Scholar]
- 7.Nakada M, Anderson EM, Demuth T, et al. The phosphorylation of ephrin-B2 ligand promotes glioma cell migration and invasion. Int J Cancer. 2010;126(5):1155–1165. doi: 10.1002/ijc.24849. [DOI] [PMC free article] [PubMed] [Google Scholar]
- 8.Pasquale EB. Eph receptor signalling casts a wide net on cell behaviour. Nat Rev Mol Cell Biol. 2005;6(6):462–475. doi: 10.1038/nrm1662. [DOI] [PubMed] [Google Scholar]
- 9.Wilkinson DG. Multiple roles of EPH receptors and ephrins in neural development. Nat Rev Neurosci. 2001;2(3):155–164. doi: 10.1038/35058515. [DOI] [PubMed] [Google Scholar]
- 10.Heroult M, Schaffner F, Augustin HG. Eph receptor and ephrin ligand-mediated interactions during angiogenesis and tumor progression. Exp Cell Res. 2006;312(5):642–650. doi: 10.1016/j.yexcr.2005.10.028. [DOI] [PubMed] [Google Scholar]
- 11.Pasquale EB. Eph-ephrin bidirectional signaling in physiology and disease. Cell. 2008;133(1):38–52. doi: 10.1016/j.cell.2008.03.011. [DOI] [PubMed] [Google Scholar]
- 12.Campbell TN, Robbins SM. The Eph receptor/ephrin system: an emerging player in the invasion game. Curr Issues Mol Biol. 2008;10(1–2):61–66. [PubMed] [Google Scholar]
- 13.Wang SD, Rath P, Lal B, et al. EphB2 receptor controls proliferation/migration dichotomy of glioblastoma by interacting with focal adhesion kinase. Oncogene. 2012;30(50):5132–5143. doi: 10.1038/onc.2012.16. [DOI] [PMC free article] [PubMed] [Google Scholar]
- 14.Noren NK, Yang NY, Silldorff M, Mutyala R, Pasquale EB. Ephrin-independent regulation of cell substrate adhesion by the EphB4 receptor. Biochem J. 2009;422(3):433–442. doi: 10.1042/BJ20090014. [DOI] [PMC free article] [PubMed] [Google Scholar]
- 15.Miao H, Li DQ, Mukherjee A, et al. EphA2 mediates ligand-dependent inhibition and ligand-independent promotion of cell migration and invasion via a reciprocal regulatory loop with Akt. Cancer Cell. 2009;16(1):9–20. doi: 10.1016/j.ccr.2009.04.009. [DOI] [PMC free article] [PubMed] [Google Scholar]
- 16.Genander M, Halford MM, Xu NJ, et al. Dissociation of EphB2 signaling pathways mediating progenitor cell proliferation and tumor suppression. Cell. 2009;139(4):679–692. doi: 10.1016/j.cell.2009.08.048. [DOI] [PMC free article] [PubMed] [Google Scholar]
- 17.Chen J, Zhuang G, Frieden L, Debinski W. Eph receptors and ephrins in cancer: common themes and controversies. Cancer Res. 2008;68(24):10031–10033. doi: 10.1158/0008-5472.CAN-08-3010. [DOI] [PMC free article] [PubMed] [Google Scholar]
- 18.Nakada M, Niska JA, Tran NL, McDonough WS, Berens ME. EphB2/R-Ras signaling regulates glioma cell adhesion, growth, and invasion. Am J Pathol. 2005;167(2):565–576. doi: 10.1016/S0002-9440(10)62998-7. [DOI] [PMC free article] [PubMed] [Google Scholar]
- 19.Nakada M, Niska JA, Miyamori H, et al. The phosphorylation of EphB2 receptor regulates migration and invasion of human glioma cells. Cancer Res. 2004;64(9):3179–3185. doi: 10.1158/0008-5472.can-03-3667. [DOI] [PubMed] [Google Scholar]
- 20.Batlle E, Bacani J, Begthel H, et al. EphB receptor activity suppresses colorectal cancer progression. Nature. 2005;435(7045):1126–1130. doi: 10.1038/nature03626. [DOI] [PubMed] [Google Scholar]
- 21.Huusko P, Ponciano-Jackson D, Wolf M, et al. Nonsense-mediated decay microarray analysis identifies mutations of EPHB2 in human prostate cancer. Nat Genet. 2004;36(9):979–983. doi: 10.1038/ng1408. [DOI] [PubMed] [Google Scholar]
- 22.Noren NK, Pasquale EB. Paradoxes of the EphB4 receptor in cancer. Cancer Res. 2007;67(9):3994–3997. doi: 10.1158/0008-5472.CAN-07-0525. [DOI] [PubMed] [Google Scholar]
- 23.Madhavan S, Zenklusen JC, Kotliarov Y, Sahni H, Fine HA, Buetow K. REMBRANDT: helping personalized medicine become a reality through integrative translational research. Mol Cancer Res. 2009;7(2):157–167. doi: 10.1158/1541-7786.MCR-08-0435. [DOI] [PMC free article] [PubMed] [Google Scholar]
- 24.Nakada M, Drake KL, Nakada S, Niska JA, Berens ME. Ephrin-B3 ligand promotes glioma invasion through activation of Rac1. Cancer Res. 2006;66(17):8492–8500. doi: 10.1158/0008-5472.CAN-05-4211. [DOI] [PubMed] [Google Scholar]
- 25.Yoshida Y, Nakada M, Sugimoto N, et al. Sphingosine-1-phosphate receptor type 1 regulates glioma cell proliferation and correlates with patient survival. Int J Cancer. 2009;126(10):2341–2352. doi: 10.1002/ijc.24933. [DOI] [PubMed] [Google Scholar]
- 26.Okamoto H, Takuwa N, Yokomizo T, et al. Inhibitory regulation of Rac activation, membrane ruffling, and cell migration by the G protein-coupled sphingosine-1-phosphate receptor EDG5 but not EDG1 or EDG3. Mol Cell Biol. 2000;20(24):9247–9261. doi: 10.1128/mcb.20.24.9247-9261.2000. [DOI] [PMC free article] [PubMed] [Google Scholar]
- 27.Teng L, Nakada M, Zhao SG, et al. Silencing of ferrochelatase enhances 5-aminolevulinic acid–based fluorescence and photodynamic therapy efficacy. Br J Cancer. 2011;104(5):798–807. doi: 10.1038/bjc.2011.12. [DOI] [PMC free article] [PubMed] [Google Scholar]
- 28.MacDonald IJ, Dougherty TJ. Basic principles of photodynamic therapy. J Porphyr Phthalocya. 2001;5(2):105–129. [Google Scholar]
- 29.Brantley-Sieders DM. Clinical relevance of Ephs and ephrins in cancer: lessons from breast, colorectal, and lung cancer profiling. Semin Cell Dev Biol. 2012;23(1):102–108. doi: 10.1016/j.semcdb.2011.10.014. [DOI] [PMC free article] [PubMed] [Google Scholar]
- 30.Ji XD, Li G, Feng YX, et al. EphB3 is overexpressed in non-small-cell lung cancer and promotes tumor metastasis by enhancing cell survival and migration. Cancer Res. 2011;71(3):1156–1166. doi: 10.1158/0008-5472.CAN-10-0717. [DOI] [PubMed] [Google Scholar]
- 31.Tu YY, He SM, Fu JF, et al. Expression of ephrinB2 and EphB4 in glioma tissues correlated to the progression of glioma and the prognosis of glioblastoma patients. Clin Transl Oncol. 2012;14(3):214–220. doi: 10.1007/s12094-012-0786-2. [DOI] [PubMed] [Google Scholar]
- 32.Sheng Z, Wang JD, Dong YC, et al. EphB1 is underexpressed in poorly differentiated colorectal cancers. Pathobiology. 2008;75(5):274–280. doi: 10.1159/000151707. [DOI] [PubMed] [Google Scholar]
- 33.Wang JD, Dong YC, Sheng Z, et al. Loss of expression of EphB1 protein in gastric carcinoma associated with invasion and metastasis. Oncology. 2007;73(3–4):238–245. doi: 10.1159/000127421. [DOI] [PubMed] [Google Scholar]
- 34.Bochenek ML, Dickinson S, Astin JW, Adams RH, Nobes CD. Ephrin-B2 regulates endothelial cell morphology and motility independently of Eph-receptor binding. J Cell Sci. 2010;123(Pt 8):1235–1246. doi: 10.1242/jcs.061903. [DOI] [PMC free article] [PubMed] [Google Scholar]
- 35.Cowan CA, Henkemeyer M. The SH2/SH3 adaptor Grb4 transduces B-ephrin reverse signals. Nature. 2001;413(6852):174–179. doi: 10.1038/35093123. [DOI] [PubMed] [Google Scholar]
- 36.Foo SS, Turner CJ, Adams S, et al. Ephrin-B2 controls cell motility and adhesion during blood-vessel-wall assembly. Cell. 2006;124(1):161–173. doi: 10.1016/j.cell.2005.10.034. [DOI] [PubMed] [Google Scholar]


