

Abstract
Background
Metastasis-associated in colon cancer 1 (MACC1) has been established as an independent prognostic indicator of metastasis formation and metastasis-free survival for patients with colon cancer and other solid tumors. However, no data are available concerning MACC1 expression in human astrocytic tumors. Glioblastoma multiforme (GBM) is the most prevalent primary brain tumor of adulthood, and due to its invasive and rapid growth, patients have unfavorable prognoses. Although these tumors rarely metastasize, their invasive and migratory behavior is similar to those of metastatic cells of tumors of different origin. Thus, we hypothesized that MACC1 may be involved in progression of human gliomas.
Methods
We performed real-time measurements of proliferation and migration in MACC1-transfected GBM cell lines (U138, U251) and evaluated tumor formation in organotypic hippocampal slice cultures of mice. Semiquantitative and quantitative real-time reverse transcription PCR analyses were performed for MACC1 and for its transcriptional target c-Met in human astrocytoma of World Health Organization grade II (low-grade astrocytoma) and GBM biopsies. Data were validated by MACC1 immunohistochemistry in independent matched samples of low-grade astrocytoma and GBM.
Results
MACC1 increases the proliferative, migratory, and tumor-formation abilities of GBM cells. The c-Met inhibitor crizotinib reduced MACC1-induced migration and tumor formation in organotypic hippocampal slice cultures of mice. Analyzing patients’ biopsies, MACC1 expression increased concomitantly with increasing World Health Organization grade. Moreover, MACC1 expression levels allowed discrimination of dormant and recurrent low-grade astrocytomas and of primary and secondary GBM. Strong MACC1 expression correlated with reduced patient survival.
Conclusions
MACC1 may represent a promising biomarker for prognostication and a new target for treatment of human gliomas.
Keywords: astrocytoma WHO grade II, glioblastoma multiforme, MACC1, prognostication, progression
Metastasis is the most lethal attribute of cancer,1 and activation of invasion and metastasis is one of the hallmarks of cancer cells.2 Proliferation, deregulated adhesion, increased invasiveness, motility, resistance to apoptotic signals, and the ability to induce angiogenesis are characteristics of metastatic cells.2 Recently, metastasis-associated in colon cancer 1 (MACC1) has been discovered as an independent prognostic indicator of metastasis formation and metastasis-free survival for colon carcinoma patients.3 MACC1 expression is upregulated in malignant colon cancer tissues compared with normal tissues, like colon mucosa or liver, and occurs mainly at the crucial step of transition from the benign to the malignant phenotype.4 It induces cell migration, invasion, proliferation, colony formation, wound healing, and hepatocyte growth factor (HGF)–triggered scattering of colon cancer cells in cell culture. In tumor xenografts it causes tumor growth and metastasis.3,5 It is also discussed that it might be involved in the regulation of apoptosis.6
Mining of databases revealed high MACC1 expression not only in colorectal cancer, but also in pancreatic, ovarian, endometrial, cervical, breast, lung, liver, esophageal, and head and neck cancers.7 Meanwhile, different tumor entities have been analyzed for MACC1 expression by quantitative real-time reverse transcription (RT ) PCR and immunohistochemistry.8 Increased MACC1 expression was shown in advanced colorectal carcinomas,9–11 peritoneal-disseminated gastric carcinomas,12 recurrent lung adenocarcinomas,13,14 and vascular invasive hepatocellular carcinomas.15,16 To the best of our knowledge, there are no data on MACC1 expression in human astrocytic tumors available yet.
Diffuse low-grade astrocytomas (LGAs) of World Health Organization (WHO) grade II are well-differentiated tumors with diffuse infiltration of the adjacent brain parenchyma.17 Most of these tumors progress to anaplastic astrocytomas of WHO grade III or glioblastoma multiforme (GBM) of WHO grade IV within 4–5 years after diagnosis.18 This secondary GBM is distinguished from primary GBM, which arises de novo without detectable precursor lesion.19–21 However, GBM are the most prevalent, highly malignant, invasive, and difficult to treat primary brain tumors of adults. The treatment regimens of patients with GBM include neurosurgical tumor resection followed by local γ-irradiation and chemotherapy.17 However, in spite of multidisciplinary treatment, the median survival is only 14.6 months.22,23 Therefore, it is vital to identify new potential therapeutic targets for future therapies. Although these tumors rarely metastasize, their invasive and migratory behaviors are very similar to those of metastatic cells of tumors originating from other tissues. Thus, we hypothesized that MACC1 may also be involved in progression of human gliomas. This hypothesis was supported by the fact that HGF and its receptor c-Met have been shown to be upregulated in high-grade astrocytic tumors,24 thereby inducing migration of their cells.25–28 MACC1 binds to the Sp1 site of the c-Met promoter, controls c-Met promoter activity and expression, and thereby regulates c-Met–mediated signaling.29 Indeed, HGF/c-Met is one of the major signaling cascades regulated by MACC1 in colorectal cancer and is of major importance for both the malignant transformation and metastatic potential of colorectal tumor cells.30
Here we report that MACC1 overexpression promoted proliferation and migration of GBM cells in cell culture. Furthermore, MACC1 overexpression increased the rates of tumor formation in organotypic hippocampal slice cultures (OHSCs) derived from C57BL6/J mice, probably via upregulation of c-Met, as shown by crizotinib inhibitor experiments. In human malignant gliomas, MACC1 expression increased concomitantly with increasing WHO grade. Moreover, MACC1 expression levels allowed discrimination of dormant and recurrent LGAs and of primary and secondary GBM. Most importantly, strong MACC1 protein expression was associated with reduced patient survival. Taken together, these data indicate that MACC1 may represent a promising new biomarker for prognostication and a target for inhibition of proliferation and migration of astrocytic tumor cells.
Materials and Methods
Tissue Samples
Tumor biopsies were obtained from patients treated in the University Hospital Würzburg. Informed consent of patients was obtained for the acquisition of tumor material as approved by the local ethics committee. All GBM patients underwent surgical tumor resection followed by radiotherapy and temozolomide chemotherapy. The brain tumors were classified by routine histology based on WHO criteria.31,32 Normal brain (NB) tissue samples came from patients with epilepsy. Two independent cohorts were analyzed. The first one, summarized in Table 1, was used for semiquantitative and quantitative RT-PCR. Immediately after removal, these tissue samples were frozen at −80°C and then stored in liquid nitrogen for mRNA analysis. The second, independent cohort, summarized in Table 2, consisted of matched samples of LGA progressing to secondary GBM from the same patient, matched recurrent LGA samples (primary tumor and relapse from the same patient), samples of dormant LGA, and samples of primary GBM. These biopsies were formalin fixed and paraffin embedded for immunohistochemistry.
Table 1.
Clinical parameters of tumor samples analyzed by RT-PCR
| Tumor Number | Age, y | Sex | Diagnosis |
|---|---|---|---|
| LGA01 | 58 | F | LGA |
| LGA02 | 24 | M | LGA |
| LGA03 | 54 | M | LGA |
| LGA04 | 3 | M | LGAa |
| LGA05 | 12 | F | LGAa,b |
| LGA06 | 34 | M | LGA |
| LGA07 | 34 | M | LGA |
| LGA08 | 40 | F | LGA |
| GBM01 | 54 | F | GBMc |
| GBM02 | 18 | F | GBMa |
| GBM03 | 68 | M | GBM |
| GBM04 | 60 | M | GBM |
| GBM05 | 65 | M | GBM |
| GBM06 | 41 | M | GBMa |
| GBM07 | 69 | M | GBM |
| GBM08 | 62 | M | GBM |
| GBM09 | 62 | F | GBMd |
| GBM10 | 62 | F | GBM |
| GBM11 | 59 | F | GBM |
| GBM12 | 12 | F | GBM |
| GBM13 | 65 | M | GBM |
| GBM14 | 79 | M | GBM |
| GBM15 | 53 | M | GBM |
Diagnosis of the patients: LGA WHO grade II and GBM. If not stated otherwise, all samples are from initial surgery of primary tumor prior to treatment.
aNo information available about preceding surgery or treatment.
bProtoplasmatic astrocytoma.
cSample from recurrent tumor, treated by γ-irradiation and chemotherapy prior to surgery.
dSample from recurrent tumor, no information about additional therapy available.
Table 2.
Clinical parameters of tumor samples analyzed by immunohistochemistry
| Tumor Number | Age, y | Sex | Diagnosis |
|---|---|---|---|
| LGA progressing to secondary GBM | |||
| LGA09 ⇒ n. a. | 36 ⇒ n. a. | M | LGA ⇒ GBMa |
| LGA10 ⇒ GBM26 | 24 ⇒ 34 | M | LGA ⇒ GBM |
| LGA11 ⇒ GBM27 | 34 ⇒ 36 | M | LGA ⇒ GBM |
| LGA12 ⇒ GBM28 | 54 ⇒ 55 | M | LGA ⇒ GBM |
| LGA13 ⇒ GBM29 | 54 ⇒ 54 | F | LGA ⇒ GBM |
| LGA14 ⇒ n.a. | 40 ⇒ 43 | F | LGA ⇒ LGAIIIa |
| Recurrent LGA | |||
| LGA15 ⇒ LGA28 | 1 ⇒ 2 | F | LGA ⇒ LGA |
| LGA16 ⇒ LGA29 | 49 ⇒ 52 | F | LGA ⇒ LGA |
| LGA17 ⇒ LGA30 | 39 ⇒ 42 | F | LGA ⇒ LGA |
| LGA18 ⇒ LGA31 | 35 ⇒ 36 | M | LGA ⇒ LGA |
| LGA19 ⇒ LGA32 | 39 ⇒ 40 | M | LGA ⇒ LGA |
| LGA20 ⇒ n. a. | 40 ⇒ n. a. | M | LGA ⇒ LGAa |
| Dormant LGA | |||
| LGA21 | 41 | M | LGA |
| LGA22 | 65 | F | LGA |
| LGA23 | 12 | F | LGA |
| LGA24 | 31 | M | LGA |
| LGA25 | 45 | F | LGA |
| LGA26 | 27 | M | LGA |
| LGA27 | 69 | M | LGA |
| Primary GBM | |||
| GBM16 | 69 | M | GBM |
| GBM17 | 46 | M | GBM |
| GBM18 | 57 | M | GBM |
| GBM19 | 76 | M | GBM |
| GBM20 | 67 | M | GBM |
| GBM21 | 45 | M | GBM |
| GBM22 | 69 | M | GBM |
| GBM23 | 60 | M | GBM |
| GBM24 | 63 | M | GBM |
| GBM25 | 60 | F | GBM |
Abbreviation: n. a., not available.
Diagnosis of the patients: LGA WHO grade II, astrocytoma WHO grade III (LGAIII), and GBM.
aThis diagnosis is known, but samples were not available for analysis.
Cells, Cell Culture, and Generation of Stable MACC1-expressing Cell Lines
The human GBM cell lines U138 und U251 were purchased from Cell Lines Service. Cells were grown as reported elsewhere33 in 75-cm2 flasks (Corning) at 37°C in an atmosphere of 5.0% CO2 and 100% humidity. Since transfection efficacies of the glioblastoma cell lines were insufficient, we tested different transfection reagents for different incubation times (48 h and 72 h). In addition, we varied the ratios of plasmid (for testing transfection efficacy, we used pcDNA3.1/MACC1-GFP) and transfection reagent (0.5 μg plasmid with 1.5, 3, 6, or 12 μL transfection reagent; 1 μg plasmid with 1.5, 3, 6, or 12 μL transfection reagent; and 1.5 μg plasmid with 1.5, 3, 6, or 12 μL transfection reagent). Transfection efficacy was measured by fluorescence activated cell sorting analysis using the green fluorescent protein (GFP) signal attached to MACC1. Finally, U138 and U251 cells were transfected with pcDNA3.1/MACC1 (resulting in U138/MACC1 and U251/MACC1, respectively) or pcDNA3.1 as vector control (resulting in U138/vector and U251/vector, respectively) using 1 μg plasmid/8 μL Metafectene (Biontex) for 48 h. Stable MACC1-expressing cells were selected with 1 mg/mL neomycin (PAA Laboratories). For each experiment, at least 3 independent transfected clones were analyzed; one representative clone thereof is shown in Figures 1–3.
Fig. 1.

Real-time measurements of cell migration and proliferation in the MACC1-overexpressing GBM cell line U138. (A) The human GBM cell line U138 was stably transfected with pcDNA3.1/MACC1. Overexpression of MACC1 was determined by quantitative real-time RT-PCR, as well as by Western blotting using MACC1- and V5-specific antibodies (vs U138/vector cells, respectively). (B) Anchorage-independent cell proliferation was analyzed by soft agar colony formation assay. MACC1-expressing cells showed a significant increase of formed colonies to 138% (vs U138/vector; P = .026). (C and D) Cell proliferation as determined by the xCELLigence system. Cell index values were monitored every 30 min for the first 12 h, and then every 15 min for the next 88 h (total time course of 100 h). (C) Real-time proliferation curve of U138/vector and U138/MACC1 cells. (D) MACC1-expressing cells show a statistically significant increased proliferation rate (P < .001). (E and F) Cell migration as determined by the xCELLigence system. Cell index values were monitored every 5 min for the first 25 h, and then every 15 min for the next 15 h (total time course of 40 h). (E) Real-time migration curve of U138/vector and U138/MACC1 cells. (F) MACC1-expressing cells show a statistically significant increased migration rate (P = .01).
Fig. 3.

Real-time measurements of cell migration in the MACC1-overexpressing GBM cell line U138 treated with crizotinib. (A) The human GBM cell line U138 was stably transfected with pcDNA3.1/MACC1. Expression of c-Met (Met/G6PDH) mRNA was determined by quantitative real-time RT-PCR in U138/vector as well as in U138/MACC1 cells. (B) Cell migration. For inhibitor experiments, the c-Met inhibitor crizotinib was added to a final concentration of 300 nM to U138/vector as well as to U138/MACC1 cells and cell migration was determined by the xCELLigence system. The area under the curve (AUC) of the cells incubated with (+) or without (−) 300 nM of the c-Met inhibitor crizotinib is shown.
RNA Extraction
Total mRNA was purified from 30 mg of tissue samples by the Nucleo-Spin RNA/Protein Kit (Macherey-Nagel) according to the manufacturer's instructions and as described previously.34 For quantitative real-time RT-PCR, total RNA was extracted with the Gene Matrix Universal RNA Purification Kit (Roboklon) and reverse transcribed. Purified RNA samples were stored at −80°C.
Semiquantitative RT-PCR and Quantitative Real-time RT-PCR
Semiquantitative RT-PCR was performed as described previously.34 The amount of cDNA was normalized to the respective expressions of the housekeeping gene glyceraldehyde 3-phosphate dehydrogenase (GAPDH).35 MACC1 cDNA amplification and expression analysis was performed using primers 5′-CTT GGT GTC AGA AAA AGT TTA TG-3′ (forward) and 5′-CTC CAG TGT TTA GTC ACA GG-3′ (reverse). Primers were designed and PCR was performed as described elsewhere.34,36 Thermocycle parameters for MACC1 were as follows: 10 min at 94°C; 36 cycles of 30 s at 94°C, 1 min at 53.3°C, 1 min at 72°C; and 10 min at 72°C. The parameters for GAPDH were 10 min at 94°C; 21 cycles of 30 s at 94°C, 30 s at 68°C, 1 min at 72°C; and 10 min at 72°C. The amplification products were separated on 1% agarose gels containing 0.07 µg/mL ethidium bromide.
Two-step quantitative real-time PCR was performed in parallel and in duplicate per sample, as described previously.3 For MACC1, amplicons of 136 bp were produced, using the following primers and probes: forward primer 5′-TTC TTT TGA TTC CTC CGG TGA-3′, reverse primer 5′-ACT CTG ATG GGC ATG TGC TG-3′, fluorescein isothiocyanate (FITC) probe 5′-GCA GAC TTC CTC AAG AAA TTC TGG AAG ATC TA-3′, LCRed640 probe 5′-AGT GTT TCA GAA CTT CTG GAC ATT TTA GAC GA-3′ (BioTeZ and TIB MolBiol). For c-Met, amplicons of 170 bp were produced, using the following primers and probes: forward primer 5′-GCT GGT GTT GTC TCA ATA TCA-3′, reverse primer 5′-GTT GGG CTT ACA CTT CGG-3′, FITC probe 5′-GCA TGT AAT TAG TTC GCT ACG ATG CA-3′, LCRed640 probe 5′-AGT ACA CAC TCC TCA TTT GGA TAG GCT TGT-3′ (BioTeZ and TIB MolBiol). For G6PDH, a 113-bp amplicon was generated (h-G6PDH Housekeeping Gene Set, Roche). PCR was performed for 10 min at 95°C and 45 cycles of 10 s at 95°C, 30 s at 60°C, 4 s at 72°C. The calibrator cDNA was derived from SW620 colon cancer cells and was employed in serial dilutions simultaneously in each run.
Western Blotting
Cell lysates were generated as described previously,3 separated in a 10% polyacrylamide gel (Invitrogen) and electroblotted. MACC1 protein expression was detected using antibody HPA020103 (1:1000; Sigma), and the amount of ectopic MACC1-V5 was evaluated via a V5-specific antibody (1:2500; Invitrogen).
Immunohistochemistry
GBM sections (2 μm) were cut from formalin-fixed, paraffin-embedded tissue blocks and stained as described34,36 using the anti-MACC1 antibody HPA020081 (Sigma) at a dilution of 1:250. MACC1 protein expression was visualized using the ZytoChem-Plus horseradish peroxidase broad spectrum kit (Zytomed Systems), which is based on the streptavidin-biotin system and contains diaminobenzidine as a substrate. Positive signals resulted in brown staining. The slides were counterstained with hematoxylin and analyzed using a light microscope (BX41, Olympus). Negative control experiments were carried out by staining with appropriate isotype control antibodies. Five different fields of view were photographed from each slide at a magnification of 60× and MACC1-positive tumor cells counted with support by ImageJ software, containing the cell counter plugin (available online at http://rsb.info.nih.gov/ij/).37
Real-time Electrical Impedance-based Monitoring of Cell Migration and Proliferation
For monitoring of cell migration and cell proliferation in real time, the xCELLigence Real-Time Cell Analyzer Dual Plate (RTCA DP) instrument was used according to the recommendations of the manufacturer (Roche Applied Science). The impedance is expressed as a dimensionless parameter termed cell index and is directly proportional to the area covered by cells. For detection of cellular migration, electrical impedance changes are measured at a gold microelectrode plated on the bottom of a membrane separating the upper and lower chambers.
For cell migration assays, 1 × 10⁵ cells in Dulbecco's modified Eagle's medium (DMEM) without fetal bovine serum (FBS) were seeded per well of a 16-well cell invasion and migration plate, and the lower chamber was loaded with DMEM supplemented with 10% FBS. For inhibitor experiments, the c-Met inhibitor PF-02341066 (crizotinib; Active Biochem) was added to a final concentration of 300 nM. Quantitative measurements of changes of the electrical impedance are expressed as cell index. For cell migration, cell index values were monitored every 5 min for the first 25 h, and then every 15 min for the next 15 h (total time course of 40 h). For cell proliferation, 1.5 × 10³ cells were seeded. The cell index was measured every 30 min for the first 12 h, and then every 15 min for the next 88 h (total time course of 100 h). At least 2 independent experiments were performed for monitoring cell migration and proliferation, respectively, each carried out in triplicate. Cell index values were calculated and plotted using the RTCA software 1.2.1 of the RTCA xCELLigence system.
Colony Formation Assay
Anchorage-independent cell proliferation was analyzed by the soft agar colony formation assay. Added to DMEM containing 0.33% weight/volume agarose and 10% FBS were 8 × 10³ U138/MACC1 or U138/vector cells and U251/MACC1 or U251/vector cells, respectively. Cells were seeded as single cells into the soft agar and incubated in a humidified incubator at 37°C and 5% CO2 for 14 days. Only colonies with more than 4 cells were counted. Independent colony formation experiments were repeated twice, each in triplicate.
Organotypic Hippocampal Slice Culture Assay
Animal experimentation was performed in accordance with the directive 2010/63/EU of the European Parliament and of the Council of the European Union (22 September 2010) on the protection of animals used for scientific purposes.
OHSCs were obtained from 5-day-old C57BL6/J mice. After decapitation, brains were dissected under aseptic conditions. The frontal pole and the cerebellum were removed and the brains were placed in minimal essential medium (MEM; Gibco BRL Life Technologies) containing 1% (volume/volume [v/v]) glutamine (Gibco), 0.1 mg/mL streptomycin (Sigma Aldrich), and 100 U/mL penicillin (Sigma Aldrich) at 4°C. Three to six 350 μm-thick OHSCs were prepared from each brain using a sliding vibratome (Leica VT 1200S) and immediately transferred into cell culture inserts (pore size 0.4 μm; Falcon, BD Biosciences Discovery Labware), which were placed in 6-well culture dishes (Falcon) containing 1 mL culture medium per well. The culture medium contained 50% (v/v) MEM, 25% (v/v) Hanks’ Balanced Salt Solution (Gibco), 25% (v/v) normal horse serum (Gibco), 2% (v/v) glutamine, 0.45% glucose (Braun), 0.1 mg/mL streptomycin (Sigma Aldrich), and 100 U/mL penicillin (Sigma Aldrich), pH 7.4. The culture dishes were incubated at 35°C in a fully humidified atmosphere with 5% (v/v) CO2. The cell culture medium was changed every second day. The OHSCs obtained from each brain were cultured for 14 days prior to starting the experiments.
To label the cells, 10 µL of carboxyfluorescein diacetate (CFDA) (Vybrant CFDA SE Cell Tracer Kit, Invitrogen) stock solution was applied to 10-mL culture flasks with tumor cells and incubated overnight. CFDA passively diffuses into the cell, where it reacts with intracellular compounds to form fluorescent conjugates, which are inherited by daughter cells. In a second set of experiments, the c-Met inhibitor PF-02341066 (crizotinib) was added at a final concentration of 500 nM to the culture medium of slice cultures and to the tumor cells 24 h prior to the experiments. On the next day, the cells were incubated with 2 mL trypsin/EDTA (Biochrom) and centrifuged and counted by using a hemocytometer (Roth). Ten microliters of the cell solution containing 105 cells was placed on the OHSCs. After 1, 2, 3, or 4 days, the untreated OHSCs were fixed overnight with 4% (v/v) paraformaldehyde (Sigma Aldrich). For the inhibitor experiments, the OHSCs were fixed after 2, 3, and 4 days.
OHSCs in the cell culture inserts were washed with phosphate buffered saline (PBS) for 10 min, followed by PBS containing 0.03% (v/v) Triton X-100 (PBS-T) for another 10 min. All OHSCs were incubated postfix with 5 μg/mL propidium iodide (Calbiochem) for 24 h to visualize the cytoarchitecture of the OHSCs as reported previously.38 On the next day, the OHSCs were washed with PBS-T for 10 min, then for 5 min with distilled water, cut out together with the membrane, and finally coverslipped with Dako fluorescent mounting medium.
The analysis was performed using a confocal laser scanning microscope (Leica TCS SP). For visualization of CFDA-labeled tumor cells, monochromatic light at 488 nm with a dichroic beam splitter (FT 488/543) and an emission band pass filter of 505–530 nm was used. For detection of propidium iodide, monochromatic light at 543 nm and an emission band pass filter of 585–615 nm were used. Confocal images were obtained using a 10× objective. Microtumors were imaged using a z-stack with a step width of 2 µm.
The obtained images were first analyzed with the ImageJ plugin Ovuscule39 that fits an ellipse to the tumor visible on a confocal laser scanning microscopy image. A cell cluster was regarded as a microtumor when it had a minimal diameter of 25 µm. This was done for every image of the according z-stack. The eccentricity and the mean planar radius of the tumor were calculated for every image of the z-stack. The mean planar radius was defined as the ratio of the major and the minor axis of the fitted ellipse. The eccentricity and the mean planar radius were than plotted over the depth, as well as a normalized radius, and eccentricity was defined as the ratio between radius/eccentricity divided by its mean value subtracted by 1. The calculation of tumor volume was approximated by multiplying the step width with the summed up area of the tumor. The number of formed tumors of every cell type per slice and 105 cells was calculated.
Statistical Analysis
The intensity of the DNA bands was quantified by densitometry using BioDocAnalyze software (Biometra). The DNA bands were normalized with respect to the expression of GAPDH. Box plots were generated and statistical analysis performed using GraphPad Prism 4 software. Statistical significance was defined by paired and unpaired 2-tailed t tests, reliant on whether matched or unmatched samples were compared, and by ANOVA. P < .05 was considered to be significant. For survival analysis, the median expression level of MACC1 protein in all GBM was determined; an expression smaller or equal to the median expression was defined as weak expression and an expression higher than the median expression as strong expression. Kaplan–Meier curves were generated using GraphPad Prism 4 software.
For cell motility and proliferation experiments, levels of statistical significance were evaluated by using a t test or a nonparametric 2-sided Mann–Whitney rank sum test depending on whether the data passed or failed a normal distribution test.
Results
MACC1 Overexpression Induces Proliferation of GBM Cells
MACC1 induces cell proliferation, motility, and metastasis of colon cancer cells.3 We queried whether MACC1 overexpression might affect cell proliferation and migration also in glioblastoma cells. Therefore, we generated human U138 and U251 GBM cells stably overexpressing MACC1, U138/MACC1 (Fig. 1A), and U251/MACC1 (Fig. 2A), respectively. Parental U138 and U251 GBM cells express MACC1 intrinsically at low levels. Ectopic overexpression of MACC1 was shown at the RNA level by quantitative real-time PCR and at the protein level with MACC1-specific and with V5-tag–specific antibodies. Effects of MACC1 overexpression on cell proliferation were first assessed for anchorage-independent proliferation by soft agar colony formation experiments. MACC1 overexpression resulted in significant increases in the number of formed colonies in U138/MACC1 cells versus U138/vector to 138% (P = .026; Fig. 1B) and in U251/MACC1 cells versus U251/vector to 127% (P = .029; Fig. 2B), respectively.
Fig. 2.

Real-time measurements of cell migration and proliferation in the MACC1-overexpressing GBM cell line U251. (A) The human GBM cell line U251 was stably transfected with pcDNA3.1/MACC1. Overexpression of MACC1 was determined by quantitative real-time RT-PCR as well as by Western blotting using MACC1- and V5-specific antibodies (vs U251/vector cells, respectively). (B) Anchorage-independent cell proliferation was analyzed by soft agar colony formation assay. MACC1-expressing cells showed a significant increase of formed colonies to 127% (vs U251/vector; P = .029). (C and D) Cell proliferation as determined by the xCELLigence system. Cell index values were monitored as described in Fig. 1. (C) Real-time proliferation curve of U251/vector and U251/MACC1 cells. (D) MACC1-expressing cells show a statistically significant increased proliferation rate (P = .046). (E and F) Cell migration as determined by the xCELLigence system. Cell index values were monitored as described in Fig. 1. (E) Real-time migration curve of U251/vector and U251/MACC1 cells. (F) MACC1-expressing cells show a statistically significant increased migration rate (P = .003).
For anchorage-dependent growth, we monitored the continuous real-time impedance-based cell proliferation using the xCELLigence system (Roche). We measured significantly increased areas under the curve for the proliferation of MACC1-overexpressing U138/MACC1 cells versus U138/vector cells (P < .001; Fig. 1C and D). A very similar result was obtained when comparing U251/MACC1 cells versus U251/vector cells (P = .046; Fig. 2C and D).
MACC1 Overexpression Induces Motility of GBM Cells via c-Met
Next, we analyzed the influence of MACC1 overexpression on cell motility. We performed impedance-based continuous real-time monitoring of cell migration by using the xCELLigence system. When calculating the areas under the curve in the migration assays, we found significantly increased cell migration for MACC1-overexpressing U138/MACC1 cells versus U138/vector cells (P = .01; Fig. 1E and F) and U251/MACC1 cells versus U251/vector cells (P = .003; Fig. 2E and F). The maximal cell index was higher in the MACC1-overexpressing cells compared with their vector-transfected counterparts, with maximal cell indexes for U138 of 2.46 versus 0.91 and 1.93 versus 1.34 for U251, respectively. In U138/MACC1 cells, c-Met mRNA expression was significantly elevated to 146% versus U138/vector (P = .028; Fig. 3A). Therefore, we repeated the migration analysis by treating the cells with 300 nM crizotinib, a c-Met inhibitor.40,41 Overexpression of MACC1 increased cell migration to 165% (P = .036). Treatment of U138/MACC1 cells with crizotinib reduced this MACC1-induced migratory ability to 104% (P = .005; Fig. 3B), which is comparable to the U138/vector cells. Treatment of U138/vector cells did not show any impact on cell migration. In summary, the c-Met inhibitor crizotinib reverted the MACC1-induced migratory behavior.
MACC1 Overexpression Increases Cell Invasion and Tumor Formation Rates in an OHSC Model of Mice
Since MACC1 expression induced GBM cell proliferation, migration, and colony formation, we analyzed tumor formation of MACC1-overexpressing U138 cells in OHSCs. Both MACC1-overexpressing U138/MACC1 cells and U138/vector control cells invaded the slices and regularly formed tumors. For U138/MACC1 cells, frequent formation of microtumors was visible already after 2 days, whereas only a few microtumors were found from day 3 on for U138/vector cells (Fig. 4A and B). At this time U138/MACC1 cells formed significantly larger (P = .0075; Fig. 4C) and more rounded tumors (P = .011; Fig. 4D) with a larger radius (P = .0005; Fig. 4E) compared with U138/vector cells. This finding accounts for processes involving a higher proliferation rate and weakened adhesion of the MACC1-positive tumor cells at this time point.42,43 After 4 days invasion time, the analysis of the mean planar radius and the eccentricity revealed comparable shapes, sizes, and volumes of both cell lines; probably the tumors reached a critical size, and solid tumors formed, so that the adhesion remained constant compared in controls with MACC1-overexpressing cells (Fig. 4C–E). However, looking at the number of tumors per slice and 100 000 cells, U138/MACC1 cells formed more tumors than U138/vector at every single culture time point (Fig. 4B), as well as 4.12 times more microtumors when averaging over the whole culture period (P = .0001). After treatment with the c-Met inhibitor crizotinib, the weighted mean of the number of formed tumors per slice and per 100 000 cells was significantly reduced from 3.01 ± 1.22 to 0.9 ± 0.4 (P = .037), which was comparable to the U138/vector cells with 0.73 ± 0.71 (Fig. 4A and B). Also the volume, eccentricity, and mean planar radius were reduced to comparable values as displayed by the U138/vector cells (Fig. 4C–E).
Fig. 4.

Tumor formation and morphological characterization of U138 cells in organotypic hippocampal slice cultures of mice with and without crizotinib. (A) Representative images of OHSC treated with U138/vector (upper panel), U138/MACC1 (middle panel), or U138/MACC1 + crizotinib (lower panel). Colonization of the OHSC by U138/MACC1 (middle panel) advanced in a shorter time period and by a higher number of tumor cells compared with U138/vector (upper panel) or cells treated with the c-Met inhibitor (lower panel). The cytoarchitecture was visualized by propidium iodide (red) and tumor cells were labeled by CFDA (green). (B) Quantification of the average tumor numbers per slide and 100 000 cells. (C) Quantification of averaged tumor volume in cubic micrometers with a minimal tumor diameter of 25 µm after 3 and 4 days. On day 3 a significant difference (P = .0075) was found between U138/MACC1 tumors and the vector control, which was reduced to basal levels by crizotinib. (D) Analysis of averaged eccentricities of U138/MACC1 and U138/vector tumors after 3 and 4 days in OHSC. After 3 days a significant difference between both cell types was observed (P = .011), which was prevented by the inhibitor. (E) Analysis of the mean radius of U138/MACC1 and U138/vector tumors after 3 and 4 days in OHSC. At day 3 a significant increase was observed for U138/MACC1 tumors vs vector controls (P = .0005), which was reverted by crizotinib. (B-E) Error bars: ± SEM; Abbreviation: n.d., not determined.
MACC1 mRNA Expression Is Upregulated in Human High-grade Versus Low-grade Glioma
The MACC1-induced cell proliferation and migration, as well as the increase in tumor formation capacity, prompted us to query whether MACC1 might be overexpressed in GBM, a tumor known for its migratory capacity. Therefore, we screened a panel of 3 NB specimens, 8 WHO grade II LGAs, and 15 GBM surgical tissue specimens for the expression of MACC1 mRNA by semiquantitative RT-PCR (Fig. 5). MACC1 mRNA was nearly absent in NB but clearly detectable in the tumor samples (Fig. 5A). Densitometric quantification revealed a statistically significant increase in relative expression strength (P = .0199) from a median of 0 in NB to 28.635 in LGA to 46.750 in GBM (Fig. 5B). These results were confirmed by quantitative real-time RT-PCR (Fig. 5C) using 1 NB, 12 LGAs, and 17 GBM. The median expression of MACC1 mRNA was significantly increased and about 3-fold higher in GBM compared with LGA (0.658% calibrator in LGA vs 1.486% calibrator in GBM; P = .0048). Thus, MACC1 expression levels correlated with progression of astrocytic tumors. In addition, we determined c-Met mRNA expression, as one of the MACC1 target genes, analyzed in parallel using the same RNA samples as for MACC1 (Fig. 5D). We found a significantly 7-fold increased c-Met expression in GBM compared with LGA (median c-Met mRNA expression in LGA 0.122% calibrator vs 0.755% in GBM; P = .039).
Fig. 5.

Expression analysis of MACC1 and c-Met mRNA in human astrocytic tumor samples by semiquantitative RT-PCR and quantitative real-time RT-PCR. (A) Total RNA from NB, LGA WHO grade II, and GBM tissue samples was used as a template for semiquantitative MACC1 RT-PCR analysis. For negative control, cDNA was excluded from the PCR reaction (−). The various cDNA concentrations were normalized to that of the housekeeping gene GAPDH, which was used as internal loading control. The size (bp) of the PCR products is indicated on the right. The numbers refer to the tumor samples used (Table 1). (B) Box plot analysis of densitometrically quantified MACC1 mRNA expression. ANOVA revealed a statistically significant increase of MACC1 mRNA expression (P = .0199). (C) Quantitative real-time MACC1 RT-PCR of human NB (n = 1), LGA (n = 12; median: 0.658), and GBM (n = 17; median: 1.486) tumor samples. The increase in MACC1 mRNA expression of GBM was statistically significant (P = .0048). (D) Quantitative real-time c-Met RT-PCR of human NB (n = 1), LGA (n = 12; median: 0.122), and GBM (n = 17; median: 0.755) tumor samples. The increase in c-Met mRNA expression in GBM was statistically significant (P = .039).
MACC1 Protein Expression Allows Distinction Between Different Stages of Glioma Development
The correlation of increased mRNA expression of MACC1 with increasing WHO grade of glioma encouraged us to examine differences in protein expression of MACC1. We performed immunohistochemistry using paraffin-embedded tissue sections derived from 24 LGAs and 14 GBM (Fig. 6). This panel was independent of the tumor samples analyzed by PCR for mRNA expression and contained matched samples of recurrent (initial tumor and recurrence were of the same WHO grade) and progressing tumors (initial tumor diagnosed as LGA, and relapse appeared as GBM) of the same patient. In NB the medullary layer and some neurons stained positive for MACC1. However, the astrocytes were clearly negative. LGA displayed a discrete staining of some tumor cells and of some pyramidal cells. In a slide with a normal fraction and tumor tissue at the edge, there was staining of some neurons and of individual tumor cells. GBM showed a heterogeneous picture within the same tumor. Isomorphic regions were less strongly stained than polymorphic cells. However, tumor cells were strongly positive, while regions with inflammation or necrosis remained negative for MACC1. Looking at single cells at a magnification of 100×, cytoplasmic staining was observed in LGA and primary GBM. However, we found nuclear staining in addition to cytoplasmic staining in secondary GBM (Fig. 6).
Fig. 6.
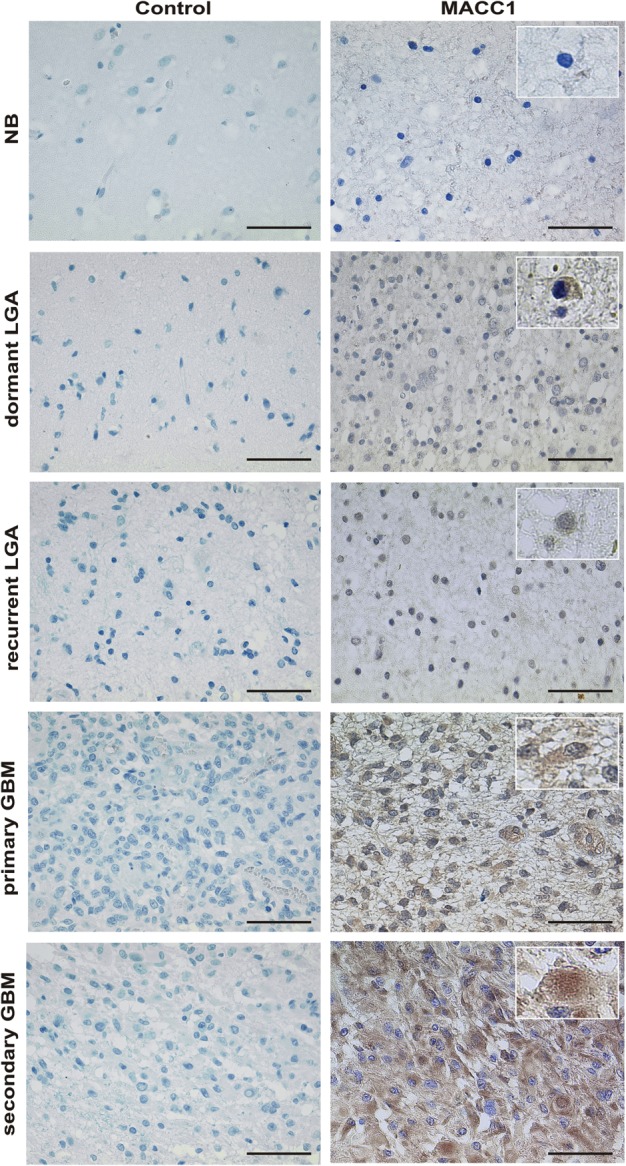
MACC1 expression on paraffin-embedded sections of representative tissue samples. MACC1 expression (brown signal) was visualized by staining with a specific antibody (right panel). Tissue stained with appropriate isotype control antibodies served as negative control (left panel). Magnification 40×. The scale bar indicates 50 µm. Shown are representative samples of a multiple system atrophy (NB; n = 1), of a dormant LGA WHO grade II (n = 7), of a recurrent LGA WHO grade II (n = 12), of primary GBM (n = 10), and of secondary GBM (n = 4). Insets show single cells at magnification 60× for analysis of intracellular MACC1 localization. Cytoplasmic staining in LGA and primary GBM and additional nuclear staining in secondary GBM are visible.
From each slide, 5 fields of view were taken as photographs at a magnification of 60×, and the MACC1-positive tumor cells were counted and related to the total number of tumor cells visible (Fig. 7). Whereas 14.71 ± 3.19% tumor cells were expressing MACC1 in LGA (n = 24), this number increased to 38.21 ± 6.54% in GBM (n = 14, P = .0009) (Fig. 7A). Analysis of subgroups of LGA revealed that only 4.29 ± 1.71% of the cells of dormant tumors, which show neither progression to a higher WHO grade nor recurrence with the same WHO grade (n = 7), were positive for MACC1, while 20.58 ± 5.59% of tumor cells stained positive in the recurrent tumor (n = 12, P = .0447; Fig. 7B). There was no significant difference in MACC1 expression between the initial LGA (13.60 ± 1.50%, n = 5) and recurrent astrocytoma of the same WHO grade (relapse) (21.17 ± 4.41%, n = 6, P = .3900; Fig. 7C), whilst MACC1-expressing cells increased significantly to 68.25 ± 8.67% in secondary GBM (n = 4) compared with 21.33 ± 10.94% of the initial LGA (n = 6, P = .0348; Fig. 7D). LGA with future relapse of the same WHO grade did not display different MACC1-expressing cell numbers to LGA progressing to secondary GBM (13.60 ± 1.50%, n = 5 and 21.33 ± 10.94%, n = 6, respectively, P = .5410; Fig. 7E). However, significantly fewer tumor cells were positive for MACC1 in primary GBM (26.20 ± 4.52%, n = 10) compared with secondary GBM (68.25 ± 8.67%, n = 4, P = .0005; Fig. 7F). Therefore, expression of MACC1 allows a distinction not only between LGA and GBM, but also between dormant LGA and relapse or between primary and secondary GBM.
Fig. 7.

Quantification of MACC1-positive tumor cells in relation to all tumor cells. MACC1 protein was stained with a specific antibody on paraffin-embedded tumor sections as representatively shown in Fig. 6. MACC1-positive tumor cells were counted in 5 fields of view at 60× magnification on each section and related to the total number of tumor cells visible. (A) Percentage of MACC1-positive tumor cells in all analyzed LGA (n = 24) in relation to all analyzed GBM (n = 14). Details about tumor samples are given in Table 2. The increased expression of MACC1 in GBM was statistically significant (2-tailed t test, P = .0009). (B) MACC1 expression in dormant LGA (n = 7) was lower compared to recurrent LGA (n = 12; 2-tailed t test, P = .0447). (C) Recurrent LGA (n = 5) did not show a significant difference in MACC1-positive cell number compared with their matched relapse of the same WHO grade (n = 6, paired 2-tailed t test, P = .3900). (D) LGA (n = 6) progressing to secondary GBM (n = 4) showed significantly lower numbers of MACC1-positive cells (paired 2-tailed t test, P = .0348). (E) The percentage of MACC1-positive cells was not significantly different between LGA with a future relapse (n = 5) and LGA progressing to secondary GBM (n = 6, 2-tailed t test, P = .5410). (F) Primary GBM (n = 10) expressed significantly lower amounts of MACC1 than secondary GBM (n = 4; 2-tailed t test, P = .0005). (G) Kaplan–Meier analysis of patients' survival with GBM. MACC1 expression in ≤33% of tumor cells (median expression) was defined as weak expression (n = 8), >33% positive tumor cells was defined as strong expression (n = 6). The difference in the survival curves was statistically significant (P = .0358).
Strong MACC1 Expression Is of Disadvantage for Patients’ Prognosis
We queried whether MACC1 expression may have an impact on the survival of patients with high-grade malignant gliomas. The median percentage of MACC1-expressing cells in all analyzed GBM was 33% of all tumor cells in the sample. We defined weak MACC1 expression as ≤33% positive cells in the tumor and strong expression as >33% MACC1-positive tumor cells and performed Kaplan–Meier analysis. The median survival time of patients strongly positive for MACC1 expression was 8 months (n = 6). In contrast, the median survival of patients only weakly expressing MACC1 was 16 months (n = 8). This difference in survival times was statistically significant (P = .0358; Fig. 7G) and shows that MACC1 correlates with the aggressiveness of the glioblastoma and may contribute to survival prognosis of the patients.
Discussion
Human gliomas are highly invasive tumors. This is due to the intensive migratory behavior of their cells, making oncological radical tumor resection nearly impossible and therefore recurrent tumor growth unavoidable.17 However, the mitotic activity of LGAs is low and their growth causes distortion but not destruction of the invaded brain structures. The median survival is ∼5 years after diagnosis.17 GBM, in contrast, comprises largely necrotic masses with a peripheral zone of fleshy gray tumor tissue, and the surrounding brain tissue usually shows a marked edema. Their cells display a higher mitotic activity.17 The median survival is only 14.6 months, despite multimodal therapy.22,23 The mechanisms and factors involved in astrocytic tumor invasion and proliferation are still not fully understood.
MACC1 has been shown to induce migration and proliferation in metastatic colon cancer cells and has been defined as an independent prognostic marker of metastasis formation and metastasis-free survival for colon cancer patients.3 Since GBM tumors are highly migratory and invasive, we performed real-time proliferation and migration assays using GBM cells overexpressing MACC1 to check whether MACC1 would have any effect on these cells. Indeed, cells expressing MACC1 migrated faster and showed an increased proliferation and higher colony formation capabilities compared with control cells. Furthermore, we analyzed the effect of MACC1 expression on invasion and tumor formation in OHSCs of mice. MACC1-expressing U138 cells invaded the slices more rapidly and deeper and formed more microtumors compared with vector control cells. The tumors of MACC1-expressing cells appeared larger and more round up. This might be the result of the fusion of multiple tumors inside the slice culture. It also indicates a higher proliferation rate and reduced adhesion of the cells at the beginning until a critical tumor size is reached and solid tumors are formed.42,43
We then checked for the expression of MACC1 in human malignant astrocytomas by semiquantitative and quantitative real-time RT-PCR, respectively. We found that MACC1 mRNA expression was nearly absent in NB but was statistically significantly upregulated with increasing WHO grade. Both semiquantitative and quantitative RT-PCR yielded the same results.
We confirmed these results by data mining The Cancer Genome Atlas dataset using the search term MACC1 and the platform Agilent G4502A_07 log2 with standard settings in the data browser (tcga-portal.nci.nih.gov/tcga-portal/AnomalySearch.jsp, February 2013). Eighty-two percent of the participants showed an overexpression of MACC1 (349 of 424 participants). We then checked microarray datasets deposited at Oncomine (www.oncomine.org, February 2013, Compendia Bioscience) for MACC1 overexpression by GBM. The Liang brain dataset revealed a fold change of 2.315 (P = .033) and the Sun brain dataset a fold change of 2.393 (P = 1.83E-4) for MACC1 expression by GBM compared with NB. The Lee brain dataset compared neural stem cells with GBM, and we found a fold change of 1.748 (P = .044) for MACC1 expression. These microarray data analyses therefore confirm our PCR results.
Our data are also in line with results for other tumor entities. MACC1 showed increased expression in metastatic colon cancer cells compared with nonmetastatic cells.3,11 Its expression was correlated with peritoneal-disseminated gastric carcinomas,12 vascular invasive hepatocellular carcinomas,15,16 and postoperative recurrence of non–small cell lung adenocarcinoma.13,14 Thus, MACC1 is upregulated in the more advanced and high-grade tumor cells.
The MACC1 gene is located on human chromosome 7p21.1 on the minus strand.3,7 It is discussed that the increase in MACC1 mRNA expression may be due to polysomy of chromosome 77,14 or specific gain of its p-arm,9 either of which is a common finding in the cancers we examined9,44–49 and in astrocytic tumors.50–53 It is striking that chromosome 7p amplification is exclusively detected in GBM and not in gliomas of lower WHO grade53 and that this amplification is associated with an overexpression of proteins encoded by this chromosomal region.51 On the cBio Cancer Genomics Portal54 (www.cbioportal.org, February 2013) we could confirm a positive correlation of MACC1 mRNA expression and MACC1 copy number alterations using MACC1 as a search term, the The Cancer Genome Atlas dataset, and standard settings of the portal.
However, only a few reports exist showing MACC1 upregulation at the protein level. Such immunohistochemical data are available for colon cancer,3 lung adenocarcinoma,13 and in the current study for human malignant astrocytoma. Our immunohistochemical analysis of 24 LGAs and 14 GBM specimens, which were samples independent of the cohort analyzed by PCR, not only confirmed the mRNA expression data, but at a closer look also allowed a distinction between different stages of glioma development. MACC1 was found in only a few (4.29%) tumor cells of LGA remaining dormant, whereas 20.58% of tumor cells were positive in LGA developing recurrence. There was no significant difference in MACC1 expression between the initial LGA and the recurrence of the same WHO grade, but we saw an increase of MACC1-expressing cells in secondary GBM compared with their matched low-grade predecessors. In secondary GBM, 2.6 times more tumor cells stained positive for MACC1 than in primary GBM. This is in line with observations in colon cancer where MACC1 was expressed more highly in malignant tissues than in normal tissues or adenomas.3 However, MACC1 expression values were comparable in corresponding samples of the metastasized primary tumor and metastasis in colon cancer.3 These data defined MACC1 as an independent prognostic marker for colon cancer metastasis.3 Recently, it has been shown that MACC1 also may predict postoperative recurrence of lung adenocarcinoma.14,29 Consistently, MACC1 might represent a promising new independent progression marker for human astrocytic tumors as well. Indeed, we found that a high number of MACC1-expressing cells in GBM are of disadvantage for the prognosis of the patient. Median survival was reduced to 8 months in this group compared with 16 months for patients with only a few MACC1-positive GBM tumor cells.
Looking at single cells within the glioma, we found positive staining of some neurons, but normal astrocytes remained negative for MACC1. However, individual tumor cells were clearly stained in increasing number and intensity with increasing WHO grade. Whereas in LGA and primary GBM MACC1 was found exclusively in the cytoplasm, secondary GBM showed additional nuclear staining. Such a switch from cytoplasmic to nuclear staining was associated with metastasis in colon cancer cells4 and may indicate the higher malignancy of the glioma cells. MACC1 translocation from the cytoplasm to the nucleus could be induced by HGF treatment in SW480/MACC1 colon cancer cells, but not by other growth factors. MACC1 expression promoted c-Met expression in these cells3 by direct binding of MACC1 to the Sp1 site of the c-Met promoter29 and regulates migration and proliferation.3 MACC1 has been established as a main regulator of HGF/c-Met signaling.9,30 It is well known that HGF/c-Met regulates proliferation and migration of glioma cells.25–28 Indeed, we found that overexpression of MACC1 in U138 cells enhanced c-Met mRNA expression. We also detected increased c-Met expression in the same tumor samples shown to overexpress MACC1. Expression of c-Met correlates with the grade of malignancy in human astrocytic tumors,27 and intratumoral concentrations of HGF are associated with poor prognosis of malignant gliomas.55 Therefore, inhibitors against HGF/c-Met signaling have been developed. Here we show that incubation of U138/MACC1 cells with the c-Met inhibitor crizotinib40,41 reduced MACC1-induced migration and invasion back to basal level in real-time measurements of cell cultures and in OHSCs of mice. In human U87 GBM tumor cells and xenografts, targeting the c-Met pathway by U1/ribozymes improved the response to γ-radiation.56 However, in a phase II study to evaluate efficacy and safety of AMG 102 (rilotumumab), a human monoclonal antibody directed against HGF in patients with recurrent GBM, there was no objective response per central assessment and no significant antitumor activity.57 Therefore, MACC1 may be a more promising target not only for the treatment of LGA and GBM (with small molecules to impede or at least slow down the progression of LGA and to prolong survival of patients with GBM), but also for the treatment of other malignancies.9
The initial description of MACC1 concludes with the prediction that MACC1 may prove to have a broad clinical utility also in other tumor entities.3 Recently emerging publications on a multitude of tumor types and our own data correlating MACC1 expression with progression and unfavorable prognosis of patients' with malignant glioma show that this prediction now comes true.
Conflict of interest statement. None declared.
Funding
None declared.
Acknowledgments
We are very grateful to Wolfgang Roggendorf (University of Würzburg, Institute of Pathology, Department of Neuropathology, Würzburg, Germany) for his expertise. We also thank Stefanie Gerngras and Siglinde Kühnel (University of Würzburg, Department of Neurosurgery, Würzburg, Germany) for technical assistance.
References
- 1.Talmadge JE, Fidler IJ. AACR centennial series: the biology of cancer metastasis: historical perspective. Cancer Res. 2010;70:5649–5669. doi: 10.1158/0008-5472.CAN-10-1040. [DOI] [PMC free article] [PubMed] [Google Scholar]
- 2.Hannahan D, Weinberg RA. Hallmarks of cancer: the next generation. Cell. 2011;144:646–674. doi: 10.1016/j.cell.2011.02.013. [DOI] [PubMed] [Google Scholar]
- 3.Stein U, Walther W, Arlt F, et al. MACC1, a newly identified key regulator of HGF-MET signaling, predicts colon cancer metastasis. Nat Med. 2009;15:59–67. doi: 10.1038/nm.1889. [DOI] [PubMed] [Google Scholar]
- 4.Arlt F, Stein U. Colon cancer metastasis: MACC1 and Met as metastatic pacemakers. Int J Biochem Cell Biol. 2009;41:2356–2359. doi: 10.1016/j.biocel.2009.08.001. [DOI] [PubMed] [Google Scholar]
- 5.Pichorner A, Sack U, Kobelt D, et al. In vivo imaging of colorectal cancer growth and metastasis by targeting MACC1 with shRNA in xenografted mice. Clin Exp Metastasis. 2012;29:573–583. doi: 10.1007/s10585-012-9472-6. [DOI] [PubMed] [Google Scholar]
- 6.Kokoszynska K, Krynski J, Rychlewski L, Wyrwicz LS. Unexpected domain composition of MACC1 links MET signaling and apoptosis. Acta Biochim Pol. 2009;56:317–323. [PubMed] [Google Scholar]
- 7.Stein U, Dahlmann M, Walther W. MACC1—more than metastasis? Facts and predictions about a novel gene. J Mol Med. 2010;88:11–18. doi: 10.1007/s00109-009-0537-1. [DOI] [PubMed] [Google Scholar]
- 8.Stein U. MACC1—a novel target for solid cancers. Expert Opin Ther Targets. 2013;17:1039–1052. doi: 10.1517/14728222.2013.815727. [DOI] [PubMed] [Google Scholar]
- 9.Galimi F, Torti D, Sassi F, et al. Genetic expression analysis of MET, MACC1, and HGF in metastatic colorectal cancer: response to Met inhibition in patient xenografts and pathologic correlations. Clin Cancer Res. 2011;17:3146–3156. doi: 10.1158/1078-0432.CCR-10-3377. [DOI] [PubMed] [Google Scholar]
- 10.Kawamura M, Saigusa S, Toijama Y, et al. Correlation of MACC1 and Met expression in rectal cancer after neoadjuvant chemoradiotherapy. Anticancer Res. 2012;32:1527–1531. [PubMed] [Google Scholar]
- 11.Shirahata A, Shinmura K, Kitamura Y, et al. MACC1 as a marker for advanced colorectal carcinoma. Anticancer Res. 2010;30:2689–2692. [PubMed] [Google Scholar]
- 12.Shirahata A, Sakata M, Kitamura Y, et al. MACC1 as a marker for peritoneal-disseminated gastric carcinoma. Anticancer Res. 2010;30:3441–3444. [PubMed] [Google Scholar]
- 13.Chundong G, Uramoto H, Onitsuka T, et al. Molecular diagnosis of MACC1 status in lung adenocarcinoma by immunohistochemical analysis. Anticancer Res. 2011;31:1141–1145. [PubMed] [Google Scholar]
- 14.Shimokawa H, Uramoto H, Onitsuka T, et al. Overexpression of MACC1 mRNA in lung adenocarcinoma is associated with postoperative recurrence. J Thor Card Surg. 2011;141:895–898. doi: 10.1016/j.jtcvs.2010.09.044. [DOI] [PubMed] [Google Scholar]
- 15.Qiu J, Huang P, Liu Q, et al. Identification of MACC1 as a novel prognostic marker in hepatocellular carcinoma. J Transl Med. 2011;9:166. doi: 10.1186/1479-5876-9-166. [DOI] [PMC free article] [PubMed] [Google Scholar]
- 16.Shirahata A, Fan W, Sakuraba K, et al. MACC1 as a marker for vascular invasive hepatocellular carcinoma. Anticancer Res. 2011;31:777–780. [PubMed] [Google Scholar]
- 17.Reifenberger G, Collins VP. Pathology and molecular genetics of astrocytic gliomas. J Mol Med. 2004;82:656–670. doi: 10.1007/s00109-004-0564-x. [DOI] [PubMed] [Google Scholar]
- 18.Cavenee WK, Furnari FB, Nagane M, et al. Diffusely infiltrating astrocytomas. In: Kleihues P, Cavenee WK, editors. Pathology and Genetics of Tumors of the Nervous System. WHO Classification of Tumors. Lyon: IARC; 2000. pp. 10–21. [Google Scholar]
- 19.Maher EA, Brennan C, Wen PY, et al. Marked genomic differences characterize primary and secondary glioblastoma subtypes and identify two distinct molecular and clinical secondary glioblastoma entities. Cancer Res. 2006;66:11502–11513. doi: 10.1158/0008-5472.CAN-06-2072. [DOI] [PubMed] [Google Scholar]
- 20.Ohgaki H, Kleihues P. Genetic pathways to primary and secondary glioblastoma. Am J Pathol. 2007;170:1445–1453. doi: 10.2353/ajpath.2007.070011. [DOI] [PMC free article] [PubMed] [Google Scholar]
- 21.Ohgaki H, Kleihues P. The definition of primary and secondary glioblastoma. Clin Cancer Res. 2013;19:764–772. doi: 10.1158/1078-0432.CCR-12-3002. [DOI] [PubMed] [Google Scholar]
- 22.Stupp R, Hegi ME, Mason WP, et al. Effects of radiotherapy with concomitant and adjuvant temozolomide versus radiotherapy alone on survival in glioblastoma in a randomised phase III study: 5-year analysis of the EORTC-NCIC trial. Lancet Oncol. 2009;10:459–466. doi: 10.1016/S1470-2045(09)70025-7. [DOI] [PubMed] [Google Scholar]
- 23.Stupp R, Mason WP, van den Bent MJ, et al. Radiotherapy plus concomitant and adjuvant temozolomide for glioblastoma. N Engl J Med. 2005;352:987–996. doi: 10.1056/NEJMoa043330. [DOI] [PubMed] [Google Scholar]
- 24.Moriyama T, Kataoka H, Koono M, Wakisaka S. Expression of hepatocyte growth factor/scatter factor and its receptor c-Met in brain tumors: evidence for a role in progression of astrocytic tumors. Int J Mol Med. 1999;3:531–536. doi: 10.3892/ijmm.3.5.531. [DOI] [PubMed] [Google Scholar]
- 25.Laterra J, Rosen E, Nam M, Ranganathan S, Fielding K, Johnston P. Scatter factor/hepatocyte growth factor expression enhances human glioblastoma tumorigenicity and growth. Biochim Biophys Res Commun. 1997;235:743–747. doi: 10.1006/bbrc.1997.6853. [DOI] [PubMed] [Google Scholar]
- 26.Moriyama T, Kataoka H, Seguchi K, Tsubouchi H, Koono M. Effects of hepatocyte growth factor (HGF) on human glioma cells in vitro: HGF acts as a motility factor in glioma cells. Int J Cancer. 1996;66:678–685. doi: 10.1002/(SICI)1097-0215(19960529)66:5<678::AID-IJC16>3.0.CO;2-0. [DOI] [PubMed] [Google Scholar]
- 27.Nabeshima K, Shimao Y, Sato S, et al. Expression of c-Met correlates with grade of malignancy in human astrocytic tumours: an immunohistochemical study. Histopathology. 1997;31:436–443. doi: 10.1046/j.1365-2559.1997.3010889.x. [DOI] [PubMed] [Google Scholar]
- 28.Yamamoto S, Wakimoto H, Aoyagi M, Hirakawa K, Hamada H. Modulation of motility and proliferation of glioma cells by hepatocyte growth factor. Jpn J Cancer Res. 1997;88:564–577. doi: 10.1111/j.1349-7006.1997.tb00420.x. [DOI] [PMC free article] [PubMed] [Google Scholar]
- 29.Stein U, Smith J, Walther W, Arlt F. MACC1 controls Met. What a difference an Sp1 site makes. Cell Cycle. 2009;8:2467–2469. doi: 10.4161/cc.8.15.9018. [DOI] [PubMed] [Google Scholar]
- 30.Boardman LA. Overexpression of MACCI leads to downstream activation of HGF/MET and potentiates metastasis and recurrence of colorectal cancer. Gen Med. 2009;1:36. doi: 10.1186/gm36. [DOI] [PMC free article] [PubMed] [Google Scholar]
- 31.Kleihues P, Louis DN, Scheithauer BW, et al. The WHO classification of tumors of the nervous system. J Neuropathol Exp Neurol. 2002;61:215–225. doi: 10.1093/jnen/61.3.215. [DOI] [PubMed] [Google Scholar]
- 32.Louis DN, Ohgaki H, Wiestler OD, et al. The 2007 WHO classification of tumours of the central nervous system. Acta Neuropathol. 2007;114:97–109. doi: 10.1007/s00401-007-0243-4. [DOI] [PMC free article] [PubMed] [Google Scholar]
- 33.Hagemann C, Meyer C, Stojic J, et al. High efficiency transfection of glioma cell lines and primary cells for overexpression and RNAi experiments. J Neurosci Methods. 2006;156:194–202. doi: 10.1016/j.jneumeth.2006.03.003. [DOI] [PubMed] [Google Scholar]
- 34.Stojic J, Hagemann C, Haas S, et al. Expression of matrix metalloproteinases MMP-1, MMP-11 and MMP-19 is correlated with the WHO-grading of human malignant gliomas. Neurosci Res. 2008;60:40–49. doi: 10.1016/j.neures.2007.09.009. [DOI] [PubMed] [Google Scholar]
- 35.Said HM, Hagemann C, Stojic J, et al. GAPDH is not regulated in human glioblastoma under hypoxic conditions. BMC Mol Biol. 2007;8:55. doi: 10.1186/1471-2199-8-55. [DOI] [PMC free article] [PubMed] [Google Scholar]
- 36.Hagemann C, Anacker J, Gerngras S, et al. Expression analysis of the autosomal recessive primary microcephaly genes MCPH1 (microcephalin) and MCPH5 (ASPM, abnormal spindle like, microcephaly associated) in human malignant gliomas. Oncol Rep. 2008;20:301–308. [PubMed] [Google Scholar]
- 37.Abramoff MD, Magalhaes PJ, Ram SJ. Image processing with ImageJ. Biophotonics International. 2004;11:36–42. [Google Scholar]
- 38.Ebrahimi F, Koch M, Pieroh P, et al. Time dependent neuroprotection of mycophenolate mofetil: effects on temporal dynamics in glial proliferation, apoptosis, and scar formation. J Neuroinflammation. 2012;9:89. doi: 10.1186/1742-2094-9-89. [DOI] [PMC free article] [PubMed] [Google Scholar]
- 39.Thévenaz P, Delgado-Gonzalo R, Unser M. The ovuscule. IEEE Trans Pattern Anal Mach Intell. 2011;33:382–393. doi: 10.1109/TPAMI.2010.112. [DOI] [PubMed] [Google Scholar]
- 40.Zhang Y, Farenholtz KE, Yang Y, et al. Hepatocyte growth factor sensitizes brain tumors to c-Met kinase inhibition. Clin Cancer Res. 2013;19:1433–1444. doi: 10.1158/1078-0432.CCR-12-2832. [DOI] [PMC free article] [PubMed] [Google Scholar]
- 41.Rath P, Lal B, Ajala O, et al. In vivo c-Met pathway inhibition depletes human glioma xenografts of tumor-propagating stem-like cells. Transl Oncol. 2013;6:104–111. doi: 10.1593/tlo.13127. [DOI] [PMC free article] [PubMed] [Google Scholar]
- 42.Fu J, Wang YK, Yang MT, et al. Mechanical regulation of cell function with geometrically modulated elastomeric substrates. Nat Methods. 2010;7:733–736. doi: 10.1038/nmeth.1487. [DOI] [PMC free article] [PubMed] [Google Scholar]
- 43.Barnhart EL, Lee KC, Keren K, et al. An adhesion-dependent switch between mechanisms that determine motile cell shape. PloS Biol. 2011;9:e1001059. doi: 10.1371/journal.pbio.1001059. [DOI] [PMC free article] [PubMed] [Google Scholar]
- 44.Harada T, Baril P, Gangeswaran R, et al. Identification of genetic alterations in pancreatic cancer by the combined use of tissue microdissection and array-based comparative genomic hybridization. Br J Cancer. 2007;96:373–382. doi: 10.1038/sj.bjc.6603563. [DOI] [PMC free article] [PubMed] [Google Scholar]
- 45.Morohara K, Tajima Y, Nakao K, et al. Gastric and intestinal phenotypic cell marker expressions in gastric differentiated-type carcinomas: association with E-cadherin expression and chromosomal changes. J Cancer Res Clin Oncol. 2006;132:363–375. doi: 10.1007/s00432-005-0062-8. [DOI] [PMC free article] [PubMed] [Google Scholar]
- 46.Tsiambas E, Manaios L, Papanikolopoulos C, et al. Chromogenic in situ hybridization analysis of epidermal growth factor receptor gene/chromosome 7 numerical aberrations in hepatocellular carcinoma based on tissue microarrays. Pathol Oncol Res. 2009;15:511–520. doi: 10.1007/s12253-008-9146-5. [DOI] [PubMed] [Google Scholar]
- 47.Ubagi T, Matsuura S, Tauchi H, Itou K, Komatsu K. Comparative genomic hybridization analysis suggests a gain of chromosome 7p associated with lymph node metastasis in non-small cell lung cancer. Oncol Rep. 2001;8:83–88. doi: 10.3892/or.8.1.83. [DOI] [PubMed] [Google Scholar]
- 48.Zimmermann U, Feneux D, Mathey G, Gayral F, Bedossa P. Chromosomal aberrations in hepatocellular carcinomas: relationship with pathological features. Hepatology. 1997;26:1492–1498. doi: 10.1053/jhep.1997.v26.pm0009397989. [DOI] [PubMed] [Google Scholar]
- 49.Zojer N, Dekan G, Ackermann J, et al. Aneuploidy of chromosome 7 can be detected in invasive lung cancer and associated premalignant lesions of the lung by fluorescence in situ hybridization. Lung Cancer. 2000;28:225–235. doi: 10.1016/s0169-5002(00)00097-0. [DOI] [PubMed] [Google Scholar]
- 50.Loeper S, Romeike BFM, Heckmann N, et al. Frequent mitotic errors in tumor cells of genetically micro-heterogeneous glioblastomas. Cytogenet Cell Genet. 2001;94:1–8. doi: 10.1159/000048773. [DOI] [PubMed] [Google Scholar]
- 51.Rossi MR, La Duca J, Matsui S-I, Nowak NJ, Hawthorn L, Cowell JK. Novel amplicons on the short arm of chromosome 7 identified using high resolution array CGH contain over expressed genes in addition to EGFR in glioblastoma multiforme. Genes Chromosomes Cancer. 2005;44:392–404. doi: 10.1002/gcc.20256. [DOI] [PubMed] [Google Scholar]
- 52.Shapiro JR. Genetic alterations associated with adult diffuse astrocytic tumors. Am J Med Genet. 2002;115:194–201. doi: 10.1002/ajmg.10690. [DOI] [PubMed] [Google Scholar]
- 53.Arslantas A, Artan S, Öner Ü, et al. Genomic alterations in low-grade, anaplastic astrocytomas and glioblastomas. Path Oncol Res. 2007;13:39–46. doi: 10.1007/BF02893439. [DOI] [PubMed] [Google Scholar]
- 54.Cerami E, Gao J, Dogrusoz U, et al. The cBio cancer genomics portal: an open platform for exploring multidimensional cancer genomics data. Cancer Discov. 2012;2:401–404. doi: 10.1158/2159-8290.CD-12-0095. [DOI] [PMC free article] [PubMed] [Google Scholar]
- 55.Arrieta O, Garcia E, Guevara P, et al. Hepatocyte growth factor is associated with poor prognosis of malignant gliomas and is a predictor for recurrence of meningioma. Cancer. 2002;94:3210–3218. doi: 10.1002/cncr.10594. [DOI] [PubMed] [Google Scholar]
- 56.Lal B, Xia S, Abounader R, Laterra J. Targeting the c-Met pathway potentiates glioblastoma responses to γ-radiation. Clin Cancer Res. 2005;11:4479–4486. doi: 10.1158/1078-0432.CCR-05-0166. [DOI] [PubMed] [Google Scholar]
- 57.Wen PY, Schiff D, Cloughesy TF, et al. A phase II study evaluating the efficacy and safety of AMG 102 (rilotumumab) in patients with recurrent glioblastoma. Neuro-Oncol. 2011;13:437–446. doi: 10.1093/neuonc/noq198. [DOI] [PMC free article] [PubMed] [Google Scholar]