Abstract
It is difficult to mix two liquids on a microfluidic chip because the small dimensions and velocities effectively prevent the turbulence. This paper describes two 2-layer PDMS passive micromixers based on the concept of splitting and recombining the flow that exploits a self-rotated contact surface to increase the concentration gradients to obtain fast and efficient mixing. The designed micromixers were simulated and the mixing performance was assessed. The mixers have shown excellent mixing efficiency over a wide range of Reynolds number. The mixers were reasonably fabricated by multilayer soft lithography, and the experimental measurements were performed to qualify the mixing performance of the realized mixer. The results show that the mixing efficiency for one realized mixer is from 91.8% to 87.7% when the Reynolds number increases from 0.3 to 60, while the corresponding value for another mixer is from 89.4% to 72.9%. It is rather interesting that the main mechanism for the rapid mixing is from diffusion to chaotic advection when the flow rate increases, but the mixing efficiency has not obvious decline. The smart geometry of the mixers with total length of 10.25 mm makes it possible to be integrated with many microfluidic devices for various applications in μ-TAS and Lab-on-a-chip systems.
INTRODUCTION
The past decade has seen the rapid development of micromixers in microfluidic systems. It is becoming increasingly difficult to ignore the importance of the micromixers for their wide applications.1 Mixing is necessary in various microfluidic applications for chemical reactions,2 enzyme reactions,3 biological analysis,4, 5 and drug delivery.6 Central to these micromixers is to sufficiently mix dissimilar fluids, especially for bio-macromolecular solutions.7 Mixing small volumes of fluids in microfluidic system at low Reynolds number is difficult due to the laminar flows which rely mainly on molecular diffusion. Therefore, a method to increase the contact surface between different fluids, shorten the diffusion length or introduce chaotic advection is urgent to achieve the rapid mixing in microsystems.
In general, micromixers can be divided into two categories: passive micromixers and active micromixers. Passive micromixers1, 8, 9, 10, 11, 12 do not require external energy but only depend on the structure of the channel, and the mixing mechanism relies entirely on molecular diffusion or chaotic advection. For achieving a high mixing efficiency, active micromixers usually utilize the disturbance induced by an external field, such as the electric field,13, 14, 15, 16 the acoustic field,17, 18, 19, 20 and the magnetic field,21, 22 etc. However, it is often difficult to fabricate active micromixers for their integration with complicated components that trigger external fields. Moreover, the external fields usually generate temperature rise, which may damage the biological samples.
In the last decade, for better mixing efficiency, many researchers have made great effort to develop various types of passive micromixers composed of 2-D curved channel with radial baffles,23 2-D cylindrical grooves adjoining to the main straight channel24 and 2-D structures based on the concept of the splitting and recombination.25, 26, 27, 28 These micromixers did exhibit high performance at high flow rates, but at a low level the channel geometries cannot result in obvious vortices or chaotic advection and the contact surface between the streams are usually vertical without rotation and expansion, so these micromixers are not effective at lower Reynolds number unless these micromixers have a longer mixing length.
Different three-dimensional (3-D) structures have been also devised for improving mixing performance. Some of the structures were machined on PMMA plates using laser ablation method29 or CNC micro-milling method30, 31 and then bonded by thermal techniques. These realized layer-by-layer micromixers with reasonable structures have exhibited high mixing efficiency. However, the mixing length could be relatively long and the process of the fabrication would be complicated. Another method to construct pattern of the microchannel is to utilize conventional photolithography process. Examples contain micromixers fabricated with two9 or three PDMS layers32 or by inserting microstructures33 in the channel. Although some of the micromixers can be short enough and effective at low Reynolds number (Re) or Peclet number (Pe), the mixing efficiency would apparently decline as Re increases.32, 34
In the present work, we propose two effective and cheap 3-D micromixers based on the principle of splitting and recombination (SAR). The micromixers were simulated and the mixing performance for these two models was evaluated and compared by employing a straight microchannel. Meanwhile, the contours of the concentration gradient at different cross sections are used to imply the diffusing trend of the solute and that can represent where the diffusion occurs. The results of the simulation have exhibited their significant efficiencies at different Reynolds numbers. Then, the two-layer and 3-D PDMS structures are fabricated through multilayer soft lithography. The total length of the realized micromixers is 10.25 mm. Finally, the mixing experiments were accomplished to evaluate the performance quantitatively in the real conditions. The experimental results show a good mixing performance over a wide Re range.
THE 3-D MICROMIXER DESIGN, FABRICATION, AND EXPERIMENTAL DETAILS
Chip design
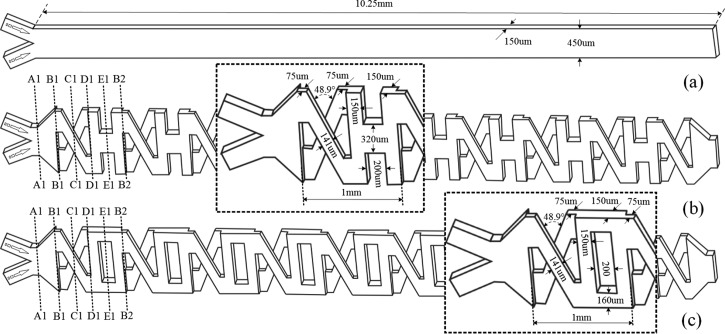
For improving the mixing efficiency, two passive micromixers based on the concept of splitting and recombination are proposed. Two models of the micromixers, named model XO and XH, are fabricated in this work. As shown in Fig. 1a, a Y-type mixer with a straight channel is used for comparison. Figs. 1b, 1c provide the configurations of model XH and XO, respectively. Two local parts with detail dimensions of the microstructure are magnified in two dashed regions. In model XH, two streams from the inlets meet at cross section A1. And at section B1, the fluid is split into two streams: one is directed along the top branch; another along the underlying branch. Then, these two streams guided by the diagonal channels go across at section C1 where the fluids are folded together horizontally and split into two fluids vertically. At section D1, two fluids treated by the three-dimensional X structure from section B1 to D1 flow into the three-dimensional H structure from section D1 to B2. After that, the streams are reunited at section E1. And then, the fluid is dispensed into two parts at section B2 similar to that at section B1. As can be obviously seen from the structure of model XH, the first cycle with the length of 1 mm, i.e., the first mixing unit is from section B1 to B2, and the model XH consists of nine and a half mixing units. Model XO has similar structures but the three-dimensional O structure. In other words, at section D1 of model XO, two fluids treated by the three-dimensional X structure flow into the three-dimensional O structure instead. In our mixers, the channel depth in different layers is 75 μm, and the channel length is 10.25 mm. Other parameters are shown in Fig. 1. More importantly, both “H” and “O” are transitional structures between two neighboring structures “X”. The key differences between XH model and XO model are that the structure “H” can recombine fluids horizontally and the structure “O” like an obstacle directs these two fluids with less contact and then flow directly into the X structure. We noticed that the X structure in both XH and XO models was ever used by Xia,29 and also other researchers.35, 36, 37 However, our detailed models and motivations are different, because the transitional structures between two “X” structures and meanwhile the same repeated “X”s are used, while the neighboring structures “X” are opposite in Xia's work.29 In this way, the contact surface can be rotated continuously in one direction (detailed description in Sec. 3).
Figure 1.
Structure of the micromixers and parameters involved. (a) Straight channel for comparison. (b) Model XH. (c)Model XO.
Fabrication of the device
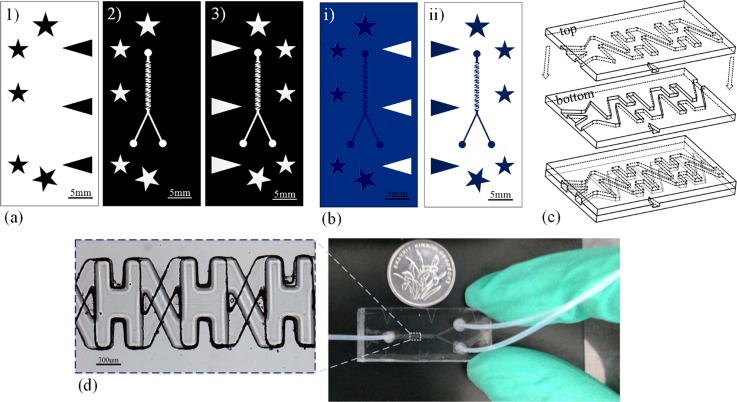
We make polydimethylsiloxane (PDMS) devices using replica molding with negative photo resist(Ordy1 SY355, Elga Europe, Italy) as the mold master.38, 39 Since it is topologically impossible to make three-dimensional structure using a single-layer PDMS, we first make two complementary masters, one for the top part of the non-planar junction and another for the bottom part with planar structure. To point that, only the top master consists of two layers, as shown in Fig. 2b. The multilayered masters are fabricated by two-step UV exposure process, applying a second photo-resist layer between the two exposures and aligning the second exposure through manually matching the five pentagrams on the masks (2) and the corresponding pattern replicated from the mask (1) on the first exposed photo-resist layer. After replicating the top and bottom molds with PDMS, the two PDMS replicas as showed in Fig. 2c were aligned using a ‘‘concave and convex'' method40, 41, 42 through matching three pairs of concave-convex triangles face to face on both sides. After treating both sides with oxygen plasma, we apply a drop of distilled water for lubrication, match the two parts and bake dry at 60 °C for 3 h to bond.
Figure 2.
Fabrication of the two-layer device. (a) Three masks used for making the masters. (b) Two photolithographic masters that are used for replicating PDMS molds. The master (i) has two layers: The base of the master is white, the first layer is blue and the second layer is dark blue. The master (ii) has only the dark blue layer. (c) Two PDMS molds, the top one with three convex triangles replicated from the master (i) in (b) and the bottom one with three concave triangles replicated from the master (ii) in (b) are bonded face to face, with three pairs of concave-convex triangles on both sides matching to align the molds and make the final device. (d) The fabricated device of model XH.
Experimental details
It is common to evaluate mixing effect by observing the changes of color or intensity of various indicators. It is well known that phenolphthalein changes its color from colorless to red when solution pH is greater than 8. We explored this phenomenon to evaluate the mixing efficiency of our designed structures. Two different colorless fluids, i.e., aqueous alkali composed of 2.4 g sodium hydroxide (solute A), 30 g water and 30 g glycerol and indicator containing 1.5 g phenolphthalein (solute B), 30 g ethyl alcohol and 30 g glycerol, were injected into the main channel from two inlets with same flow rates using a syringe pumps (LSP04-1A, China). After the streams meet, both the solutes will diffuse in the channel. Because the reaction between phenolphthalein and sodium hydroxide is very fast, we can neglect the time of the reaction. The color changes across the main channel were captured using a microscope (BX53, Olympus) equipped with a digital camera (Retiga-2000R). The color intensity from the captured images was analyzed using Image J (Version 1.44p, USA). For the dimension of the length and width are rather bigger than the height in our models and realized mixers, the 2-D top view of concentration distribution was approximately used to represent the 3-D concentration distribution, referred to some other similar work.9, 10, 31, 34, 43
SIMULATION MODELS
Numerical setups
Numerical simulation was carried out to quantify the mixing performance of the micromixers by commercial software COMSOL multiphysics (COMSOL 4.3, Sweden). The flow profile was investigated using the 3-D models depicted in Fig. 1. Attention should be paid to two key parameters, i.e., the Reynolds number (Re), and the Peclet number (Pe). The Reynolds number Re = UL/v represents the ratio between momentum and viscous friction, where U is the mean velocity of the flow, L is the hydraulic diameter and v is the kinetic viscosity of the fluid. The Peclet number Pe = UL/D indicates the ratio between the mass transport due to convection and that of diffusion, where D is the diffusion coefficient of the fluid. Convection is dominated at higher Peclet numbers. In the numerical simulation models, the type of the fluid is incompressible newton fluid, governed by the Navier-Stokes equation.15 The component of the fluid is water with the kinetic viscosity v = 1×10⁻⁶ m2/s at room temperature. The hydraulic diameter L is 225 μm for all the three models. The inlet velocity of the flow ranges from 0.15 mm/s to 5 mm/s and the corresponding Re is from 0.03 to 11.25. The transport of diluted species dominated by the convective-diffusion equation24 coupling with the flow field is also simulated. The concentrations of two different fluids to be mixed are set as C = 0 mol/m3 and C = 1 mol/m3 at inlet 1 and inlet 2, respectively, while the diffusion coefficient of the solute in water is D = 1×10⁻¹¹ m2/s. As a result, the Pe number varies from 0.034 × 10³ to 1.13 × 10⁴ according to the velocity of the flow.
To comprehend the mixing in these models, mere study of distribution of the concentration is far from over. According to Fick's second law ∂C/∂t = D∇2C, concentration gradient can be used to describe the diffusing trend of the solute and the distribution of the concentration gradient contour can represent where the diffusion happens. Therefore, it is easy to understand that the more homogeneous and the more sufficient the distribution of the concentration gradient contours are on the transverse section, the easier it is to shorten the diffusion path and thus the more conducive to mix the two fluids with different concentration of solute.
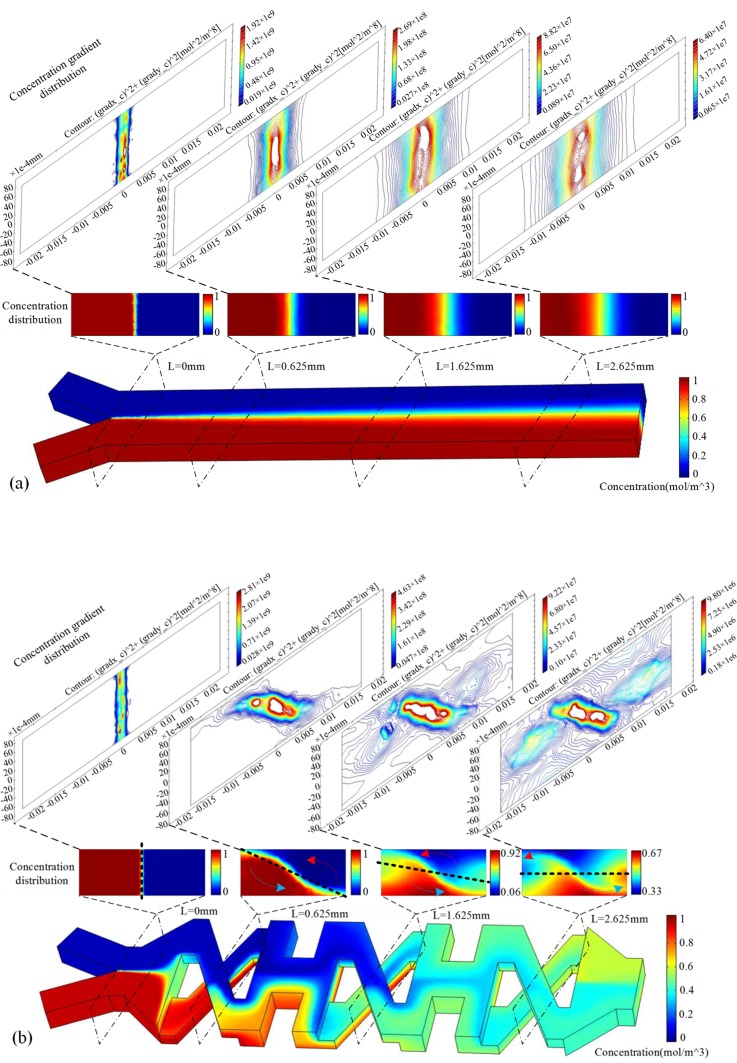
Fig. 3 compares the mixing performance in the first two and half units of model XH and the straight mixer with the convection-diffusion model at Re = 0.56. Fig. 3a implies that the straight mixer only exhibits slight mixing as expected. The concentration gradient contours distribute vertically in the middle of the transverse section. And as the mixing length increases, these contours move parallelly to both sides. The contours show that little chaotic advection happens, and then the diffusion path is really long along the transverse direction. The mixing result of the straight channel is not good. The mixing results of model XH in Fig. 3b show the process of the disarrangement of the concentration gradient contours. It can be obviously seen that the contours rotate counterclockwise at the section C1, C2, C3, etc. The “saddle-shaped” flow pattern also appeared in other micromixers,29, 35, 37 which can efficiently rotate the contact surface, because two streams from the upper layer and the downside extrude each other strongly. And then they are stretched along the transverse direction. As a result, the contours are going to be full of the whole transverse section, when the mixing length increases. The contours become in chaos so that complete advection will probably occurs, and then the contact surface will be enlarged and the diffusion path will be shorten along the transverse direction. What' more, in our design compared with Xia's work,29 the neighboring structures “X” were devised to be the same in order to rotate the contact surface continuously in one direction as Fig. 3b shows. And in Xia's work, the motion of the contact surface showed a different way from ours. The continuous transverse rotation of the two fluids in the rectangular channel contributes to chaos and convection.
Figure 3.
Comparison of mixing results between model XH and the straight mixer without structure on the wall. L indicates the mixer length. (a) Mixing of the straight mixer and the distribution of concentration and concentration gradient from L = 0 mm to L = 2.625 mm at Re = 0.563; (b) mixing of the first two and a half cycles of model XH and the distribution of concentration and concentration gradient at Re = 0.563, the sampled planes are A1, C1, C2, etc., as depicted in Fig. 1b.
Simulation results
The performance of the mixing at sampled sections is evaluated by calculating the following equation:26, 37, 44
| (1) |
where , in which Ci (from 0 to 1) is the value of the concentration at grid i (i = 0…n), C∞ is the concentration value resulted from perfect mixing. σmax is the maximum standard deviation (no mixing at the inlet). The value of σs ranges from 0 for no mixing or diffusion to 1 for perfect mixing.
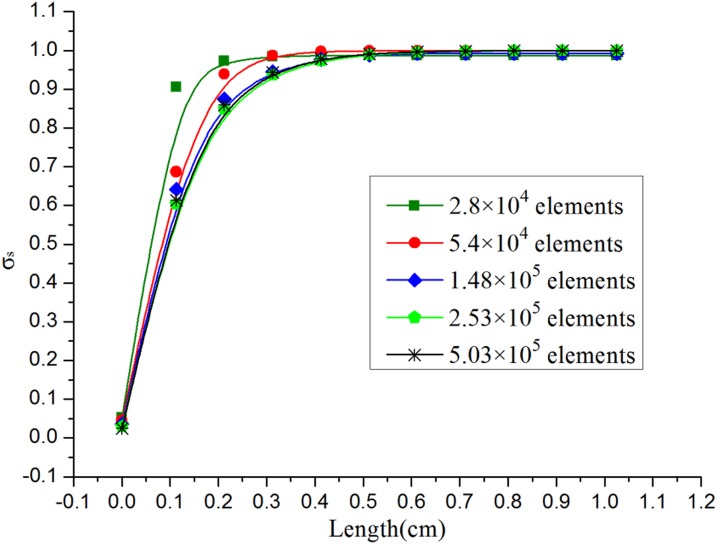
Before performing the simulation, mesh independency tests27, 44 for these three models are made to determine the suitable number of elements. Take the XH model, for example; five different structured tetrahedral grid systems with an element number ranging from 2.8 × 10⁴ to 5.03 × 10⁵ were tested, as shown in Fig. 4. The mixing efficiency is calculated under different element numbers. Obviously, beyond the element number of 1.48 × 10⁵, the influence of increasing the element number on the mixing efficiency was negligible. In order to keep the simulation precision and save the CPU time, a grid system with 2.53 × 10⁵ elements was selected as the suitable grid system for further calculations. Similar mesh independence tests on the straight channel and XO model were also conducted to identify the suitable grid system and the corresponding suitable elements are 2.09 × 10⁵ and 2.49 × 10⁵, respectively.
Figure 4.
Mesh independency test of the model XH at Re = 60
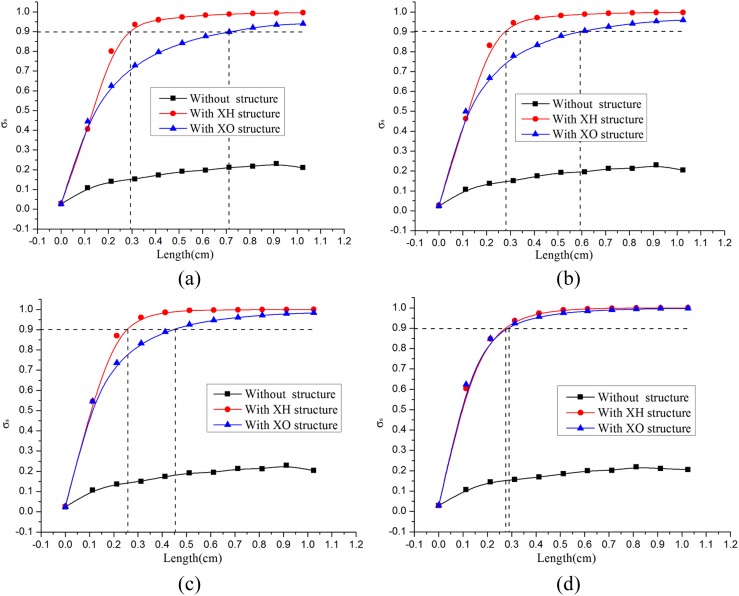
Fig. 5 compares the mixing efficiencies of the three mixers at different Reynolds numbers. At Re = 0.3, the value σs of the straight mixer increases from 2.7% to 21.0% at a distance 10.25 mm from the inlet. For model XH, it increases from 2.9% to around 90% after 2.9 mm mixing length, while the corresponding length is 7.2 mm for model XO. There are not obvious changes when Re increases to 6. But as Re inclines to 11.25, the 90% mixing length reduces apparently to 4.6 mm. The mixing of these three models at Re = 60 was also simulated. However, as the values of σs reach 90% for model XH and model XO, the mixing lengths decrease by about 0.2 mm and 4.3 mm, respectively, compared with that at Re = 0.3. From these results, the mixer XH consistently keeps a high mixing performance at Reynolds number ranging from 0.3 to 60 while the mixer XO becomes more and more effective as Re increases.
Figure 5.
Compare the mixing results at different Reynolds number of the three mixers in simulation using the Equation 1. (a) At Re = 0.3. (b). At Re = 6. (c) At Re = 11.25. (d) At Re = 60.
RESULTS AND DISCUSSIONS
To quantify the mixing efficiency, the following formula45 is used:
| (2) |
where n, Ii, Imax, and Imin are the total number of pixels, the intensity at pixel i, the intensity at pixel i if no mixing or diffusion, and the intensity of the perfectly mixed solution at pixel i, respectively. The value of σe ranges from 0 for no mixing or diffusion to 100% for perfect mixing. Generally, the value of σe equal to 90% was considered complete mixing.
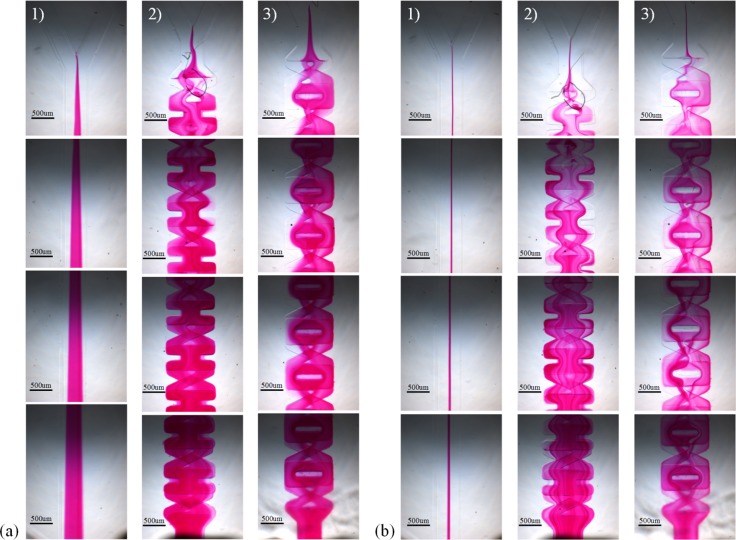
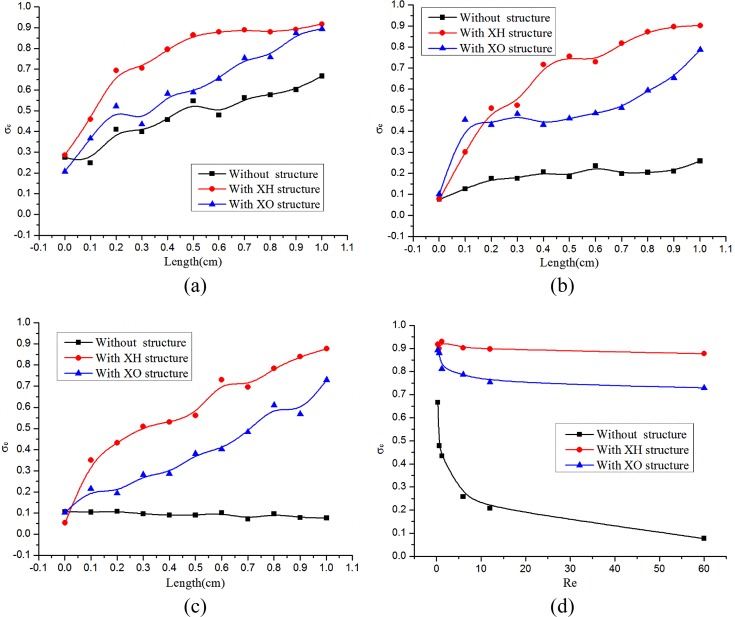
Fig. 6 shows the mixing results of the straight channel, mixer XH and mixer XO at Re = 0.3 and Re = 6, respectively. And Fig. 7 depicts the mixing results at different Reynolds number of these three mixers. As displayed in Fig. 6a, nearly no chaotic advection is produced and the mixing relies mainly on diffusion in the straight channel. Under the same condition, mixer XH and mixer XO can both guarantee the occurrence of chaotic advection. This point can be easily seen from Fig. 7a, the value σe of the straight channel increases from 27.5% to 66.7%, while the corresponding values of mixer XH and mixer XO respectively increase to 91.8% and 89.4%. The experimental mixing efficiency of the straight channel as shown in Fig. 5a is apparently higher than the simulation result as shown in Fig. 7a. The reason to make it happen would be that the diffusion coefficient of the solute in water is relatively low (in order to mainly observe the occurrence of chaotic advection) and the sodium hydroxide and phenolphthalein in fluids used in experiment diffuse faster. However, this result did not have more impact in evaluating the mixing performance of mixer XH or mixer XO. Because when Re increases, the diffusion is not dominated in the mixing of these two fluids. Fig. 6b shows a different case that no chaotic advection happened and the diffusive mixing is very low in the straight channel at Re = 6. Because of the disarrangement of two fluids caused by the structures of model XH and model XO, the contact surface of the fluids experience periodic splitting, extrusion, rotation, and recombination, as a result, many dark red stripes are brought about especially in mixer XH. And Fig. 7b implies that the value σe at the outlet of the straight channel reduced to 25.9%. However, the efficiency σe remains approximately unchanged for mixer XH with the value 90.2% and the efficiency for mixer XO decreases to 78.7%. Therefore, mixer XH exhibits better mixing than mixer XO. The main reason is that the structure “O” resisted the efficient contact between the two fluids coming out from the structure “X”.
Figure 6.
Compare the experimental mixing results of these three mixers at two different Reynolds numbers. The scale bar is 500 μm. (a) The mixing results of the straight mixer, the mixer XH and the mixer XO at Re = 0.3, displayed from the left column to the right, i.e., from column (1) to column 3) in (a). (b) The mixing results of the straight mixer, the mixer XH and the mixer XO at Re = 6 displayed from the left column to the right, i.e., from column (1) to column (3) in (b).
Figure 7.
Compare the mixing results at different Reynolds number of the three mixers in experiment using Eq. 2. (a), (b), and (c) Show the mixing efficiency as a function of the mixing length at Re = 0.3, 6, and 60, respectively. (d) Show the mixing efficiencies at the outlets of these three mixers as a function of Re ranging from 0.3 to 60.
Fig. 7c shows that the value σe at the outlet of the straight channel at Re = 60 remains at around 10% while the efficiency σe declines to 87.7% for mixer XH and the efficiency for mixer XO decreases to 72.9%. Fig. 7d compares the mixing efficiencies at the outlets of these three mixers at Re 0.3, 0.6, 1.2, 6, 12, and 60. As Re increases from 0.3 to 60, the efficiency σe only has a reduction of about 4% for mixer XH and the corresponding values are 16% and 59% for mixer XO and the straight channel, respectively. In this perspective, the mixing effect of mixer XH is the best among them.
CONCLUSIONS
Two 2-layer PDMS passive micromixers based on the concept of splitting and recombining the flow are presented in this paper. Both the mixers composed of two-layer structures exhibited high mixing efficiency at microscopic scales. For the reason that the contact surface of the fluids underwent periodic splitting, extrusion, rotation, and recombination, chaotic advection was introduced and the diffusion path was greatly shortened, the mixing was effectively enhanced especially for mixer XH. More importantly, as the Reynolds number (Re) increased from 0.3 to 60, the mixing efficiency had a reduction of only about 4% for mixer XH and the corresponding reductions are 16% and 59% for mixer XO and the straight channel, respectively. Under these circumstances, that meant the lowest correlation between the mixing efficiency and Re for mixer XH. Because of the perfect performance of mixer XH at Re from 0.3 to 60, it will have many applications in improving fluid mixing in various microfluidic systems for chemical synthesis, biological analysis and drug delivery, etc.
ACKNOWLEDGMENTS
We thank China's Natural Science Foundation under Grant No. 51075087, and the Fundamental Research Funds for the Central Universities under Grant No. HIT. NSRIF. 2014058.
References
- Stroock A. D., Dertinger S. K., Ajdari A., Mezić I., Stone H. A., and Whitesides G. M., Science 295, 647 (2002). 10.1126/science.1066238 [DOI] [PubMed] [Google Scholar]
- Bally F., Serra C. A., Hessel V., and Hadziioannou G., Chem. Eng. Sci. 66, 1449 (2011). 10.1016/j.ces.2010.07.026 [DOI] [Google Scholar]
- Hadd A. G., Raymond D. E., Halliwell J. W., Jacobson S. C., and Ramsey J. M., Anal. Chem. 69, 3407 (1997). 10.1021/ac970192p [DOI] [PubMed] [Google Scholar]
- Li S., Yuan Q., Morshed B. I., Ke C., Wu J., and Jiang H., Biosens. Bioelectron. 41, 649 (2013). 10.1016/j.bios.2012.09.036 [DOI] [PubMed] [Google Scholar]
- Gambin Y., Simonnet C., VanDelinder V., Deniz A., and Groisman A., Lab Chip 10, 598 (2010). 10.1039/b914174j [DOI] [PubMed] [Google Scholar]
- Freitas S., Walz A., Merkle H. P., and Gander B., J. Microencapsul. 20, 67 (2003). 10.3109/02652040309178050 [DOI] [PubMed] [Google Scholar]
- Yager P., Edwards T., Fu E., Helton K., Nelson K., Tam M. R., and Weigl B. H., Nature 442, 412 (2006). 10.1038/nature05064 [DOI] [PubMed] [Google Scholar]
- Long M., Sprague M. A., Grimes A. A., Rich B. D., and Khine M., Appl. Phys. Lett. 94, 133501 (2009). 10.1063/1.3089816 [DOI] [Google Scholar]
- Chen H. and Meiners J.-C., Appl. Phys. Lett. 84, 2193 (2004). 10.1063/1.1686895 [DOI] [Google Scholar]
- Liu R. H., Stremler M. A., Sharp K. V., Olsen M. G., Santiago J. G., Adrian R. J., Aref H., and Beebe D. J., J. Microelectromech. S. 9, 190 (2000). 10.1109/84.846699 [DOI] [Google Scholar]
- Du Y., Zhang Z., Yim C., Lin M., and Cao X., Biomicrofluidics 4, 024105 (2010). 10.1063/1.3427240 [DOI] [PMC free article] [PubMed] [Google Scholar]
- Lam Y., Gan H., Nguyen N., and Lie H., Biomicrofluidics 3, 014106 (2009). 10.1063/1.3108462 [DOI] [PMC free article] [PubMed] [Google Scholar]
- Harnett C. K., Templeton J., Dunphy-Guzman K. A., Senousy Y. M., and Kanouff M. P., Lab Chip 8, 565 (2008). 10.1039/b717416k [DOI] [PubMed] [Google Scholar]
- Bockelmann H., Heuveline V., and Barz D. P., Biomicrofluidics 6, 024123 (2012). 10.1063/1.4722000 [DOI] [PMC free article] [PubMed] [Google Scholar]
- Daghighi Y. and Li D., Anal. Chim. Acta 763, 28 (2013). 10.1016/j.aca.2012.12.010 [DOI] [PubMed] [Google Scholar]
- Lim C. Y., Lam Y. C., and Yang C., Biomicrofluidics 4, 014101 (2010). 10.1063/1.3279790 [DOI] [PMC free article] [PubMed] [Google Scholar]
- Yang Z., Goto H., Matsumoto M., and Maeda R., Electrophoresis 21, 116 (2000). [DOI] [PubMed] [Google Scholar]
- Yang Z., Matsumoto S., Goto H., Matsumoto M., and Maeda R., Sens. Actuators, A 93, 266 (2001). 10.1016/S0924-4247(01)00654-9 [DOI] [Google Scholar]
- Bengtsson M. and Laurell T., Anal. Bioanal. Chem. 378, 1716 (2004). 10.1007/s00216-003-2334-y [DOI] [PubMed] [Google Scholar]
- Yaralioglu G. G., Wygant I. O., Marentis T. C., and Khuri-Yakub B. T., Anal. Chem. 76, 3694 (2004). 10.1021/ac035220k [DOI] [PubMed] [Google Scholar]
- Rida A. and Gijs M., Anal. Chem. 76, 6239 (2004). 10.1021/ac049415j [DOI] [PubMed] [Google Scholar]
- Ryu K. S., Shaikh K., Goluch E., Fan Z., and Liu C., Lab Chip 4, 608 (2004). 10.1039/b403305a [DOI] [PubMed] [Google Scholar]
- Tsai R.-T. and Wu C.-Y., Biomicrofluidics 5, 014103 (2011). 10.1063/1.3552992 [DOI] [Google Scholar]
- Wang L., Liu D., Wang X., and Han X., Chem. Eng. Sci. 81, 157 (2012). 10.1016/j.ces.2012.07.004 [DOI] [Google Scholar]
- Ansari M. A. and Kim K.-Y., Chem. Eng. J. 162, 760 (2010). 10.1016/j.cej.2010.05.068 [DOI] [Google Scholar]
- Ansari M. A., Kim K.-Y., Anwar K., and Kim S. M., J. Micromech. Microeng. 20, 055007 (2010). 10.1088/0960-1317/20/5/055007 [DOI] [Google Scholar]
- Xia G., Li J., Tian X., and Zhou M., Ind. Eng. Chem. Res. 51, 7816 (2012). 10.1021/ie2026234 [DOI] [Google Scholar]
- Li J., Xia G., and Li Y., J. Chem. Technol. Biotechnol. 88, 1757 (2013). 10.1002/jctb.4044 [DOI] [Google Scholar]
- Xia H., Wan S., Shu C., and Chew Y., Lab Chip 5, 748 (2005). 10.1039/b502031j [DOI] [PubMed] [Google Scholar]
- Schönfeld F., Hessel V., and Hofmann C., Lab Chip 4, 65 (2004). 10.1039/b310802c [DOI] [PubMed] [Google Scholar]
- Xia H., Wang Z., Koh Y., and May K., Lab Chip 10, 1712 (2010). 10.1039/b925025e [DOI] [PubMed] [Google Scholar]
- SadAbadi H., Packirisamy M., and Wüthrich R., RSC Adv. 3, 7296 (2013). 10.1039/c3ra40910d [DOI] [Google Scholar]
- Lim T. W., Son Y., Jeong Y. J., Yang D.-Y., Kong H.-J., Lee K.-S., and Kim D.-P., Lab Chip 11, 100 (2011). 10.1039/c005325m [DOI] [PubMed] [Google Scholar]
- Park J. M., Kim D. S., Kang T. G., and Kwon T. H., Microfluid Nanofluid 4, 513 (2008). 10.1007/s10404-007-0208-x [DOI] [Google Scholar]
- Wang L. and Yang J.-T., J. Micromech. Microeng. 16, 2684 (2006). 10.1088/0960-1317/16/12/022 [DOI] [Google Scholar]
- Fang W.-F. and Yang J.-T., Sens. Actuators, B 140, 629 (2009). 10.1016/j.snb.2009.05.007 [DOI] [Google Scholar]
- Chen Y.-T., Fang W.-F., Liu Y.-C., and Yang J.-T., Microfluid Nanofluid 11, 339 (2011). 10.1007/s10404-011-0803-8 [DOI] [Google Scholar]
- Anderson J. R., Chiu D. T., Wu H., Schueller O. J., and Whitesides G. M., Electrophoresis 21, 27 (2000). 10.1002/(SICI)1522-2683(20000101)21:1%3C27::AID-ELPS27%3E3.0.CO;2-C [DOI] [PubMed] [Google Scholar]
- McDonald J. C. and Whitesides G. M., Acc. Chem. Res. 35, 491 (2002). 10.1021/ar010110q [DOI] [PubMed] [Google Scholar]
- Anderson J. R., Chiu D. T., Jackman R. J., Cherniavskaya O., McDonald J. C., Wu H., Whitesides S. H., and Whitesides G. M., Anal. Chem. 72, 3158 (2000). 10.1021/ac9912294 [DOI] [PubMed] [Google Scholar]
- Wu H., Odom T. W., Chiu D. T., and Whitesides G. M., J. Am. Chem. Soc. 125, 554 (2003). 10.1021/ja021045y [DOI] [PubMed] [Google Scholar]
- Rotem A., Abate A. R., Utada A. S., Van Steijn V., and Weitz D. A., Lab Chip 12, 4263 (2012). 10.1039/c2lc40546f [DOI] [PubMed] [Google Scholar]
- Lee S. W., Kim D. S., Lee S. S., and Kwon T. H., J. Micromech. Microeng. 16, 1067 (2006). 10.1088/0960-1317/16/5/027 [DOI] [Google Scholar]
- Lin Y., Yu X., Wang Z., Tu S.-T., and Wang Z., Chem. Eng. J. 171, 291 (2011). 10.1016/j.cej.2011.04.003 [DOI] [Google Scholar]
- Johnson T. J., Ross D., and Locascio L. E., Anal. Chem. 74, 45 (2002). 10.1021/ac010895d [DOI] [PubMed] [Google Scholar]


