

Abstract
Glutathione is present in millimolar concentrations in the cell, but its relative distribution among cellular compartments remains elusive. We have chosen the endoplasmic reticulum (ER) as an example organelle to study compartment-specific glutathione levels. Using a glutaredoxin sensor (sCGrx1pER), which rapidly and specifically equilibrates with the reduced glutathione (GSH)–glutathione disulfide (GSSG) redox couple with known equilibrium constant, we showed that the [GSH]:[GSSG] ratio in the ER of intact HeLa cells is less than 7:1. Taking into consideration the previously determined value for [GSH]2:[GSSG] in the ER of 83 mM, this translates into a total glutathione concentration in the ER ([GStot]=[GSH]+2[GSSG]) of greater than 15 mM. Since the integrated, intracellular [GStot] was measured as ~7 mM, we conclude the existence of a [GStot] gradient across the ER membrane. A possible homeostatic mechanism by which cytosol-derived glutathione is trapped in the ER is discussed. We propose a high [GStot] as a distinguishing feature of the ER environment compared to the extracellular space.
Abbreviations: DTT, Dithiothreitol; EGSH, Half cell reduction potential of glutathione; ER, Endoplasmic reticulum; GSH, Reduced glutathione; GSSG, Glutathione disulfide; [GStot], Total glutathione concentration; NEM, N-ethylmaleimide; OxD, Percentage of oxidation; PDI, Protein disulfide isomerase; PERK, Double stranded RNA-activated protein kinase (PKR)-like ER kinase; Redox, Reduction–oxidation; RGS, [GSH]:[GSSG]; sCGrx1p, C30S mutant of yeast glutaredoxin 1; TMM(PEG)12, Maleimide-activated polyethylene glycol; UPR, Unfolded protein response; XBP1, X-box binding protein 1
Keywords: Endoplasmic reticulum, Glutathione, Glutaredoxin, Redox compartmentalization, Redox Homeostasis, Reduction potential
Graphical abstract
Highlights
-
•
Glutathionylation status of a 1-Cys glutaredoxin is a readout for [GSH]:[GSSG].
-
•
Compartment-specific [GStot] is given by [GSH]:[GSSG] and [GSH]2:[GSSG].
-
•
[GStot] is higher in the ER than in the cytosol of human cells.
Introduction
Many intracellular reduction–oxidation (redox) processes are directly or indirectly linked to the redox-active, tripeptide-like compound glutathione [1]. Glutathione is composed of the three amino acids glutamate, cysteine, and glycine and exists as a mixture of its reduced form, GSH, and its disulfide-linked dimeric form, GSSG. The biosynthesis of glutathione takes place in the cytosol, from where it is transported to other cellular compartments [2]. As intracellular glutathione concentrations are in the millimolar range, its compartment-specific status is considered a major determinant of intracellular redox environments [3]. The reductive (or oxidative) power of glutathione is defined by its electrochemical half cell reduction potential (EGSH), calculated from its standard reduction potential (E°'=−240 mV) and the concentrations of GSH and GSSG using the Nernst equation (Eq. (1)) where R=8.315 J K−1 mol−1 is the gas constant, T=298 K the temperature, and F=96,485 C mol−1 the Faraday constant.
| (1) |
It is widely accepted that EGSH in the endoplasmic reticulum (ER) is more oxidizing (i.e. higher) than in other non-secretory organelles such as mitochondria, nucleus, or the cytosol [4]. This makes sense, because the ER is the site where disulfide bonds are being synthetized and transferred onto nascent secretory and membrane proteins [5]. Relatively oxidizing ER redox conditions were originally reported based on the measurement of the [GSH]:[GSSG] ratio in all compartments of the secretory pathway (including the ER) in hybridoma cells as 1:1–3:1 [6]. This was achieved by analyzing the thiol-disulfide state of a small glycopeptide, which directly, but probably not specifically reacted with GSH–GSSG. To derive EGSH from these ratios, the authors went on to estimate the cellular concentration of total glutathione [GStot](=[GSH]+2[GSSG]) as 8 mM and assumed [GStot] in the secretory pathway to either equal this concentration or to be eight times lower, which returned EGSH values of −170 to −185 mV or −133 to −165 mV, respectively [6]. Subsequent studies using isolated ER-membrane vesicles (“microsomes”) reported [GSH]:[GSSG] ratios of 3:1–6:1 [7,8]. However, as GSH can leak through the microsomal membrane [9], these ratios and the derived EGSH values based on microsomal [GStot] may not reflect the situation in the ER of living cells.
Recently, EGSH in the ER of intact HeLa cells was directly measured as −208±4 mV using a glutathione-specific redox-sensitive variant of green fluorescent protein [10]. On the basis of this finding, it was concluded that either [GStot] in the ER ([GStot]ER) exceeds cellular [GStot] ([GStot]cell) or that the [GSH]:[GSSG] ratio in the ER of live cells is ≥11:1. Here, we found that a single-cysteine glutaredoxin targeted to the ER is at least 92% oxidized in situ at steady state. As sCGrx1p rapidly attains equilibrium with [GSH]:[GSSG] through autocatalyzed glutathionylation [11], this suggests that in the ER, [GSH]:[GSSG] is less than 7:1 and, consequently, [GStot]ER significantly greater than [GStot]cell.
Materials and methods
Cloning of sCGrx1pER
The coding sequence of sCGrx1p was amplified by PCR from pOB3 [12] to include a C-terminal KDEL extension and ligated via KpnI/HindIII in frame into a plasmid harboring the ER signal sequence of ERp44 and an HA epitope upstream of a KpnI site (kindly provided by Roberto Sitia, Milan, Italy) [13].
Cell culture and transfection
HeLa cells were cultivated in Dulbecco's Modified Eagle's Medium (DMEM) containing 4.5 g/l glucose supplemented with 10% fetal bovine serum, 100 U/ml penicillin, 100 µg streptomycin at 37 °C in 5% CO2 and transfected with Turbofect (Fermentas) according to the manufacturer's protocols.
Metabolic labeling and immunoprecipitation
Transfected HeLa cells were washed with phosphate-buffered saline (PBS) and labeled overnight in complete DMEM cultivation medium containing 50 μCi/ml EasyTag EXPRESS 35S protein labeling mix (PerkinElmer Life Sciences). Chase was in DMEM containing 10 mM l-methionine. For immunoprecipitation, the cells were washed with cold PBS, lysed for 1 h on ice in lysis buffer [100 mM Na phosphate, 1% Triton X-100, pH 8, 0.2 mM phenyl methyl sulphonyl fluoride (PMSF)], and the lysate centrifuged at 17,000 g for 1 hour at 4°. The supernatant was added to protein A-Sepharose beads (Life Technologies) carrying prebound anti-HA antibodies (clone 12CA5, kindly provided by Hans-Peter Hauri). After overnight incubation at 4° on a rotary shaker, the beads were washed four times with lysis buffer and once with PBS.
TMM(PEG)12 modification protocol
To block the sulfhydryl groups of free cysteines in situ, cell monolayers were washed with ice-cold PBS containing 20 mM N-ethylmaleimide (NEM; Sigma), and incubated in the same buffer on ice for 20 min. After immunoprecipitation, as described above, proteins were released from the beads by incubation in 40 μl 80 mM Tris/HCl, pH7.0, 2% SDS for 5 min in a heat block at 97 °C, followed by vortexing for 5 s. Then, 40 μl of supernatant was transferred to a tube containing 2 μl of 200 mM Tris(2-carboxyethyl)phosphine (TCEP; Sigma; ~10 mM final concentration) and incubated for 10 min at room temperature to reduce the active-site cysteine, which was then alkylated for 1 h at room temperature in 15 mM maleimide-activated polyethylene glycol (TMM(PEG)12; Thermo Scientific; 5.5 μl of 125 mM stock added and carefully mixed). Excess TMM(PEG)12 was removed by protein precipitation by using methanol/chloroform as previously described [14]. The extent of TMM(PEG)12 modification was determined by 16% SDS-PAGE and imaging of the dried gel on a Typhoon phosphorimager (GE Healthcare).
Determination of [GStot]cell
A total of 1.8×10⁶ HeLa cells were seeded into a 10 cm dish and incubated at 37° for 48 h. To measure the cell number and diameter, cells were harvested by trypsinization and the suspension analyzed in a Luna™ automated cell counter (Logos Biosystems). Cell viability, as determined by Trypan blue exclusion, was routinely>90%. Total cell volume was calculated by multiplying the single cell volume (by standard sphere formula) and cell count per ml of cell suspension. 1 ml of cell suspension was gently pelleted, the supernatant discarded and the cell pellet resuspended in 1 ml of 1% sulfosalicylic acid followed by incubation on ice for 15 min. Precipitated proteins were pelleted by centrifugation and the supernatant subjected to a 5,5'-dithiobis(2-nitro-benzoic acid)–glutathione reductase assay to measure [GStot] [15]. This concentration and the total cell volume were used to calculate [GStot]cell.
Densitometry
Western blots were densitometrically quantified using the ImageJ software (available at http://rsbweb.nih.gov/ij/). For the quantification of Phosphorimager scans, the ImageQuant 5.2 software (GE Healthcare) was used.
Additional methods
Indirect immunofluorescence staining, 4-acetamido-4'-maleimidylstilbene-2,2'-disulphonic acid (AMS; Life Technologies) modification, Western blot, and the XBP1 splicing assay were performed as before [10].
Results and discussion
Principle of [GSH]:[GSSG] determination in the ER
With the aim to monitor the [GSH]:[GSSG] ratio in the ER of live cells, we fused the C30S mutant of yeast glutaredoxin 1 (sCGrx1p) with N-terminal signal peptide and HA-tag and C-terminal KDEL ER retrieval motif (Fig. 1A). This mutant is known to catalyze its own glutathionylation by reacting with one molecule of GSSG according to Eq. (2) [11].
| (2) |
The equilibrium constant Kox of the above reaction (Eq. (3)) has been determined by two independent methods with similar outcomes [11], whereas the value of 74±6 derived from MALDI-TOF mass spectrometry was considered quantitative.
| (3) |
Autocatalyzed equilibration of the sCGrx1p SH–sCGrx1p SSG and the GSH–GSSG redox couples occurs rapidly in vitro [11,16]. Based on this, we assumed this reaction to be at kinetic equilibrium even in a complex mixture of redox couples as present in the lumen of the ER. Thus, using the experimentally determined [sCGrx1pSH]:[sCGrx1pSSG] ratio and Kox, the [GSH]:[GSSG] ratio RGS can be calculated according to Eq. (4).
| (4) |
We expressed ER-targeted sCGrx1p (sCGrx1pER) in HeLa cells and confirmed its correct localization, which overlapped with that of endogenous protein disulfide isomerase (PDI), by indirect immunofluorescence microscopy using anti-HA (Fig. 1B+C). Specifically, since both our antibody against the ER marker PDI and anti-HA are of mouse origin, we co-expressed the ER-targeted fluorescent protein HyPerER [17] and found co-localization with PDI (Fig. 1B) and with sCGrx1pER (Fig. 1C).
Fig. 1.
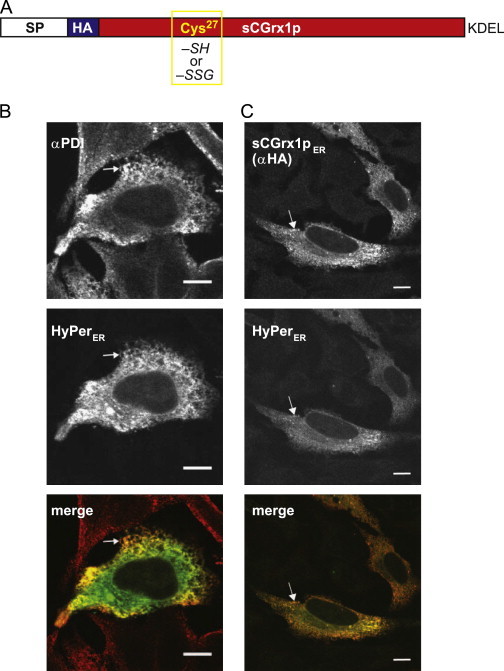
Targeting of sCGrx1p to the ER. (A) Schematic representation of sCGrx1pER. The active site Cys27 is either reduced (–SH) or glutathionylated (–SSG). SP, ER signal peptide; HA, hemagglutinin epitope; KDEL, ER retrieval motif. (B) HyPerER (green) was transfected into HeLa cells and the cells stained with αPDI followed by a red-fluorescent goat-anti-mouse antibody. (C) HeLa cells were co-transfected with HyPerER (green) and sCGrx1pER, which was stained with αHA/goat-anti-mouse (red). Merged images are shown in the bottom panel, and white arrows highlight examples of co-localizing structures. (For interpretation of the references to color in this figure legend, the reader is referred to the web version of this article.)
Expression of sCGrx1pER does not disturb ER homeostasis
Although PDI family members can catalyze protein deglutathionylation reactions to some extent [18], the ER in mammalian cells does not harbor bona fide glutaredoxin enzymes [19]. Accordingly, introduction of an exogenous glutaredoxin such as sCGrx1pER could disturb ER redox homeostasis. It could, for instance, catalyze formation of GSSG from glutathionylated proteins. This could result in a decrease in the [GSH]:[GSSG] ratio, which in turn would likely elicit unfolded protein response (UPR) stress signaling pathways, as has been observed before [20]. We therefore set out to test these possibilities. To this end, HeLa cells were transfected with sCGrx1pER, empty vector as negative control, or a plasmid encoding the hyperactive ER oxidase Ero1β-C100/130A [10] as positive control for ER hyperoxidation. To probe for the oxidation state of the ER in these cells, we used a previously established electrophoretic mobility shift assay based on the alkylation of cysteine residues in the ER-resident, PDI-related oxidoreductase ERp57 [14,21]. Expression of sCGrx1pER did not increase the oxidation of ERp57, whereas expression of Ero1β-C100/130A did as expected (Fig. 2A).
Fig. 2.
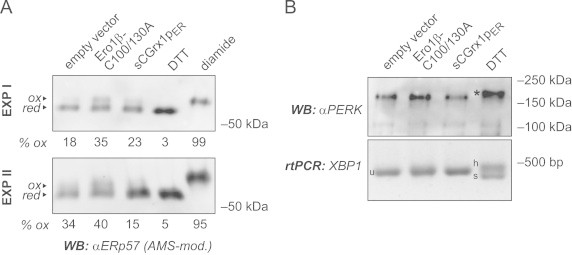
sCGrx1pER neither causes ER hyperoxidation nor ER stress. (A) HeLa cells were transfected with the indicated constructs for 24 h or, to obtain fully reduced or oxidized control samples, treated with DTT (10 mM for 5 min) or diamide (5 mM for 5 min), respectively. Free cysteines were alkylated in situ with NEM. After cell lysis, proteins were reduced with TCEP and re-alkylated with AMS, and the modified lysates analyzed by SDS-PAGE and anti-ERp57 western blot (WB). The AMS-modified, oxidized fraction of ERp57 (ox) runs slower than the reduced fraction (red). Oxidized fractions, as determined by densitometry, are indicated in percent (% ox). Results of two independent experiments (EXP I and EXP II) are shown. (B) HeLa cells were transfected as in panel (A) or treated with DTT (2 mM for 1 h). The phosphorylation/activation of PERK was analyzed by anti-PERK western blot based on the decreased mobility of the phosphorylated protein (asterisk). In equivalent cell samples, total RNA was isolated and subjected to rtPCR analysis using primers specific for XBP1. Splicing of XBP1 mRNA is evident by the appearance of the spliced (s) and the hybrid (h) forms, as opposed to the unspliced (u) form.
We next examined two established pathways of the mammalian UPR under the same experimental conditions, namely the phosphorylation of double stranded RNA-activated protein kinase (PKR)-like ER kinase (PERK) and the splicing of X-box binding protein 1 (XBP1) mRNA [22]. As shown in Fig. 2B, neither PERK phosphorylation nor XBP1 splicing was detected in cells expressing sCGrx1pER. In contrast, treatment of cells with DTT, an established trigger of the UPR, readily activated both PERK and XBP1.
These data are in agreement with a previous study where human Grx1 and fusion proteins thereof expressed in the ER of HeLa cells did not cause any detectable redox and stress responses [10]. Likewise, it should be noted that the reported findings are not entirely unexpected, since in an oxidizing environment like the ER [6,10], glutaredoxin-mediated catalysis of protein deglutathionylation has been found to be weak [18]. We concluded that sCGrx1pER was well-suited as a sensor for [GSH]:[GSSG] in the ER, as it localized specifically to this compartment without detectably disturbing the local redox conditions.
sCGrx1pER is not rapidly degraded
Since the native environment of Grx1p is the yeast cytosol [23], we next tested the stability of sCGrx1p in the ER. To this end, we performed pulse-chase experiments using HeLa cells where sCGrx1pER was transiently expressed. Cells were metabolically labeled with 35S-methionine to steady state overnight followed by incubation for 0–3 h in media containing an excess of unlabeled methionine (chase). sCGrx1pER was not significantly degraded during the chase, indicating that it is reasonably stable in the ER (Fig. 3A+B).
Fig. 3.
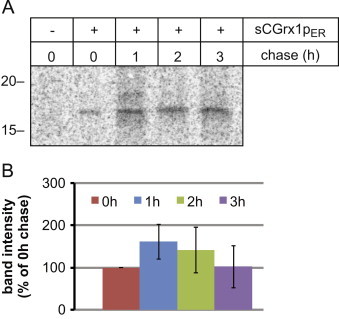
Pulse-chase analysis of sCGrx1pER. (A) HeLa cells transfected or not with sCGrx1pER were labeled with 35S-methionine overnight and chased for the indicated time periods. sCGrx1pER was isolated by anti-HA immunoprecipitation and analyzed by SDS-PAGE and phosphorimaging. (B) Densitometric analysis of sCGrx1pER band intensity (n=3; mean±SEM).
sCGrx1pER is predominantly glutathionylated at steady state
Via its only cysteine in the mature protein, Cys27, sCGrx1pER reacts with GSSG leading to glutathionylation of Cys27 (Eq. (2)). To examine the extent of Cys27 glutathionylation in living cells, we employed a cysteine-specific alkylation protocol of immunoprecipitated protein, which was previously used to assay the thiol-disulfide state of PDI [14]. Thus, sCGrx1pER was expressed and metabolically labeled in HeLa cells, and the non-glutathionylated fraction of Cys27 (in the thiol form) was allowed to react with NEM added to the cell monolayer. Following immunoprecipitation, glutathionylation was reversed with TCEP, and the resulting reduced cysteine alkylated with TMM(PEG)12, which decreased the mobility of sCGrx1pER in SDS-PAGE. Autoradiography revealed that the vast majority of sCGrx1pER was TMM(PEG)12-modified at steady state (Fig. 4). Conversely, sCGrx1pER that was subjected to NEM-alkylation after treatment of cells with DTT ran at the mobility of the unmodified protein (compare Figs. 3 and 4), indicating that reduced sCGrx1pER can quantitatively react with NEM in situ.
Fig. 4.
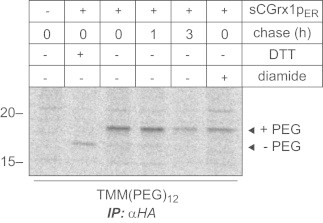
Redox state analysis of sCGrx1pER. HeLa cells were transfected or not with sCGrx1pER, pulsed overnight with 35S-methionine and chased for the indicated time periods. NEM-modified cell lysates were subjected to anti-HA immunoprecipitation, and the immunoprecipitates treated with TCEP and TMM(PEG)12 as described in Materials and methods. Samples were separated by SDS-PAGE and visualized on a phosphorimager. Where indicated, cells were treated with DTT or diamide prior to NEM-alkylation as in Fig. 2A.
The percentage of sCGrx1pER glutathionylation (OxD) was determined by quantifying the intensity of TMM(PEG)12-modified and -non-modified bands by densitometry. To exclude incompletely folded sCGrx1pER from the analysis, we only considered sCGrx1pER 35S-signals that were obtained after a 1 h chase period (Fig. 4). Analysis of three independent experiments returned an OxD value of 92±3% corresponding to a [sCGrx1pSH]:[sCGrx1pSSG] ratio of 0.085±0.033 (Table 1). According to Eq. (4), this translates into a [GSH]:[GSSG] ratio RGS of 6.3. As densitometric determination of an OxD value>90% is imprecise and most likely results in an underestimation of OxD, we conservatively concluded that [GSH]:[GSSG] in the ER of HeLa cells is less than 7:1 (Table 1).
Table 1.
Glutathione-related redox parameters measured in the endoplasmic reticulum (ER) of HeLa cells.
| Parameter (ER, HeLa) | Value | Reference |
|---|---|---|
| OxDsCGrx1p | 92±3% | This study |
| [sCGrx1pSH]:[sCGrx1pSSG] | 0.085±0.033 | This study |
| [GSH]:[GSSG] (RGS) | <7 | This study |
| [GSH]2:[GSSG] | 83 mM | [10] |
| [GStot] | >15 mM | This study |
Calculation of [GStot]ER
Having obtained a value for [GSH]:[GSSG] (RGS) in the ER of live cells, we set out to calculate [GStot]ER. To achieve this, we used the published value of EGSH(ER) of -208 mV [10], which can also be expressed as [GSH]2:[GSSG]=83 mM (see Eq. (1) and Table 1). [GSH]2:[GSSG] and RGS are converted into [GStot]ER=[GSH]+2[GSSG] according to Eq. (5).
| (5) |
Using RGS=7, Eq. (5) returns a value for [GStot]ER of 15.2 mM. However, since RGS is likely less than 7 (see above), the total glutathione concentration in the ER may in reality significantly exceed 15 mM (Table 1).
The ER membrane maintains a [GStot] gradient
Intracellular glutathione concentrations range between 0.5 and 15 mM [1]. We were therefore interested in relating [GStot]ER with [GStot]cell in our particular experimental system. To this end, we determined the average cell volume of trypsinized HeLa cells as described in Materials and methods and measured the total glutathione content of cells, which were gently pelleted from the same suspension, using the established glutathione reductase recycling assay. The obtained values of 2.2 pl average cell volume and ~7 mM [GStot]cell (Table 2) are in good agreement with previous measurements [24].
Table 2.
Determination of [GStot]cell in HeLa cells.
| Parameter (HeLa) | Value |
|---|---|
| Average cell volume | 2.2 pl (1 pl=103 μm3) |
| [GStot]cell | 6.9±2.6 mM |
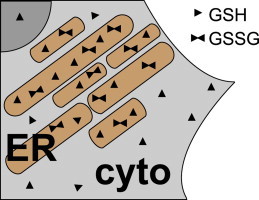
Since [GStot]cell is the sum of [GStot]ER and [GStot] from all other subcellular compartments including the cytosol, our data suggest that [GStot] in the cytosol is significantly lower than [GStot]ER. Thus, despite the fact that glutathione synthesis takes place in the cytosol, the ER membrane appears to maintain an ascending [GStot] gradient (Fig. 5). We propose that this gradient is the result of the relatively oxidizing milieu in the ER [6,10] and the virtual impermeability of the ER membrane to GSSG [9]. Cytosol-derived GSH can diffuse into the ER where a fraction of it is oxidized to membrane-impermeable GSSG [25]. This process is expected to lower [GSH]ER and to set up a driving force for further import of GSH from the cytosol. According to this model, the ER would constitute a trap for cellular glutathione, which is reminiscent of the mechanism of osmosis where an impermeable metabolite drives the diffusion of a permeable metabolite across a selectivity barrier such as a biological membrane.
Fig. 5.

Schematic cartoon of a detail of a HeLa cell depicting the trapping of cellular glutathione in the ER. GSH can freely enter the ER (light brown) from the cytosol (cyto, light gray) where some of it is converted to GSSG through the action of the resident machinery for oxidative protein folding. GSSG cannot (or only inefficiently) diffuse back into the cytosol. Thus, as the concentration of GSH can equilibrate between luminal and cytosolic side of the ER membrane, [GStot] is significantly higher in the ER than in the cytosol.
Conclusions
Measuring compartment-specific [GStot] is a challenging task [1]. In this study, we addressed the question whether or not glutathione is uniformly distributed among two subcellular compartments, cytosol and ER. For this purpose, we implemented a novel strategy to calculate [GStot] in the ER by using a combination of two readouts, which report [GSH]2:[GSSG] (Grx1-roGFP1-iE; [10]) and [GSH]:[GSSG] (sCGrx1p; this study), respectively. Our work comes to the surprising conclusion that [GStot]ER is considerably higher than [GStot]cell and, thus, [GStot] in the cytosol. As the literature so far assumed that [GStot]ER would either equal [GStot]cell or be lower [6], this finding is remarkable and may change the way we think about intracellular glutathione fluxes and its role in specific cellular organelles.
Since [GStot]cell varies in different cell types and different physiological settings [1], it is likely that the [GStot] gradient across the ER membrane shows variability in different in vivo models compared to HeLa cells. Nonetheless, we propose that a relatively high [GStot]ER constitutes a general characteristic of ER physiology. Since the trapping of cytosolic GSH into the ER, which is known to bring about reductive input [21,26,27], is directly driven by the organelle's oxidation level (see Fig. 5), we further suggest that [GStot]ER is an adjustable and “homeostatic” parameter. The ER and the extracellular space have similar redox conditions and calcium concentration [28]. In contrast, our measurement of a high [GStot]ER discloses a noteworthy distinguishing feature, as extracellular [GStot] is low [2].
Acknowledgments
We thank Julia Birk for invaluable help with light microscopy and for the preparation of Fig. 5, Alex Odermatt for generous support, Roberto Sitia, Ari Helenius, and Hans-Peter Hauri for materials, and Suzette Moes and Paul Jenö for trial mass spectrometry experiments. This work was funded by a Swiss National Science Foundation Ambizione grant (C.A.-H.), the University of Basel (C.A.-H.), and by a Grant from the Danish Natural Science Research Council (J.R.W.) and the Villum Foundation (C.T.).
Footnotes
This is an open-access article distributed under the terms of the Creative Commons Attribution-NonCommercial-No Derivative Works License, which permits non-commercial use, distribution, and reproduction in any medium, provided the original author and source are credited.
Contributor Information
Davide Montero, Email: davide.montero@stud.unibas.ch.
Christine Tachibana, Email: chris.tachibana@gmail.com.
Jakob Rahr Winther, Email: jrwinther@bio.ku.dk.
Christian Appenzeller-Herzog, Email: Christian.Appenzeller@unibas.ch.
References
- 1.Deponte M. Glutathione catalysis and the reaction mechanisms of glutathione-dependent enzymes. Biochim. Biophys. Acta. 2013;1830:3217–3266. doi: 10.1016/j.bbagen.2012.09.018. [DOI] [PubMed] [Google Scholar]
- 2.Bachhawat A.K., Thakur A., Kaur J., Zulkifli M. Glutathione transporters. Biochim. Biophys. Acta. 2013;1830:3154–3164. doi: 10.1016/j.bbagen.2012.11.018. [DOI] [PubMed] [Google Scholar]
- 3.Go Y.M., Jones D.P. Redox compartmentalization in eukaryotic cells. Biochim. Biophys. Acta. 2008;1780:1273–1290. doi: 10.1016/j.bbagen.2008.01.011. [DOI] [PMC free article] [PubMed] [Google Scholar]
- 4.Appenzeller-Herzog C. Glutathione- and non-glutathione-based oxidant control in the endoplasmic reticulum. J. Cell Sci. 2011;124:847–855. doi: 10.1242/jcs.080895. [DOI] [PubMed] [Google Scholar]
- 5.Ramming T., Appenzeller-Herzog C. The physiological functions of mammalian endoplasmic oxidoreductin 1: on disulfides and more. Antioxid. Redox Signal. 2012;16:1109–1118. doi: 10.1089/ars.2011.4475. [DOI] [PubMed] [Google Scholar]
- 6.Hwang C., Sinskey A.J., Lodish H.F. Oxidized redox state of glutathione in the endoplasmic reticulum. Science. 1992;257:1496–1502. doi: 10.1126/science.1523409. [DOI] [PubMed] [Google Scholar]
- 7.Bass R., Ruddock L.W., Klappa P., Freedman R.B. A major fraction of endoplasmic reticulum-located glutathione is present as mixed disulfides with protein. J. Biol. Chem. 2004;279:5257–5262. doi: 10.1074/jbc.M304951200. [DOI] [PubMed] [Google Scholar]
- 8.Dixon B.M., Heath S.H., Kim R., Suh J.H., Hagen T.M. Assessment of endoplasmic reticulum glutathione redox status is confounded by extensive ex vivo oxidation. Antioxid. Redox. Signal. 2008;10:963–972. doi: 10.1089/ars.2007.1869. [DOI] [PMC free article] [PubMed] [Google Scholar]
- 9.Banhegyi G., Lusini L., Puskas F., Rossi R., Fulceri R., Braun L., Mile V., di Simplicio P., Mandl J., Benedetti A. Preferential transport of glutathione versus glutathione disulfide in rat liver microsomal vesicles. J. Biol. Chem. 1999;274:12213–12216. doi: 10.1074/jbc.274.18.12213. [DOI] [PubMed] [Google Scholar]
- 10.Birk J., Meyer M., Aller I., Hansen H.G., Odermatt A., Dick T.P., Meyer A.J., Appenzeller-Herzog C. Endoplasmic reticulum: reduced and oxidized glutathione revisited. J. Cell Sci. 2013;126:1604–1617. doi: 10.1242/jcs.117218. [DOI] [PubMed] [Google Scholar]
- 11.Iversen R., Andersen P.A., Jensen K.S., Winther J.R., Sigurskjold B.W. Thiol-disulfide exchange between glutaredoxin and glutathione. Biochemistry. 2010;49:810–820. doi: 10.1021/bi9015956. [DOI] [PubMed] [Google Scholar]
- 12.Bjornberg O., Ostergaard H., Winther J.R. Mechanistic insight provided by glutaredoxin within a fusion to redox-sensitive yellow fluorescent protein. Biochemistry. 2006;45:2362–2371. doi: 10.1021/bi0522495. [DOI] [PubMed] [Google Scholar]
- 13.Otsu M., Bertoli G., Fagioli C., Guerini-Rocco E., Nerini-Molteni S., Ruffato E., Sitia R. Dynamic retention of Ero1alpha and Ero1beta in the endoplasmic reticulum by interactions with PDI and ERp44. Antioxid. Redox. Signal. 2006;8:274–282. doi: 10.1089/ars.2006.8.274. [DOI] [PubMed] [Google Scholar]
- 14.Appenzeller-Herzog C., Ellgaard L. In vivo reduction-oxidation state of protein disulfide isomerase: the two active sites independently occur in the reduced and oxidized forms. Antioxid. Redox. Signal. 2008;10:55–64. doi: 10.1089/ars.2007.1837. [DOI] [PubMed] [Google Scholar]
- 15.Minich T., Riemer J., Schulz J.B., Wielinga P., Wijnholds J., Dringen R. The multidrug resistance protein 1 (Mrp1), but not Mrp5, mediates export of glutathione and glutathione disulfide from brain astrocytes. J. Neurochem. 2006;97:373–384. doi: 10.1111/j.1471-4159.2006.03737.x. [DOI] [PubMed] [Google Scholar]
- 16.Jensen K.S., Winther J.R., Teilum K. Millisecond dynamics in glutaredoxin during catalytic turnover is dependent on substrate binding and absent in the resting states. J. Am. Chem. Soc. 2011;133:3034–3042. doi: 10.1021/ja1096539. [DOI] [PubMed] [Google Scholar]
- 17.Enyedi B., Varnai P., Geiszt M. Redox state of the endoplasmic reticulum is controlled by Ero1L-alpha and intraluminal calcium. Antioxid. Redox. Signal. 2010;13:721–729. doi: 10.1089/ars.2009.2880. [DOI] [PubMed] [Google Scholar]
- 18.Peltoniemi M.J., Karala A.R., Jurvansuu J.K., Kinnula V.L., Ruddock L.W. Insights into deglutathionylation reactions. Different intermediates in the glutaredoxin and protein disulfide isomerase catalyzed reactions are defined by the gamma-linkage present in glutathione. J. Biol. Chem. 2006;281:33107–33114. doi: 10.1074/jbc.M605602200. [DOI] [PubMed] [Google Scholar]
- 19.Izquierdo A., Casas C., Muhlenhoff U., Lillig C.H., Herrero E. Saccharomyces cerevisiae Grx6 and Grx7 are monothiol glutaredoxins associated with the early secretory pathway. Eukaryot. Cell. 2008;7:1415–1426. doi: 10.1128/EC.00133-08. [DOI] [PMC free article] [PubMed] [Google Scholar]
- 20.Hansen H.G., Schmidt J.D., Soltoft C.L., Ramming T., Geertz-Hansen H.M., Christensen B., Sorensen E.S., Juncker A.S., Appenzeller-Herzog C., Ellgaard L. Hyperactivity of the Ero1alpha oxidase elicits endoplasmic reticulum stress but no broad antioxidant response. J. Biol. Chem. 2012;287:39513–39523. doi: 10.1074/jbc.M112.405050. [DOI] [PMC free article] [PubMed] [Google Scholar]
- 21.Jessop C.E., Bulleid N.J. Glutathione directly reduces an oxidoreductase in the endoplasmic reticulum of mammalian cells. J. Biol. Chem. 2004;279:55341–55347. doi: 10.1074/jbc.M411409200. [DOI] [PubMed] [Google Scholar]
- 22.DuRose J.B., Tam A.B., Niwa M. Intrinsic capacities of molecular sensors of the unfolded protein response to sense alternate forms of endoplasmic reticulum stress. Mol. Biol. Cell. 2006;17:3095–3107. doi: 10.1091/mbc.E06-01-0055. [DOI] [PMC free article] [PubMed] [Google Scholar]
- 23.Ostergaard H., Tachibana C., Winther J.R. Monitoring disulfide bond formation in the eukaryotic cytosol. J. Cell Biol. 2004;166:337–345. doi: 10.1083/jcb.200402120. [DOI] [PMC free article] [PubMed] [Google Scholar]
- 24.van der Schans G.P., Vos O., Roos-Verheij W.S., Lohman P.H. The influence of oxygen on the induction of radiation damage in DNA in mammalian cells after sensitization by intracellular glutathione depletion. Int. J. Radiat. Biol. Relat. Stud. Phys. Chem. Med. 1986;50:453–470. doi: 10.1080/09553008614550861. [DOI] [PubMed] [Google Scholar]
- 25.Cuozzo J.W., Kaiser C.A. Competition between glutathione and protein thiols for disulphide-bond formation. Nat. Cell Biol. 1999;1:130–135. doi: 10.1038/11047. [DOI] [PubMed] [Google Scholar]
- 26.Lombardi A., Marshall R.S., Castellazzi C.L., Ceriotti A. Redox regulation of glutenin subunit assembly in the plant endoplasmic reticulum. Plant J. 2012;72:1015–1026. doi: 10.1111/tpj.12020. [DOI] [PubMed] [Google Scholar]
- 27.Molteni S.N., Fassio A., Ciriolo M.R., Filomeni G., Pasqualetto E., Fagioli C., Sitia R. Glutathione limits Ero1-dependent oxidation in the endoplasmic reticulum. J. Biol. Chem. 2004;279:32667–32673. doi: 10.1074/jbc.M404992200. [DOI] [PubMed] [Google Scholar]
- 28.Braakman I., Bulleid N.J. Protein folding and modification in the mammalian endoplasmic reticulum. Annu. Rev. Biochem. 2011;80:71–99. doi: 10.1146/annurev-biochem-062209-093836. [DOI] [PubMed] [Google Scholar]