

Abstract
Altered expression of glucose transporters is a major characteristic of diabetes. Vitamin D has evolved widespread interest in the pathogenesis and prevention of diabetes. The present study was designed to investigate the effect of vitamin D in the overall regulation of muscle cell glucose transporter expression. L6 cells were exposed to type 1 and type 2 diabetic conditions and the effect of calcitriol (1,25, dihydroxy cholicalciferol) on the expression of glucose transporters was studied by real time polymerase chain reaction (RT-PCR). There was a significant decrease in glucose transporter type 1 (GLUT1), GLUT4, vitamin D receptor (VDR), and IR expression in type 1 and 2 diabetic model compared to control group. Treatment of myoblasts with 10-7 M calcitriol for 24 h showed a significant increase in GLUT1, GLUT4, VDR, and insulin receptor (IR) expression. The results indicate a potential antidiabetic function of vitamin D on GLUT1, GLUT4, VDR, and IR by improving receptor gene expression suggesting a role for vitamin D in regulation of expression of the glucose transporters in muscle cells.
Keywords: Diabetes, glucose transporters, vitamin D
INTRODUCTION
Altered expression of glucose transporters is a major characteristic of diabetes. Due to the reduced activity of the transporters, utilization of glucose by the cells is diminished causing hyperglycemia.[1] Vitamin D has sparked a widespread interest in the pathogenesis and prevention of diabetes. Skeletal muscle is considered a major site that determines glycemia. The present study was designed to investigate the expression of glucose transporter type 1 (GLUT1) and GLUT4 in response to insulin and high glucose in L6 muscle cells, and to study the effect of vitamin D in the overall regulation of muscle cell glucose transporter gene expression.
EXPERIMENTAL PROCEDURES
Cell culture and differentiation
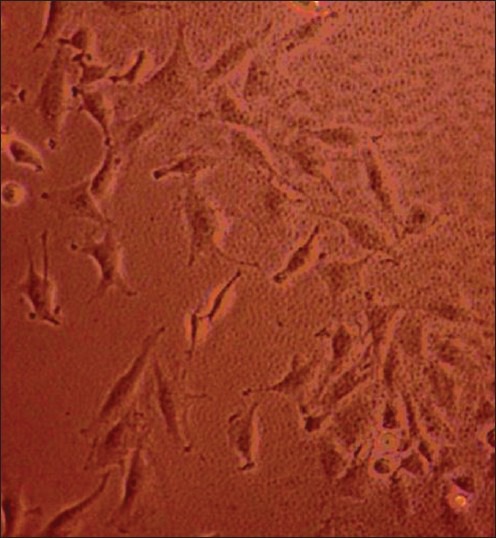
L6 cells were grown and maintained in monolayer culture in Dulbecco's modified Eagle Medium (DMEM) containing 10% fetal bovine serum (FBS), 100 units/ml antibiotics in an atmosphere of 5% CO2 at 37°C until they reached 40-50% confluence. To obtain fully differentiated myotubes [Figure 1], stock myoblasts were reseeded at a density of 4,000 cells/cm2 into T-25 flasks, in 10% FBS DMEM for 24 h. The medium was then replaced with 2% FBS DMEM. The cells were maintained for 7-8 days, with a medium change every 24-48 h, before use in experiments.
Figure 1.
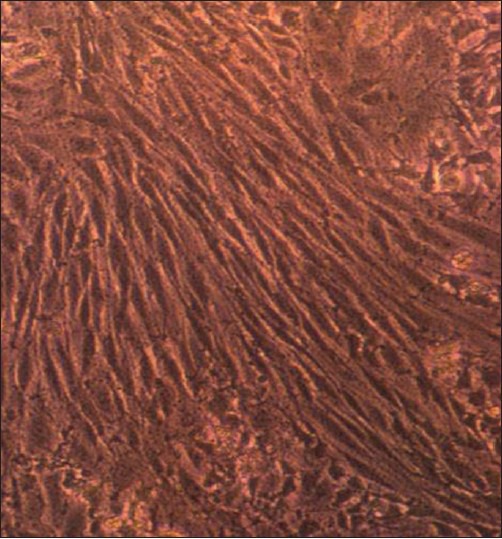
Differentiated L6 cells
Experimental design
Totally five groups of cell lines were used, the first set of cell line was exposed to normal glucose (8 mM) concentration which served as control (C), the second group of cells (T1) were exposed to high glucose (25 mM) which mimics type 1 diabetic model, the third group (T2) were exposed to high glucose (25 mM) and high Insulin (100 nM) which mimics type 2 diabetic model. The fourth (T3) and fifth group (T4) of cells were treated with 10−7 M calcitriol, that is, fourth group was type 1 diabetic model treated with 10−7 M calcitriol for 24 h and fifth group consisted type 2 diabetic model treated with 10−7 M calcitriol for 24 h.
RNA isolation and cDNA synthesis
RNA was isolated from the L6 myoblasts using the TRI-reagent. The cDNA synthesis reactions were carried out at 25°C for 10 min and 37°C for 2 h using an Eppendorf Personal Cycler.
Real time polymerase chain reaction (RT-PCR) analysis
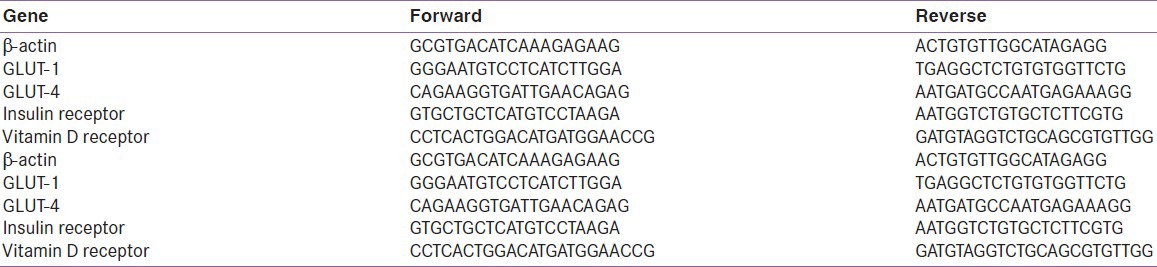
RT-PCR assays were performed in 96-well plates in RT-PCR instrument (Applied Biosystems). β-actin was used as endogenous control. The following thermal cycling profile was used (40 cycles): 50°C for 2 min, 95°C for 10 min, 95°C for 15 s, and 60°C for 1 min. The ΔΔCT method of relative quantification was used to determine the fold change in expression [Table 1].
Table 1.
Primers used for real-time polymerase chain reaction (RT-PCR)
Statistical methods
All results are expressed as mean ± standard error (SE). Statistical significance was determined by Student's t-tests and differences were considered significant at P < 0.05.
RESULTS
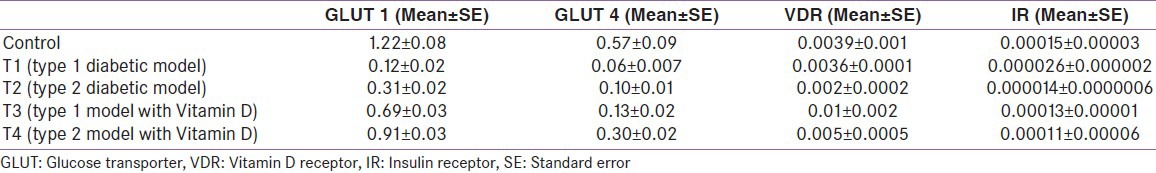
There was a decrease in GLUT1 (P = 0.002 and 0.004) [Figure 2], GLUT4 (P = 0.05 and 0.01) [Figure 3], vitamin D receptor (VDR) (P = 0.08 and 0.06) [Figure 4], and insulin receptor (IR) (P = 0.001 and 0.002) [Figures 5 and 6] expression in Type 1 and Type 2 diabetic model compared to control group, respectively. Treatment of myoblasts with 10−7 M calcitriol for 24 h showed a significant increase in GLUT1 (P = 0.03 and 0.02), GLUT4 (P = 0.01 and 0.06), VDR (P = 0.01 and 0.009), and IR (P = 0.005 and 0.006) expression in type 1 and type 2 diabetic model, respectively [Table 2].
Figure 2.
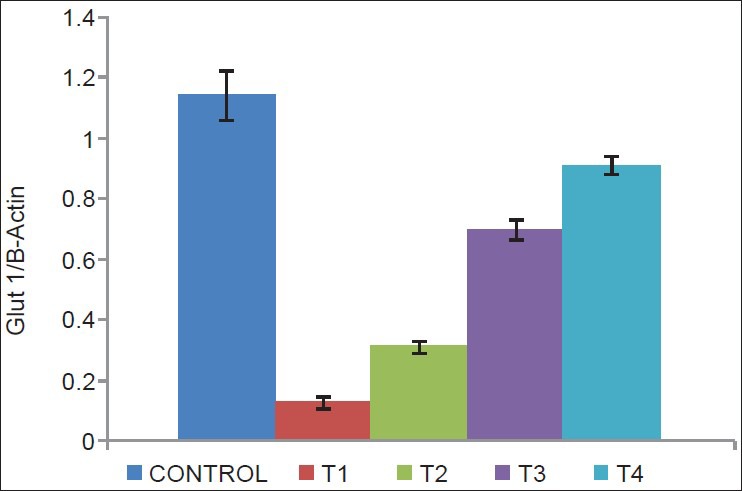
Glucose transporter type 1 (GLUT1) expression (Control = Normal glucose (8 mM), T1 = high glucose (25 mM) + no insulin (type 1 diabetic model), T2 = high glucose (25 mM) + high insulin (100 nM) (type 2 diabetic model), T3 = type 1 diabetic model treated with 10−7 M calcitriol, T4 = type 2 diabetic model treated with 10−7 M calcitriol)
Figure 3.
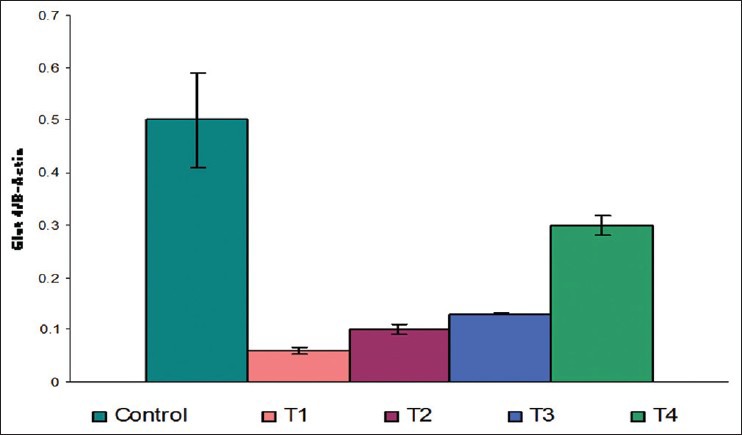
GLUT4 expression (Control = Normal glucose (8 mM), T1 = high glucose (25 mM) + no insulin (type 1 diabetic model), T2 = high glucose (25 mM) + high insulin (100 nM) (type 2 diabetic model), T3 = type 1 diabetic model treated with 10−7 M calcitriol, T4 = type 2 diabetic model treated with 10−7 M calcitriol)
Figure 4.
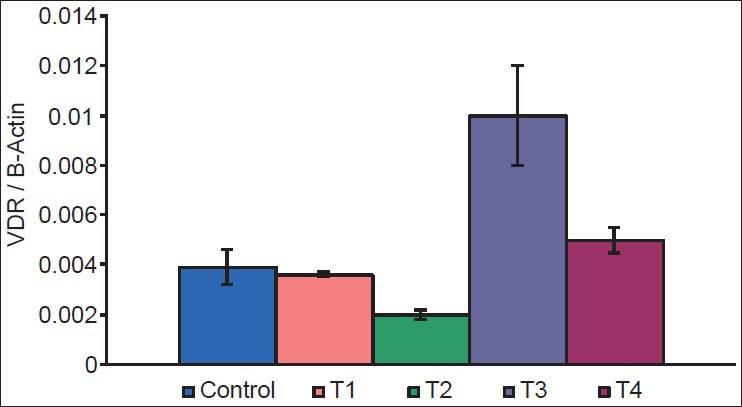
Vitamin D receptor (VDR) expression (Control = Normal glucose (8 mM), T1 = high glucose (25 mM) + no insulin (type 1 diabetic model), T2 = high glucose (25 mM) + high insulin (100 nM) (type 2 diabetic model), T3 = type 1 diabetic model treated with 10−7 M calcitriol, T4 = type 2 diabetic model treated with 10−7 M calcitriol)
Figure 5.
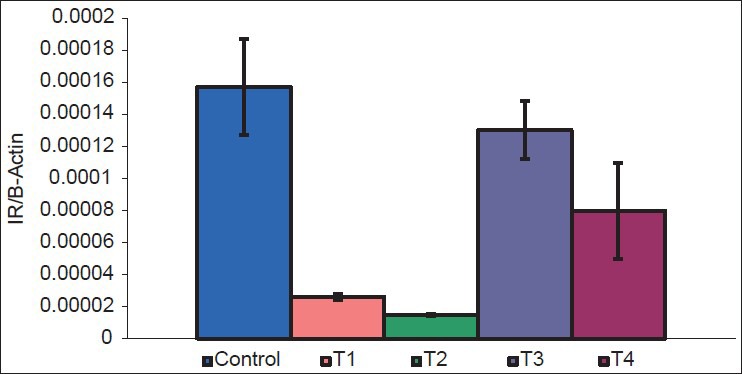
Insulin receptor (IR) expression (Control = Normal glucose (8 mM), T1 = high glucose (25 mM) + no insulin (type 1 diabetic model), T2 = high glucose (25 mM) + high insulin (100 nM) (type 2 diabetic model), T3 = type 1 diabetic model treated with 10−7 M calcitriol, T4 = type 2 diabetic model treated with 10−7 M calcitriol)
Figure 6.
L6 muscle cells
Table 2.
Results
DISCUSSION
It is well-documented that there is impaired utilization of glucose in a diabetic state due to altered expression of glucose transporters.[2] In our study, there was a significant decrease in GLUT1, GLUT4, and IR expression in type 1 diabetic model (T1) and type 2 diabetic model (T2) compared to control group. There was also a reduction in the expression of VDR in T1 and T2, however the difference was not significant.
Treatment of myoblasts (T1 and T2) with 10-7 M calcitriol showed a significant increase in GLUT1 and GLUT4 suggesting that circulating vitamin D levels can directly and positively regulate GLUT1 and GLUT4, a key player in glucose metabolism. Vitamin D also increased VDR and IR expression. In treated groups (T3 and T4) the expression of GLUT1, GLUT4, and IR was reversed near to control, whereas VDR expressions in treated groups were higher than the control group. These results propose the antidiabetic function of vitamin D on GLUT1, GLUT4, VDR, and IR by improving receptor gene expression. The discovery of this novel link between vitamin D, GLUT1, GLUT4, and IR may allow for better understanding of incidence of diabetes associated with vitamin D deficient population and may provide a treatment modality that may improvise the adverse effect of altered expression of glucose transporters in diabetes.
Footnotes
Source of Support: The authors wish to thank Endocrine Society of India and RSSDI for their financial support to carry out this work. BT received fund from Sri Ramachandra Chancellor Fellowship to carry out this work
Conflict of Interest: None declared
REFERENCES
- 1.Kahn BB. Facilitative glucose transporters: Regulatory mechanisms and dysregulatyion in diabetes. J Clin Invest. 1992;89:1367–74. doi: 10.1172/JCI115724. [DOI] [PMC free article] [PubMed] [Google Scholar]
- 2.Karnieli E, Armoni M. Regulation of glucose transporters in diabetes. Horm Res. 1990;33:99–104. doi: 10.1159/000181491. [DOI] [PubMed] [Google Scholar]