Abstract
Objectives:
To examine whether dynamic contrast-enhanced CT (DCE-CT) could be used to characterise and safely distinguish between malignant and benign lung tumours in patients with suspected lung cancer.
Methods:
Using a quantitative approach to DCE-CT, two separate sets of regions of interest (ROIs) in tissues were placed in each tumour: large ROIs over the entire tumour and small ROIs over the maximally perfused parts of the tumour. Using mathematical modelling techniques and dedicated perfusion software, this yielded a plethora of results.
Results:
First, because of their non-normal distribution, DCE-CT measurements must be analysed using log scale data transformation. Second, there were highly significant differences between large ROI and small ROI measurements (p<0.001). Thus, the ROI method used in a given study should always be specified in advance. Third, neither quantitative parameters (blood flow and blood volume) nor semi-quantitative parameters (peak enhancement) could be used to distinguish between malignant and benign tumours. This was irrespective of the method of quantification used for large ROIs (0.13<p<0.76) and small ROIs (0.084<p<0.31). Fourth, although there were no indications of systematic reproducibility bias, the 95% limits of agreement were so broad that the risk of disagreement between the measurements could affect the clinical use of the measurements. This lack of reproducibility should be addressed.
Conclusion and advances in knowledge:
A quantitative approach to DCE-CT is not a clinically usable method for characterising lung tumours.
In the Western world, lung cancer remains the leading cause of cancer-related death in both males and females. The disease has a poor prognosis with an overall 5-year mortality rate of approximately 84% [1]. In patients with suspected lung cancer, the first imaging examination is that of a chest radiograph followed by a contrast-enhanced CT of the thorax and upper abdomen. Depending on the local arrangements, this is followed by other examinations such as dynamic contrast-enhanced CT (DCE-CT).
DCE-CT is a tool which, in theory, can quantify the perfusion of tissues by calculating the delivery of a contrast agent, and therefore blood, to these tissues [2–4]. This is expected to be clinically useful, and, accordingly, studies investigating the use of DCE-CT in oncology are increasingly reported in the literature [5–7].
The fundamental principle of DCE-CT is based on the temporal changes in tissue density after an intravenous administration of iodinated contrast media. By obtaining, in quick succession, a series of images of a particular tissue of interest, it is possible to record the temporal changes in tissue attenuation occurring after intravenous injection of the contrast. The quantification of perfusion recorded by CT is performed using mathematical modelling techniques.
In quantitative analysis, the operator places a region of interest (ROI) in the tumour, and a dedicated perfusion software is then used to calculate a numeric perfusion value for the ROI. This numeric value represents the mean of the numeric perfusion values for each voxel within the ROI, and, as such, it provides an estimate of the total perfusion of the selected tumour volume.
The purpose of this study was to examine whether DCE-CT could be used to characterise and safely distinguish between malignant and benign lung tumours in patients with suspected lung cancer. For this purpose, a quantitative approach was used, by which lung tumours were measured and analysed using a dedicated computer software. Reproducibility was also verified.
METHODS AND MATERIALS
Study population
The study conformed with Danish legal requirements. Institutional review board approval was obtained from the Aarhus County Committee on Biomedical Research Ethics, Aarhus, Denmark, case number M-AAA-20061020. Patients with suspected lung cancer and a visible tumour on their chest radiograph, and who were referred to a tertiary sector hospital for diagnosis, were prospectively identified for inclusion during a 2.5-year period. All of them received contrast-enhanced CT of the chest and upper abdomen. Those who signed an informed consent form to participate in the study also received DCE-CT. 67 patients signed the informed consent form and were included in the study. However, because of technical difficulties, only 59 of these patients were included in the final analyses. The study design was prospective.
Procedures
DCE-CT included only slices with tumours and was performed immediately after standard contrast-enhanced CT of the chest and upper abdomen with a multidetector row CT scanner (Philips Brilliance™ CT 64-channel scanner; Philips Healthcare, Best, Netherlands). The acquisition parameters were collimation of 64×0.625 mm, section thickness of 5.0 mm and an increment of 5.0 mm. A short sharp bolus injection of 60 ml of iodixanol (270 mg ml−1) (Visipaque™ 270; GE Healthcare, Oslo, Norway) was administered to all patients at a rate of 6 ml s−1. Patients were scanned every other second for a period of 80 s (40 s of active scan time). During the examination, the patients were instructed to hold their breath for as long as possible or to breathe shallowly. Data sets of raw pictures were transferred to a Philips Extended Brilliance workspace workstation v. 4.02 (Philips Healthcare) and were reviewed with the application Functional CT v. 4.5.2 (Philips Healthcare).
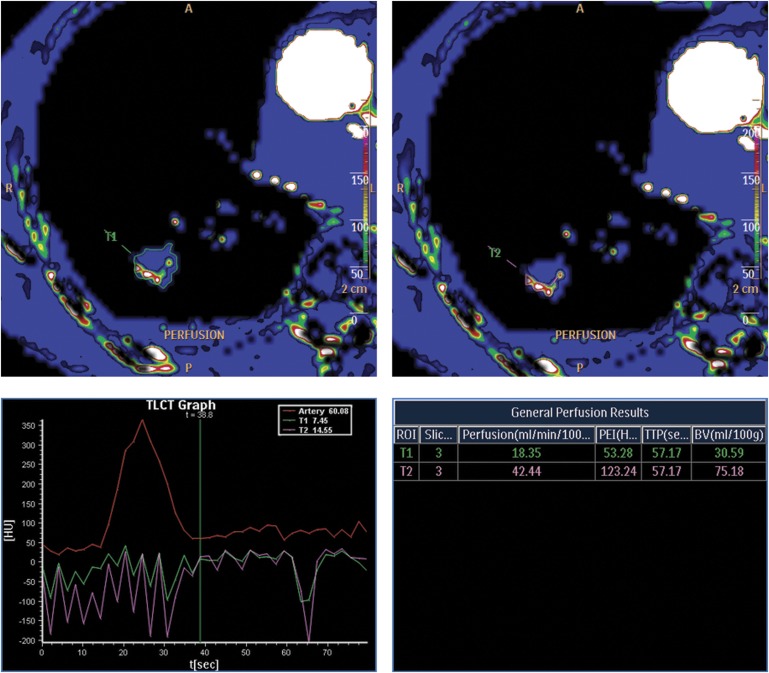
Blinded images were reviewed. Primary software input consisted of an arterial ROI placed in the aorta. This yielded the time-averaged maximum intensifier projection (tMIP) perfusion maps. Secondary software input consisted of multiple tissue ROIs placed in lung tumours. First, a tissue ROI was placed over the entire tumour using perfusion maps, with options set to default values (large ROI). Second, a tissue ROI was placed in the maximally perfused parts of the tumour using perfusion maps, with options set to default values (small ROI). This process was repeated for each contiguous axial level of each tumour to ensure complete coverage of the tumour. The vendor-specific default values were 300 Hounsfield units (HUs) of bone (everything >300 HU was whitened), −500 HU of air (everything <−500 HU was blackened), highlighting the vessels deactivated. Figure 1 illustrates the ROI placements.
Figure 1.
Examples of ROI placements: T1, large ROI and T2, small ROI. The patient was a 69-year-old male with an adenocarcinoma. Perfusion curves and values are also displayed. BV, blood volume; HU, Hounsfield unit; PEI, peak enhancement intensity; ROI, region of interest; t, time; TTP, time-to-peak.
Using the maximum slope method, the computer analysed the tissue ROIs voxel by voxel. This yielded two quantitative parameters: regional tumour blood flow (blood flow measured in ml×min−1×100 ml−1) and regional tumour blood volume (blood volume measured in ml×100 ml−1); a semi-quantitative parameter: peak enhancement intensity (peak enhancement measured in HU); and time to peak (measured in seconds). Finally, medians of the individual measurements of each tumour were computed to ensure that each tumour was represented by only one set of large ROI measurements and only one set of small ROI measurements. Medians were chosen to avoid extreme outliers.
All DCE-CT examinations were reviewed twice. The first review was to study the method and the second review was to study the reproducibility. No participant data (name, patient identification and clinical data) were visible to the reviewers.
The reference standard was tissue sampling. As such, all malignant and non-malignant diagnoses were verified by tissue sampling. Three separately obtained non-malignant tissue sampling results were accepted. In most cases, tumour material was obtained by fluoroscopy-guided or CT-guided transthoracic needle-aspiration biopsies. However, in selected cases, tumour material was obtained by bronchoscopy or by video-assisted thoracic surgery. That way, a definitive diagnosis was obtained in all cases in this study.
Statistics
Two different methods of measurement were compared: large ROIs and small ROIs. Only the first set of measurements by each method was used to study the methods; the second set of measurements was used to study the reproducibility. Analyses were made on the logarithmic scale because of the non-normal distribution of the individual measurements and because of the variance in homogeneity of the differences between the methods of measurement. After logarithmic transformation, the individual measurements approached a normal distribution, and the variance of the differences between the methods of measurement approached homogeneity. Log scale means and mean differences between the methods of measurement were computed, and paired t-tests were used to assess whether there were statistically significant differences between the methods of measurement. Results were presented as medians, median ratios and 95% limits of agreement (95% LoA). All transformations were done according to the mathematical relationship:
Log scale means and mean differences between malignant and benign tumours were computed, and unpaired t-tests were used to assess whether any of the perfusion parameters could be used to distinguish between malignant and benign tumours. Results were presented as medians and were illustrated by box and whisker plots.
Log scale agreement plots were used to assess the reproducibility of the methods. Results were presented as median ratios and 95% LoA as described by Bland and Altman [8,9]. The licenced statistical software package STATA/SE 11 (StataCorp LP, TX) was used.
RESULTS
Baseline population
29 males and 30 females with a mean age (range) of 69 (40–86) years participated in the study. Mean tumour size (range) was 36 (11–106) mm.
Overall, 80% (47/59) of the tumours were malignant and 20% (12/59) were benign. The malignant tumours were distributed as 4% (2/47) small cell lung carcinomas, 28% (13/47) squamous cell carcinomas, 38% (18/47) adenocarcinomas, 2% (1/47) large cell carcinomas, 19% (9/47) other or unclassified lung carcinomas and 9% (4/47) metastases from other cancers.
Differences, large regions of interest and small regions of interest
Median blood flow, blood volume and peak enhancement were 25 ml×min−1×100 ml−1, 13 ml×100 ml−1 and 35 HU, respectively, for large ROIs and 68 ml×min−1×100 ml−1, 32 ml×100 ml−1 and 75 HU, respectively, for small ROIs.
Generally, small ROI measurements were higher than those of large ROIs. Thus, the median ratios of blood flow, blood volume and peak enhancement were 2.8, 2.5 and 2.1, respectively; all were highly significant (p<0.001). Table 1 summarises the median results, median ratios and 95% LoA for the two methods of measurement.
Table 1.
Differences between large regions of interest (ROIs) and small ROIs. Medians, median ratios and 95% limits of agreement (95% LoA)
| Parameter | Large ROIs (medians) | Small ROIs (medians) | Median ratio | 95% LoA | p |
| Blood flow (ml×min−1×100 ml−1) | 25 | 68 | 2.8 | 0.24–32 | <0.001 |
| Blood volume (ml×100 ml−1) | 13 | 32 | 2.5 | 0.13–49 | <0.001 |
| Peak enhancement (HU) | 35 | 75 | 2.1 | 0.32–14 | <0.001 |
HU, Hounsfield unit.
Large regions of interest
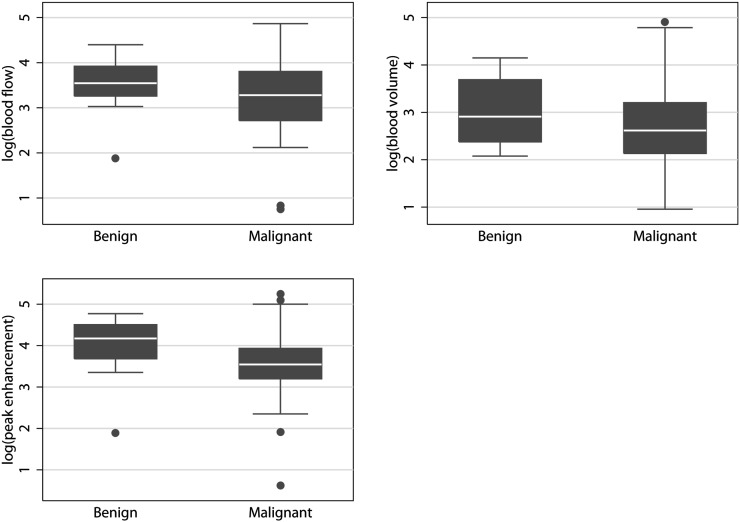
Median blood flow, blood volume and peak enhancement were 23 ml×min−1×100 ml−1, 13 ml×100 ml−1 and 32 HU, respectively, for malignant tumours and 33 ml×min−1×100 ml−1, 15 ml×100 ml−1 and 53 HU, respectively, for benign tumours. The median ratios between malignant and benign tumours were not significant for blood flow (p=0.27), blood volume (p=0.76) or peak enhancement (p=0.13). Therefore, none of the parameters could be used to distinguish between malignant and benign tumours. Table 2 summarises the results for malignant and benign tumours. Figure 2 plots the results.
Table 2.
Results of tumour characterisation
| Method | Description | Difference between malignant and benign tumours |
| Large ROIs | Entire tumour | 0.130<p<0.76 |
| Small ROIs | Maximum perfused parts of tumour | 0.084<p<0.31 |
ROI, region of interest.
Figure 2.
Large regions of interest box and whiskers plots. None of the quantitative or semi-quantitative parameters could be used to distinguish between the malignant and benign tumours.
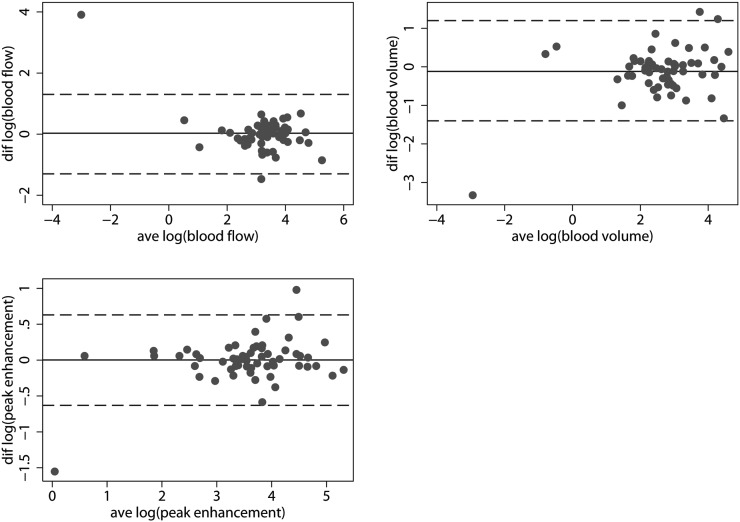
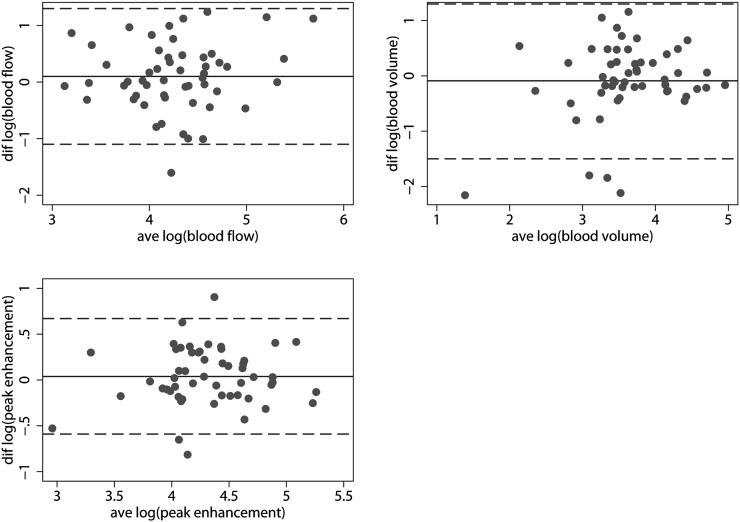
The median ratios of reproducibility approached one indicating no systematic bias concerning the reproducibility of large ROIs. However, the 95% LoA was so broad that, although not systematically biased, the risk of disagreement between measurements could potentially affect the clinical use of these measurements. Thus, the 95% LoA for the median ratios of reproducibility of blood flow, blood volume and peak enhancement were 0.28–3.80, 0.24–3.20 and 0.54–1.90, respectively. Table 3 summarises the median ratios of reproducibility and the 95% LoA for the two sets of measurements by large ROIs. Figure 4 plots the log (95% LoA).
Table 3.
Reproducibility of large regions of interest (ROIs) and small ROIs. Median ratios and 95% limits of agreement (LoA)
| Parameter | Large ROIs | 95% LoA | Small ROIs | 95% LoA |
| Blood flow (ml×min−1×100 ml−1) | 1.00 | 0.28–3.8 | 1.10 | 0.33–3.7 |
| Blood volume (ml×100 ml−1) | 0.89 | 0.24–3.2 | 0.91 | 0.23–3.6 |
| Peak enhancement (HU) | 1.00 | 0.54–1.9 | 1.00 | 0.55–1.9 |
HU, Hounsfield unit.
Figure 4.
Reproducibility data—large ROIs. (Left to right, top to bottom) agreement plots for log (blood flow), log (blood volume) and log (peak enhancement). Punctuated lines show the 95% limits of agreement; solid lines show the mean differences. Notice the broad 95% limits of agreement. ave, average; diff, difference, ROI, region of interest.
Small regions of interest
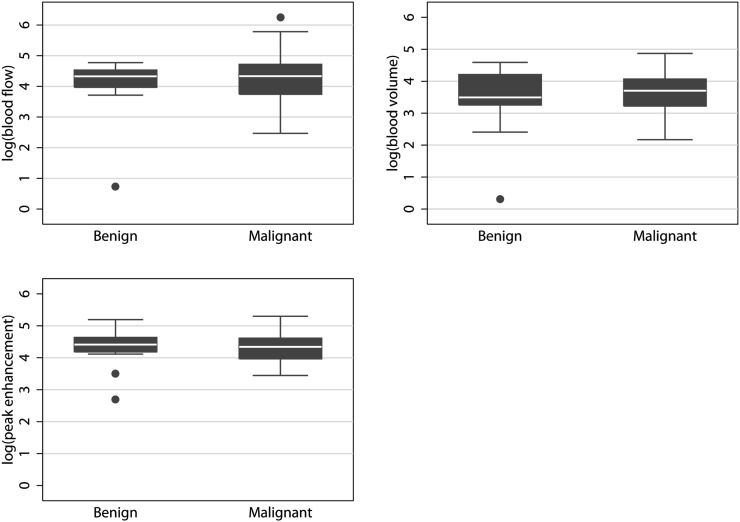
Median blood flow, blood volume and peak enhancement were 72 ml×min−1×100 ml−1, 36 ml×100 ml−1 and 75 HU, respectively, for malignant tumours, and 55 ml×min−1×100 ml−1, 21 ml×100 ml−1 and 74 HU, respectively, for benign tumours. The median ratios between malignant and benign tumours were not significant for blood flow (p=0.31), blood volume (p=0.084) or peak enhancement (p=0.13). Therefore, none of the parameters could be used to distinguish between malignant and benign tumours. Table 2 summarises the results for malignant and benign tumours. Figure 3 plots the results.
Figure 3.
Small ROIs box and whiskers plots. As was also the case with large ROIs, none of the quantitative or semi-quantitative parameters could be used to distinguish between the malignant and benign tumours. ROI, region of interest.
As was the case with large ROIs, the median ratios of reproducibility approached one, indicating no systematic bias concerning the reproducibility of small ROIs. However, the 95% LoA was so broad that, although not systematically biased, the risk of disagreement between measurements could potentially affect the clinical use of these measurements. Thus, the 95% LoA values for the median ratios of reproducibility of blood flow, blood volume and peak enhancement were 0.33–3.70, 0.23–3.60 and 0.55–1.90, respectively. Table 3 summarises the median ratios of reproducibility and the 95% LoA for the two sets of measurements by small ROIs. Figure 5 plots the log (95% LoA).
Figure 5.
Reproducibility data—small ROIs. (Left to right, top to bottom) agreement plots for log (blood flow), log (blood volume) and log (peak enhancement). Punctuated lines show the 95% limits of agreement; solid lines show the mean differences. Notice the broad 95% limits of agreement. ave, average; diff, difference; ROI, region of interest.
DISCUSSION
The purpose of this study was to examine whether DCE-CT could characterise and safely distinguish between the malignant and benign lung tumours. For this purpose, 59 participants with suspected lung cancer and lung tumours on chest radiographs were included.
Using a quantitative approach to DCE-CT, two separate sets of tissue ROIs were placed: large ROIs and small ROIs. This yielded a plethora of results, as follows. First, a statistical issue deserves mentioning. Our data were unambiguously in favour of logarithmic transformation before analysis. Data transformation lowered variance and made analyses as well as results more robust. Second, there were highly significant differences between large ROI and small ROI measurements. Thus, small ROI measurements were significantly higher (p<0.001). This was supported by median ratios and by 95% LoA. Third, neither quantitative parameters (blood flow and blood volume) nor semi-quantitative parameters (peak enhancement) could be used to distinguish between malignant and benign tumours. This was irrespective of the method of quantification [large ROIs (0.13<p<0.76); small ROIs (0.084<p<0.31)]. Fourth, although there were no indications of systematic reproducibility bias, the 95% LoA was so broad that the risk of disagreement between measurements could affect the clinical use of the measurements. This was irrespective of the method of quantification.
Differences between large regions of interest and small regions of interest
Measurement differences between large ROIs and small ROIs were highly significant. Considering that malignant lung tumours are often necrotic at the time of examination, it makes sense that small ROIs, which represent the actively perfused parts of the tumours, are more perfused than large ROIs, which represents the entire tumours. Therefore, naturally, it should always be specified which method is used in a given study.
Malignant vs benign tumours
Neither large ROIs nor small ROIs could be used to distinguish between the malignant and benign tumours. This was irrespective of whether quantitative or semi-quantitative measures were applied. Considering that small ROIs are thought to only reflect viable tumour tissue, this was a surprise.
According to Zhang and Kono [10], perfusion and peak enhancement were higher for malignant and inflammatory lesions than for benign lesions. These results were confirmed by Yi et al and Li et al [7,11–13]. As noted, there is a tradition of reporting malignant and inflammatory lesions together and then distinguishing these lesions from (other) benign lesions in a dichotomised setting. This indicates that it may have also been difficult to distinguish between malignant and benign lesions in other studies. Therefore, we find it difficult to recommend dynamic contrast-enhanced CT of lung tumours in patients with suspected lung cancer.
Reproducibility
Reproducibility was also troublesome. Although there were no indications of systematic reproducibility bias, the 95% LoA between repeated measurements of large ROIs and small ROIs was quite broad, indicating significant study variance. As expected, variance was highest for small ROIs.
DCE-CT reproducibility was studied by Li et al [11,12] for early stage lung cancer. In these reports, intraclass correlation coefficients were applied with excellent results. However, intraclass correlation coefficients can be misleading and may not reveal the clinical use of given measurements [8,9,14]. Thus, we tend to agree with Ng et al [15,16], who, in a study regarding late-stage lung cancer, concluded that the broad 95% LoA could potentially be of concern. We consider this lack of reliable reproducibility as another setback for the clinical use of DCE-CT for patients with suspected lung cancer [17].
Limitations
Obviously, the decision to only include patients with suspected lung cancer and a visible tumour on their chest radiograph introduces a strong selection bias in this study. This selection is responsible for the high prevalence of malignancy in the study. As such, it may also be a possible cause for discrepancies between our study and previous works on the subject. However, it should also be recognised that although the population is selected, it represents our standard clinical work-up for patients with suspected lung cancer. Therefore, we consider this selection a strength and notice that it increases the prevalence of disease in the examined population to >80%. This is a significant result in itself.
The most important technical limitation of our study and of DCE-CT in general is respiratory motion, which can lead to image misregistration and errors in calculation of perfusion values. Respiratory motion is a challenge for the actual perfusion values and for the reproducibility. This was evaluated in a study with 11 lung tumour patients by Ng et al [18] using 16-detector row CT. The authors found that the perfusion values were significantly influenced by respiratory motion and the duration of data acquisition. In our study, the patients were instructed to hold their breath or to breathe shallowly in an attempt to minimise respiratory motion. In future, the use of modern respiratory-gated 256- or 320-detector row CT may improve misregistration through more extensive coverage, however, reducing respiratory artefacts.
Another important limitation of DCE-CT is quantification reproducibility. As already discussed, in our study and in previous reports, reproducibility was unreliable.
CONCLUSION
Over a period of years, we offered patients with suspected lung cancer the opportunity of a DCE-CT examination if they had a lung tumour on their chest radiograph. This resulted in 59 technically sufficient DCE-CT examinations. The average tumour size was 36 mm, and some tumours were as large as 110 mm. The prevalence of malignancy was 80%. We examined a quantitative approach by which tumours were quantified and analysed using dedicated computer software.
This approach gave rise to several conclusions concerning DCE-CT analysis and the use of DCE-CT in the diagnosis of lung cancer. First, because of their non-normal distribution, DCE-CT measurements must be analysed using log scale data transformation. However, logarithmic transformation of data before analysis has not been standardised thus far. Second, the ROI method used in a given study should always be specified in advance. Third, neither large ROIs nor small ROIs give results with which it is possible to distinguish between malignant and benign tumours. Fourth, the lack of reproducibility should be addressed. Accordingly, our results reveal that a quantitative approach to DCE-CT is not a clinically usable method for characterising lung tumours.
FUNDING
This study was generously supported by a grant from the Eva and Henry Fraenkel's Memorial Foundation.
REFERENCES
- 1.SEER cancer statistics review, 1975-2008 [homepage on the internet]. Bethesda, MD: National Cancer Institute; 2010. [cited 2011 05/16]. Available from: http://seer.cancer.gov/csr/1975_2008/ [Google Scholar]
- 2.Miles KA, Hayball M, Dixon AK. Colour perfusion imaging: a new application of computed tomography. Lancet 1991;337:643–5 [DOI] [PubMed] [Google Scholar]
- 3.Miles KA, Hayball MP, Dixon AK. Functional images of hepatic perfusion obtained with dynamic CT. Radiology 1993;188:405–11 [DOI] [PubMed] [Google Scholar]
- 4.Miles K, Dawson PH, Blomley M. Functional computed tomography. Oxford, UK: Isis Medical Media; 1997 [Google Scholar]
- 5.Miles KA. Tumour angiogenesis and its relation to contrast enhancement on computed tomography: a review. Eur J Radiol 1999;30:198–205 [DOI] [PubMed] [Google Scholar]
- 6.Miles KA, Charnsangavej C, Lee FT, Fishman EK, Horton K, Lee TY. Application of CT in the investigation of angiogenesis in oncology. Acad Radiol 2000;7:840–50 [DOI] [PubMed] [Google Scholar]
- 7.Yi CA, Lee KS, Kim EA, Han J, Kim H, Kwon OJ, et al. Solitary pulmonary nodules: dynamic enhanced multi-detector row CT study and comparison with vascular endothelial growth factor and microvessel density. Radiology 2004;233:191–9 10.1148/radiol.2331031535 [DOI] [PubMed] [Google Scholar]
- 8.Bland JM, Altman DG. Measurement in medicine: the analysis of method comparison studies. Statistician 1983;32:307–17 [Google Scholar]
- 9.Bland JM, Altman DG. Statistical methods for assessing agreement between two methods of clinical measurement. Lancet 1986;1:307–10 [PubMed] [Google Scholar]
- 10.Zhang M, Kono M. Solitary pulmonary nodules: evaluation of blood flow patterns with dynamic CT. Radiology 1997;205:471–8 [DOI] [PubMed] [Google Scholar]
- 11.Li Y, Yang ZG, Chen TW, Deng YP, Yu JQ, Li ZL. Whole tumour perfusion of peripheral lung carcinoma: evaluation with first-pass CT perfusion imaging at 64-detector row CT. Clin Radiol 2008;63:629–35 10.1016/j.crad.2007.12.012 [DOI] [PubMed] [Google Scholar]
- 12.Li Y, Yang ZG, Chen TW, Chen HJ, Sun JY, Lu YR. Peripheral lung carcinoma: correlation of angiogenesis and first-pass perfusion parameters of 64-detector row CT. Lung Cancer 2008;61:44–53 10.1016/j.lungcan.2007.10.021 [DOI] [PubMed] [Google Scholar]
- 13.Li Y, Yang ZG, Chen TW, Yu JQ, Sun JY, Chen HJ. First-pass perfusion imaging of solitary pulmonary nodules with 64-detector row CT: comparison of perfusion parameters of malignant and benign lesions. Br J Radiol 2010;83:785–90 10.1259/bjr/58020866 [DOI] [PMC free article] [PubMed] [Google Scholar]
- 14.Bland JM, Altman DG. Measurement error and correlation coefficients. BMJ 1996;313:41–2 [DOI] [PMC free article] [PubMed] [Google Scholar]
- 15.Ng QS, Goh V, Fichte H, Klotz E, Fernie P, Saunders MI, et al. Lung cancer perfusion at multi-detector row CT: reproducibility of whole tumor quantitative measurements. Radiology 2006;239:547–53 10.1148/radiol.2392050568 [DOI] [PubMed] [Google Scholar]
- 16.Ng QS, Goh V, Klotz E, Fichte H, Saunders MI, Hoskin PJ, et al. Quantitative assessment of lung cancer perfusion using MDCT: does measurement reproducibility improve with greater tumor volume coverage? AJR Am J Roentgenol 2006;187:1079–84 10.2214/AJR.05.0889 [DOI] [PubMed] [Google Scholar]
- 17.Pepe MS. The statistical evaluation of medical tests for classification and prediction. Oxford, UK/New York, NY: Oxford University Press; 2003 [Google Scholar]
- 18.Ng CS, Chandler AG, Wei W, Anderson EF, Herron DH, Charnsangavej C, et al. Reproducibility of perfusion parameters obtained from perfusion CT in lung tumors. AJR Am J Roentgenol 2011;197:113–21 [DOI] [PubMed] [Google Scholar]


